Structural characterization of FeCo alloy nanoparticles embedded in SBA-16 and their catalytic application for carbon nanotubes production†
D.
Carta
a,
G.
Navarra
a,
A.
Falqui
b,
Z.
Kónya
c and
A.
Corrias
*a
aDipartimento di Scienze Chimiche and INSTM, Università di Cagliari, S. P. Monserrato-Sestu, km 0.700, I-09042, Monserrato, Cagliari, Italy. E-mail: corrias@unica.it
bIstituto Italiano di Tecnologia., I. I. T. Via Morego 30, 16163, Genova, Italy
cDepartment of Applied and Environmental Chemistry, University of Szeged., Rerrich Bela ter 1, H-6720, Szeged, Hungary
First published on 1st August 2012
Abstract
The formation of FeCo alloy nanoparticles embedded in a highly ordered 3D cubic mesoporous silica matrix (SBA-16) was thoroughly studied using several techniques. In particular, the selectivity of Extended X-ray absorption fine structure and X-ray absorption near-edge structure spectroscopy at both the Fe and Co K-edges allowed us to determine that before reduction treatment Fe and Co are present in a poorly crystalline environment, while after reduction treatment FeCo nanoparticles with the typical bcc structure are formed. FeCo alloy nanoparticles are used in several applications: biomedical (magnetic carriers for drug delivery and cell separation), magnetic (data storage) and catalytic. In this work, FeCo nanoparticles formed in situ in the SBA-16 matrix were used for the production of carbon nanotubes by catalytic chemical vapour deposition. Transmission electron microscopy indicates that good quality multi-walled carbon nanotubes are obtained.
1. Introduction
Nanocomposites formed by active nanoparticles dispersed in a highly porous support are widely studied for their important biomedical, magnetic and catalytic applications.1 The peculiar properties of nanoparticles are due to their small particle size, high surface to volume ratio, morphology and surface coating. The dispersion of nanoparticles in a highly porous support preserves these properties by avoiding their agglomeration and coalescence. Metal nanoparticles supported on porous materials can find application in medicine as contrast agents in magnetic resonance imaging2 and biosensors3 and in catalysis as heterogeneous catalysts for oxidation,4 hydrogenations5 and C–C coupling reactions.6 A porous matrix is the ideal host for catalytic applications of nanoparticles because the matrix not only acts as a support but also plays an active role in the catalytic process; in fact, the porosity of the matrix influences the accessibility of the active catalytic particles, affecting both selectivity and activity.Recently, increasing attention has been given to nanocomposites formed by FeCo alloy nanoparticles dispersed in a porous matrix. FeCo alloy nanoparticles exhibit exceptional magnetic properties which are being used in highly sensitive magnetic sensors7 and magnetic carriers,8 and have excellent catalytic properties, in particular, for decomposition of light hydrocarbons to hydrogen and carbon.9 The observation of carbon nanotube formation during methane decomposition10 has driven a new research field where FeCo-based alloys11–13 and FeCo nanoparticles are used for the synthesis of both single-, double- and multi-walled carbon nanotubes (CNTs).14–16 One of the best supports for nanoparticles to be used as catalysts for CNT production is mesoporous silica, which has an ordered array of mesopores; the pore sizes in mesoporous silica (20–500 Å) are in the range of the usual diameters of CNTs and the uniform distribution of pore dimensions where nanoparticles are allocated facilitates the production of CNTs with a narrow distribution of diameters. In particular, a cubic mesoporous silica support such as SBA-16, characterized by a three-dimensional (3D) ordered network of interconnected pores, appears to be an ideal matrix, providing easy accessibility and diffusion of reactants in all directions. Unlike the hexagonal SBA-15 form of mesoporous silica, where the pores form parallel channels that can be accessible in only one direction, the cubic mesoporous silica has not been studied extensively, probably because it can only be produced in a narrow range of conditions.17 In particular, very little work has been done on the synthesis of FeCo nanoparticles dispersed in a cubic mesoporous matrix.18 We have recently succeeded in preparing a series of catalysts containing nanoparticles of an FeCo alloy dispersed in an ordered 3D cubic SBA-16 matrix using a novel one-step, template-assisted sol–gel technique.19 In accordance with this technique, Fe and Co inorganic salts were added during the SBA-16 formation and FeCo nanoparticles were formed upon calcination at 800 °C in a reducing atmosphere.
The structure of the active nanoparticles within the support plays a key role in the selectivity and activity of the catalyst towards the production of CNTs. However, X-ray diffraction (XRD) provides limited information because of the low concentration of the nanocrystalline phase with respect to the silica matrix; the very small size of the particles which causes peak broadening and the difficulty of distinguishing cobalt and iron which have very similar atomic scattering factors. X-ray Absorption Spectroscopy (XAS) techniques are ideal for studying multicomponent dilute and disordered materials since they are element-specific and sensitive to the local structure. Our previous XAS experiments on FeCo–SiO2 aerogels20 have shown that the possibility of studying separately the Fe and Co environments is essential in proving the formation of the FeCo alloy nanoparticles and the presence of additional phases, such as oxides, as well as identifying the precursor phases which lead to the formation of the alloy nanoparticles. Therefore, we have used Extended X-ray Absorption Fine Structure (EXAFS) and X-ray Absorption Near Edge Structure (XANES) spectroscopy at the Fe and Co K-edges to gather selective and detailed information on the Fe and Co phases present before and after the reduction treatment, which is carried out in order to obtain the final nanocomposites.
The structural characterization of the nanocomposites is correlated to the results of the catalytic tests for the production of CNTs by Catalytic Chemical Vapour Deposition (CCVD), which was carried out using the nanocomposites before reduction treatment. The FeCo nanoparticles formed in situ during the CNT production develop hydrogen, as confirmed by elemental analysis on single nanoparticles entrapped inside the CNTs.
2. Experimental
2.1 Synthesis of FeCo–SBA-16 nanocomposites
In order to check if the order of addition of reactants has an effect on the dispersion of the nanoparticles in the matrix, two slightly different synthetic methods (A and B) were used in order to obtain nanocomposites containing FeCo alloy nanoparticles (with an Fe:Co molar ratio of 1:1) dispersed in the SBA-16 matrix.In method A, 0.959 g of Fe(NO3)3·9H2O (Aldrich, 98%) and 0.690 g of Co(NO3)2·6H2O (Aldrich, 98%) were added to a mixture of 30 g of water and 120 g of HCl 2 M. 4.0 g of P127 (Aldrich) were then added at room temperature under stirring. Finally, 8.5 g of TEOS (Aldrich, 98%) were added to the solution which was left under stirring at room temperature for 20 hours.
In method B, 4.0 g of P127 were added to a mixture of 30 g of water and 120 g of HCl 2 M at room temperature under stirring, followed by the addition of 8.5 g of TEOS. 0.959 g of Fe(NO3)3·9H2O (Aldrich, 98%) and 0.690 g of Co(NO3)2·6H2O (Aldrich, 98%) were then added under stirring. The solution was left under stirring at room temperature for 20 hours.
The obtained nanocomposites were calcined by heating the product in air at 500 °C for 6 hours with a heating step of 1 °C min−1 in order to remove the template. After calcination in air, the nanocomposites were further treated at 800 °C in an H2 flow with a heating step of 10 °C min−1 and held at 800 °C for 2 hours, in order to form the FeCo alloy nanoparticles. Since samples obtained using method A and B did not show any significant differences, in the following only samples obtained with method B will be presented. The samples after calcination in air at 500 °C will be hereafter named FeCo_500 °C and the samples after reduction in the H2 flow FeCo_red_800 °C.
2.2 Characterization of FeCo–SBA-16 nanocomposites
X-ray energy dispersive spectroscopy (EDS), performed on a SEM Hitachi S-4700 at an accelerating voltage of 20 kV, was used to estimate the Fe and Co content in FeCo_500 °C. The EDS analysis (Fig. 1) indicates that in both samples the amount of Fe and the amount of Co are about 1%. EDS spectra also confirm that the Fe:Co ratio is 1:1, as expected.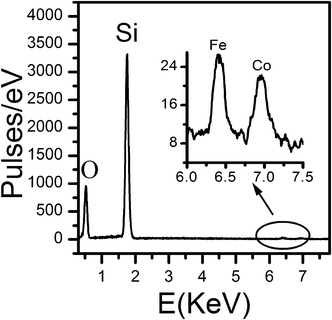 | ||
| Fig. 1 EDS spectra of FeCo_500 °C. | ||
Wide-angle X-Ray Diffraction (XRD) patterns were recorded on a Panalytical Empyrean diffractometer equipped with a graphite monochromator on the diffracted beam and a X'Celerator linear detector. The scans were collected within the range of 10–90° (2θ) using Cu Kα radiation.
The XAS experiments were carried out on FeCo_500 °C and FeCo_red_800 °C and on reference compounds on beamline 11.1 (XAFS) at the ELETTRA synchrotron (Trieste, Italy), apart from the reference sample, FePO4, whose data were collected on beamline A1 at the DORIS III synchrotron (HASYLAB, Germany).
Data were collected at room temperature using a Si(111) monochromator at the Fe and Co K-edges. Three ion chambers were used to measure the incident, transmitted and reference beam intensities, respectively. 5 μm Fe and Co foils were placed between the second and third ion chambers so that the absorption spectrum of the foil was recorded simultaneously, for energy-scale calibration. The energy of the first inflection point for Fe and Co foils was taken to be 7112 and 7709 eV, respectively. Samples with a suitable and highly uniform optical thickness were prepared from powders of the nanocomposites and of the reference compounds. The powders of reference samples (apart from FePO4) were dispersed in an inert solvent and then filtered onto polyethylene supports; the powders of the samples and of FePO4 were diluted in polyvinylpyrrolidone and pressed into pellets.
The XANES spectra were processed in the usual way to obtain normalized absorbance.21 XANES at the K-edge involves the excitation of a 1s photoelectron into low-lying empty states at the central atom with p-type symmetry. The K-edge XANES spectra of transition metals has a gradually sloping main absorption edge, with a pronounced step on the low energy side, a rounded main absorption peak, and approximately constant intensity following the edge. In contrast, transition metal oxides have a sharply rising main absorption edge, main absorption peak(s) of high intensity, and a notable drop in intensity after the main absorption peak. In addition, oxides may show a small pre-edge peak if the excited atom site has a lack of centrosymmetry. In both metals and oxides, oscillations in intensity occurring up to approximately 30 eV beyond the absorption edge are due to strong multiple-scattering or shape resonance around the excited atom site. The XANES spectra have been analysed using the “fingerprint” method, by comparing spectra from samples with those from reference compounds.
For the EXAFS data analysis, the program Viper was used to sum the data, identify the beginning of the absorption edge, E0, fit pre- and post-edge backgrounds, and hence to obtain the normalized absorbance χ as a function of the modulus of the photoelectron wavevector k.22 The modular package DL_EXCURV,23 based on the EXCURV98 code, was used to model the experimental χ(k) in order to extract structural information and obtain Fourier transforms corrected for phaseshifts. This code uses fast curved-wave theory24 and calculates ab initio the effective curved-wave backscattering amplitude of the scatterer, the phase shift due to the absorbing atom potential, the phase shift due to the scatterer, and the inelastic mean free path of the photoelectron.25,26 In DL_EXCURV the k-independent parameter AFAC (amplitude reduction due to many electrons processes) was determined to be 0.9 from fitting to the reference samples. The parameter EF, which is a correction to E0, was free to vary in all fits. The structural parameters were obtained by nonlinear least squares fitting in k-space with a k3 weighting of the total experimental EXAFS interference functions to emphasize the high-energy part of the spectrum. The fitting was carried out using the k range 2.5–12 Å−1, with 12 Å−1 being the highest accessible value at the Fe K-edge due to the presence of the Co K-edge. The same k range was used at the Co edge in order to achieve similar resolution. Fitting was performed by adding the most important multiple scattering paths due to collinear arrangement of atoms.27 The errors in the fit parameters, Ri, Ni and 2σi2, were obtained at the 95% confidence level,28 as calculated in EXCURV98. The number of fitted parameters was always less than the number of statistically independent data points, as estimated in the standard way.28
The quality of the fit was judged from the normalized sum of residuals:
| R-factor = Σn|kn3χexpt(kn) − kn3χfit(kn)| / Σn| kn3χexpt(kn)| × 100 | (1) |
Reasonable EXAFS fits of single shells typically have values of R-factor of around 20%; however, when the fit is performed on the total EXAFS interference functions, higher values of R-factor can still correspond to good fits especially if the fit does not include contribution from peaks at high R. For this reason, when Fourier Transforms (FTs) show prominent peaks beyond the fitted regions, the R-factors were calculated both on the experimental k3χ(k) and on the data obtained by inversely transforming the FT in the range corresponding to the shells that were actually fitted (R*).
2.3 Synthesis and characterization of CNTs
CNTs were obtained by CCVD of acetylene (C2H2) at 750 °C over the FeCo_500 °C catalysts. 100 mg of catalyst were placed in a quartz plate which was inserted into a reactor under a flow of 300 mL min−1 N2 for 10 minutes. Then, the reactor was inserted into a furnace at 750 °C and N2 was replaced with C2H2 (30 mL min−1) which was fluxed for 20 minutes. Unpurified CNTs were named FeCo_500 °C _CNT.Thermogravimetry (TG) and Differential Thermal Analysis (DTA) were carried out using a Mettler-Toledo TG/SDTA 851 in the range 25–1000 °C under oxygen flow (heating rate = 10 °C min−1, flow rate = 50 mL min−1).
Conventional Transmission Electron Microscopy (TEM) images were recorded on a JEOL 200CX microscope operating at 200 kV. The samples were deposited on a holey carbon-coated copper grid.
High Resolution Transmission Electron Microscopy (HRTEM) images were recorded on a Jeol 2100F microscope equipped with a Schottky field emission gun operating at 200 kV.
Scanning TEM (STEM) imaging in High Angle Annular Dark Field (HAADF) geometry was carried out using a Jeol 2200FS microscope equipped with a spherical aberration-corrected objective lens, an Omega in-column energy filter, a Field Emission Gun (FEG) and working at an acceleration voltage of 200 kV. The Energy Dispersive X-Ray Spectroscopy (EDS) chemical analysis was performed in that geometry on chosen zones with an area of some square nanometres by means of a Jeol JED 2300 Si(Li) detector and using a probe size of 0.7 nm.
3. Results and discussion
3.1 XRD of nanocomposites
Wide-angle XRD patterns of the FeCo_500 °C and FeCo_red_800 °C nanocomposites are reported in Fig. 2. A halo due to amorphous silica is observed at 2θ around 20–30°. The patterns of the sample calcined at 500 °C do not show any additional Bragg peaks, indicating that Fe and Co are present in the form of intermediate phases which are highly disordered and/or dispersed. After reduction at 800 °C, a weak and broad peak at 2θ ∼ 45° appears, which is due to the formation of a metal phase. However, the XRD results do not allow one to understand if the FeCo alloy is formed, fcc Co, bcc Fe and bcc FeCo all having the main Bragg reflection at 2θ ∼ 45°.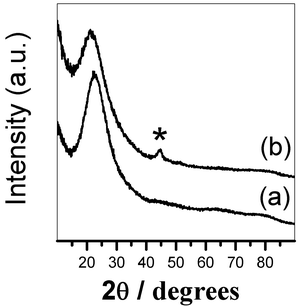 | ||
| Fig. 2 Wide-angle XRD patterns of: (a) FeCo_500 °C and (b) FeCo_red_800 °C. | ||
3.2 XAS of FeCo_500 °C
The XANES spectrum of FeCo_500 °C at the Fe K-edge is reported in Fig. 3A along with the spectra of γ-FeO3 and FePO4 reference compounds, while the XANES spectrum at the Co K-edge is reported in Fig. 3B together with the spectra of Co3O4 and CoO reference compounds. Information on the oxidation state of iron and cobalt has been obtained by comparing the absorption edge position with those of several iron and cobalt reference compounds (see ESI†). At the Fe K-edge, the position of the main edge is typical of iron in the oxidation state +3. Moreover, as shown in Fig. 3A, the XANES profile of the sample is very similar to that of FePO4, a compound containing Fe3+ in tetrahedral coordination.29,30 In particular, a strong pre-peak around 7114 eV, which is typical of a highly non-centro-symmetric environment, is observed for FeCo_500 °C, similar to FePO4. Fe3+ in tetrahedral coordination has been observed in several composites systems, such as iron containing mesoporous silica.31–34 In fact, the post-edge XANES features of our sample are very similar to those observed for 4-fold iron in mesoporous silica. At the Co K-edge, the position of the main edge is typical of cobalt in the oxidation state +2. As shown in Fig. 3B, the XANES profile of the sample is quite similar to that of CoO, a reference compound with Co2+ in octahedral coordination. A very weak pre-peak, typical of a centro-symmetric environment, is observed for FeCo_500 °C, similar to CoO. More details of the pre-peak region of the sample at both edges compared with those of the reference compounds can be found in the ESI.† The EXAFS interference functions of FeCo_500 °C at the Fe and Co K-edges are reported in Fig. 4A and 4B, respectively. At both edges the oscillations are quite weak, indicating that Fe and Co, after calcination at 500 °C, are in a poorly crystalline environment. This is confirmed by the FTs at both the Fe and Co K-edges, as reported in Fig. 4C and 4D, that mainly show a single peak, which is also in agreement with the XRD patterns that did not show any Bragg peak.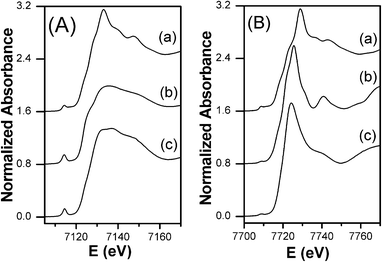 | ||
| Fig. 3 XANES spectra at the Fe K-edge (A): (a) γ-Fe2O3, (b) FePO4, (c) FeCo_500 °C; and Co K-edge (B): (a) Co3O4, (b) CoO, (c) FeCo_500 °C. | ||
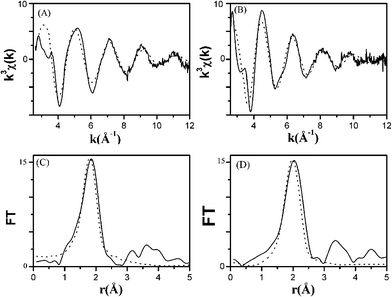 | ||
| Fig. 4 k 3 χ(k) interference functions of FeCo_500 °C at the Fe K-edge (A) and Co K-edge (B) and corresponding Fourier transforms at the Fe K-edge (C) and Co K-edge (D) from experiment (−) and fit results (…). | ||
The results of the fitting of the EXAFS oscillations are shown in Fig. 4 and the best-fit parameters are reported in Table 1. In agreement with the XANES results, the best fit of the EXAFS data was obtained with a single shell of 4 oxygens at the typical tetrahedral Fe(III)–O distance of 1.86 Å. At the Co K-edge, the data were fitted with a single shell with a coordination number of 6.0 oxygens at a distance of 2.04 Å, which is the typical octahedral Co(II)–O distance. The possibility of determining the different coordination environments of Fe and Co, as well as their oxidation state, confirms the extreme usefulness of XAS techniques in comparison to XRD in the characterization of the sample.
| Fe K-edge | Co K-edge | ||||||
|---|---|---|---|---|---|---|---|
| R(Å) | N (atoms) | 2σ2 (Å2) | R(Å) | N (atoms) | 2σ2 (Å2) | ||
| O | 1.86(1) | 4.0 | 0.018(2) | O | 2.04(1) | 6.0 | 0.024(1) |
| R factor = 43% | R factor = 41% | ||||||
| R* factor = 36% | R* factor = 30% | ||||||
| EF = 6.0(8) | EF = 5.3(7) | ||||||
3.3 XAS of FeCo_red_800 °C
The XANES spectra of FeCo_red_800 °C, along with the spectra of bcc Fe and fcc Co reference compounds, are reported in Fig. 5A and 5B at the Fe and Co K-edge, respectively. The XANES spectra of bcc Fe and fcc Co both present a shoulder prior to the main absorption edge, and the onset of the shoulder is known as the first inflection point in the spectrum. However, the spectra are different in that the main absorption edge for bcc Fe has a sharp peak at 7130 eV, which is 18 eV above the first inflection point, whereas the main absorption edge for fcc Co has a broad, rounded peak at 7730 eV, which is 22 eV above the first inflection point.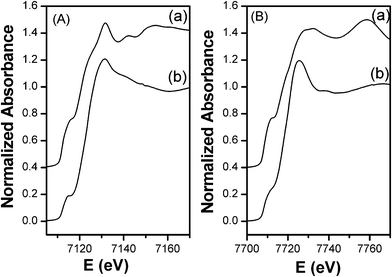 | ||
| Fig. 5 XANES spectra at the Fe K-edge (A): (a) bcc Fe, (b) FeCo_red_800 °C and Co K-edge (B): (a) fcc Co, (b) FeCo_red_800 °C. | ||
At the Fe K-edge, the XANES profiles of FeCo_red_800 °C are similar to those of bcc Fe. At the Co K-edge, the XANES profiles of FeCo_red_800 °C are more similar to bcc Fe than fcc Co, suggesting the formation of a bcc FeCo alloy. However, for both Fe and Co K-edges, FeCo_red_800 °C shows a reduced shoulder prior to the main absorption edge, suggesting that not all of the Fe and Co are metallic.
The EXAFS interference functions of FeCo_red_800 °C, along with those of bcc Fe and fcc Co reference compounds, are reported in Fig. 6A and 6B at the Fe and Co K-edge, respectively. The frequencies of the oscillations of the samples at both edges are very similar to those of bcc Fe, confirming that most of the Fe and Co are present in the form of a bcc FeCo alloy. The amplitudes of the oscillations of the samples are smaller than those of the bcc Fe, which is a consequence of the nanometric dimensions of the FeCo particles in the nanocomposites. It has to be noted that the amplitudes of the oscillations of the samples at the Fe K-edge are slightly smaller than the amplitudes of the oscillations at the Co K-edge.
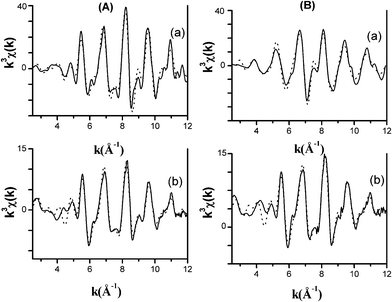 | ||
| Fig. 6 k 3 χ(k) interference functions at the Fe K-edge (A): (a) bcc Fe, (b) FeCo_red_800 °C and Co K-edge (B): (a) fcc Co, (b) FeCo_red_800 °C, from experiment (−) and fit results (…). | ||
The corresponding FTs at the Fe and Co K-edges, which are shown in Fig. 7A and 7B, respectively, confirm what was already observed in the interference functions. The FTs of both samples are similar to those of the bcc Fe at both edges, while they have no similarities with that of fcc Co, excluding the formation of an fcc metallic phase. The amplitude of the FT peaks of both samples is smaller than that of the bcc Fe, which is a consequence of the nanometric dimensions of the FeCo particles. Moreover, the amplitudes of the FT peaks at the Fe K-edge are slightly smaller than those at the Co K-edge for both samples. Taking into account the XANES and EXAFS results, it is likely that a minor fraction of Fe and Co might be present in a non-metallic form, such as an oxide, with this fraction being slightly higher for Fe than Co.
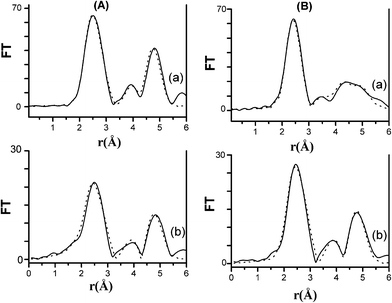 | ||
| Fig. 7 FTs at the Fe K-edge (A): (a) bcc Fe, (b) FeCo_red_800 °C and Co K-edge (B): (a) fcc Co, (b) FeCo_red_800 °C, from experiment (−) and fit results (…). | ||
The above qualitative observation obtained when comparing the EXAFS and XANES results of FeCo_red_800 °C nanocomposite with those of the reference compounds was used as a starting point for a more detailed analysis, performed by fitting the EXAFS interference functions. The results of the fitting of FeCo_red_800 °C, along with those of the bcc Fe and fcc Co reference compounds at the Fe and Co K-edge are reported in Fig. 7A and 7B, respectively. The fitting of the bcc Fe and fcc Co was performed on the basis of their known crystalline structures,35,36 keeping coordination numbers, Ni, fixed and allowing small variations of distances, Ri, (keeping Ri/R1 equal to the expected values for the bcc and fcc structures, respectively, R1 being the first shell distance), while the Debye–Waller factors, 2σi2, and EF were left free to vary. In both fcc and bcc structures, the strong multiple scattering contribution from paths involving collinear arrangements of atoms (1st shell and 5th shell in bcc structure and 1st shell and 4th shell in fcc structure) has been taken into account during the fitting. The best-fit parameters at the Fe and Co K-edge of the bcc Fe and the fcc Co were already reported in ref 20. The fitting of FeCo_red_800 °C was performed using the same strategy, using the same starting parameters as those corresponding to the bcc Fe, which has the same structure as the FeCo alloy, apart from a slight contraction in the unit cell parameter of the bcc FeCo alloy37 with respect to that of the bbc Fe.38 Accordingly, the Ri values obtained from the fit, which are reported in Table 2, are slightly lower than those obtained from the fitting of the bcc Fe reference compound. The Debye–Waller factors of the nanocomposite at both of the Fe and Co K-edges are higher than those obtained for the bcc Fe reference compound. This is due to the nanometric dimensions of particles in the nanocomposite, superficial sites being more disordered. It should be pointed out that the nanometric dimensions of the nanoparticles could also give rise to a decrease in coordination numbers. However, since a significant reduction of coordination number is only expected for particles below 5 nm,39 and the nanoparticle sizes in FeCo_red_800 °C are in the range 4–10 nm,19 we preferred to keep the coordination numbers fixed in order to decrease the number of free parameters.
| Fe K-edge | Co K-edge | |||||||
|---|---|---|---|---|---|---|---|---|
| FeCo_red_800 °C | FeCo_red_800 °C | |||||||
| % Alloy = 80(1) | ||||||||
| R(Å) | N (atoms) | 2σ2 (Å2) | R(Å) | N (atoms) | 2σ2 (Å2) | |||
| Fe | 2.47(1) | 8.0 | 0.026(1) | Co | 2.47(1) | 8.0 | 0.026(1) | |
| Fe | 2.82(1) | 6.0 | 0.026(1) | Co | 2.83(1) | 6.0 | 0.028(2) | |
| Fe | 4.03(1) | 12.0 | 0.033(3) | Co | 4.01(1) | 12.0 | 0.032(2) | |
| Fe | 4.70(4) | 24.0 | 0.046(1) | Co | 4.70(3) | 24.0 | 0.046(6) | |
| Fe | 4.95(1) | 8.0 | 0.018(1) | Co | 4.95(1) | 8.0 | 0.018(2) | |
| % Fe oxide = 20(2) | ||||||||
| O | 1.93(1) | 6 | 0.026(6) | |||||
| R factor = 30% | R factor = 32% | |||||||
| R* factor = 23% | R* factor = 22% | |||||||
| EF = 2.4(2) | EF = 3.1(2) | |||||||
The best fit of the EXAFS data at the Fe K-edge required an additional small Fe–O contribution at 1.93 Å, which is consistent with the oscillations of the interference functions of the samples at the Fe K-edge being slightly smaller than the corresponding functions at the Co K-edge, due to the presence of some iron oxide, probably at the surface of the nanoparticles. This result is in agreement with the stronger tendency for the oxidation of iron compared with cobalt. It has to be noted that XRD does not give any indication of the presence of metal oxides due to the predominance of the Bragg reflections due to the highly ordered bcc structure compared to those arising from the more disordered oxide phases, which are also present to a very low extent. Therefore, EXAFS analysis is fundamental in the detection of some oxide phases, as well as in confirming the presence of the bcc alloy.
3.4 Catalytic performance of FeCo_500 °C for CNT production
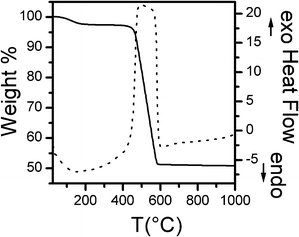
It is well known that metal or alloy nanoparticles act as active sites for the production of CNTs. However it has been reported that better catalytic performances are obtained if the metals/alloys are generated in situ during the CNT production from hydrogen formed by the reaction.40,41 Taking this into account, the FeCo_500 °C nanocomposite has been used to catalyze the CCVD production of CNT, so that the FeCo nanoparticles were obtained by in situ reduction of the oxidized species present in the sample calcined at 500 °C.An estimate of the amount of CNT produced was obtained from the TG curve of FeCo_500 °C _CNT, which is reported in Fig. 8, together with the corresponding DTA curve. A first moderate weight loss is observed between 25 °C and 150 °C (about 2 wt%), ascribed to the evaporation of adsorbed water. A second consistent weight loss is observed between 400 °C and 600 °C (about 48 wt%), corresponding to an exothermic event, as shown by the associated feature in the DTA curve. Thermal analysis of the CNTs allows us to distinguish amorphous carbon (which gives rise to a weight loss in the range 300–400 °C) from CNT (which give rise to a weight loss at >400 °C).42 However, since TGA is carried out in an O2 flow on the CNTs deposited on the original catalyst, constituted by FeCo alloy nanoparticles dispersed on mesoporous silica, the oxidation of the FeCo alloy nanoparticles will occur at the same time as carbon oxidation to form CO2. Due to the low FeCo content dispersed on the mesoporous silica, the amount of the CNTs produced is very close to the weight loss between 400 and 600 °C.
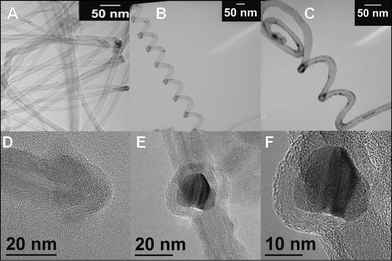
TEM and HRTEM images of FeCo_500 °C _CNT, which are reported in Fig. 9, show evidence of the formation of multi-walled CNTs (MWCNTs). The MWCNTs produced have an inner diameter in the range 3–10 nm and an outer diameter in the range 15–25 nm, with a rough estimation of the average number of walls of 15–25. Some images clearly show single FeCo alloy nanoparticles (15–20 nm) surrounded by graphene layers (Fig. 9E, 9F). It is interesting to observe the formation of curled and helical CNTs (Fig. 9B, 9C).
HAADF STEM images of some nanoparticles entrapped inside the CNTs are reported in Fig. 10 together with the corresponding EDS spectra, which indicate that both Fe and Co are present, confirming that the alloy nanoparticles are the active catalysts giving rise to the formation of the CNTs. These preliminary results on MWCNT production are quite promising, since the FeCo–SBA-16 catalysts could be used in the form of films for the production of aligned carbon nanotubes.
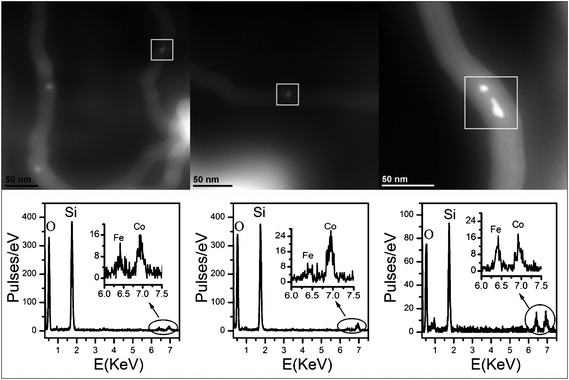 | ||
| Fig. 10 HAADF STEM images (top) and corresponding EDS spectra (bottom) of three regions of the FeCo_500 °C _CNT sample. | ||
4. Conclusions
High surface area nanocomposites containing FeCo nanoparticles dispersed in an ordered mesoporous SBA-16 matrix were prepared using a novel one-step sol–gel method followed by post-synthesis heating treatments including reduction in H2 at 800 °C. EXAFS and XANES measurements provide detailed and independent information on the Fe and Co environment in the nanocomposites before and after reduction in H2. In particular, while XRD does not show any Bragg peaks in the samples before reduction, EXAFS and XANES provide information on the oxidation state and of the coordination environment. More importantly, EXAFS and XANES prove that the reduction treatment gives rise to the formation of bcc FeCo alloy nanoparticles, as confirmed by the similarity of the EXAFS oscillations and FTs of FeCo_red_800 °C at both Fe and Co K-edges to those of bcc Fe. FeCo_500 °C nanocomposites reduced in situ were also proven to be successful catalysts in the CCVD production of MWCNTs. Good quality MWCNTs having an inner diameter in the range 3–10 nm and an outer diameter in the range 15–25 nm were obtained with a yield of about 48%.Acknowledgements
We would like to thank Dr M. Mohl, University of Szeged, Hungary, for EDS measurements, Dr G. Mountjoy and Mr R. Apps for providing the FePO4 data (collected at Hasylab under the EU funded scheme ELISA), and XAFS beamline scientists at Elettra, Dr L. Olivi and Dr A. Cognigni, for assistance during data collection. This work has been funded by the Italian Institute of Technology (IIT), project SEED “NANOCAT”, and with the contribution of “Ministero degli Affari Esteri, Direzione Generale per la Promozione del Sistema Paese”.References
- R. J. White, R. Luque, V. L. Budarin, J. H. Clark and D. J. Macquarrie, Chem. Soc. Rev., 2009, 38, 481 RSC.
- S. Mansson, E. Johansson, P. Magnusson, C. M. Chai, G. Hansson, J. S. Petersson, F. Stahlberg and K. Golman, Eur. Radiol., 2006, 16, 57 CrossRef.
- A. J. Haes and R. P. Van Duyne, J. Am. Chem. Soc., 2002, 124, 10596 CrossRef CAS.
- G. J. Hutchings, Chem. Commun., 2008, 10, 1148 RSC.
- M. Haruta, Chem. Rec., 2003, 3, 75 CrossRef CAS.
- D. Astruc, F. Lu and J. R. Aranzaes, Angew. Chem., Int. Ed., 2005, 44, 7852 CrossRef CAS.
- T. Sourmail, Prog. Mater. Sci., 2005, 50, 816 CrossRef CAS.
- A. Hütten, D. Sudfeld, I. Ennen, G. Reiss, W. Hachmann, U. Heinzmann, K. Wojczykowski, P. Jutzi, W. Saikaly and G. Thomas, J. Biotechnol., 2004, 112, 47 CrossRef.
- T. V. Reshetenko, L. B. Avdeeva, A. A. Khassin, G. N. Kustova, V. A. Ushakov, E. M. Moroz, A. N. Shmakov, V. V. Kriventsov, D. I. Kochubey, Y. T. Pavlyukhin, A. L. Chuvilin and Z. R. Ismagilov, Appl. Catal., A, 2004, 268, 127 CrossRef CAS.
- L. B. Avdeeva, T. V. Reshtenko, Z. R. Ismagilov and V. A. Likholobov, Appl. Catal., A, 2002, 228, 53 CrossRef CAS.
- P. Coquay, E. Flahaut, E. De Grave, A. Peigney, R. E. Vandenberghe and C. Laurent, J. Phys. Chem. B, 2005, 109, 17813 CrossRef CAS.
- P. Coquay, E. Flahaut, E. De Grave, A. Peigney, R. E. Vandenberghe and C. Laurent, J. Phys. Chem. B, 2005, 109, 17825 CrossRef CAS.
- Z. Kónya, I. Vesselényi, K. Lázár, J. Kiss and I. Kiricsi, IEEE Trans. Nanotechnol., 2004, 3, 73 CrossRef.
- E. Flahaut, A. Govindaraj, A. Peigney, C. Laurent, A. Rousset and C. N. R. Rao, Chem. Phys. Lett., 1999, 300, 236 CrossRef CAS.
- A. Falqui, D. Loche, M. F. Casula, A. Corrias, D. Gozzi and A. Latini, J. Nanosci. Nanotechnol., 2011, 11, 2215 CrossRef CAS.
- L. Vanyorek, D. Loche, H. Katona, M. F. Casula, A. Corrias, Z. Konya, A. Kukovecz and I. Kiricsi, J. Phys. Chem. C, 2011, 115, 5894 CAS.
- D. Zhao, Q. Huo, J. Feng, B. F. Chmelka and G. D. Stucky, J. Am. Chem. Soc., 1998, 120, 6024 CrossRef CAS.
- S. Costacurta, L. Malfatti, P. Innocenzi, H. Amenitsch, A. Masili, A. Corrias and M. F. Casula, Microporous Mesoporous Mater., 2008, 115, 338 CrossRef CAS.
- D. Carta, M. F. Casula, A. Corrias, A. Falqui, Á. Dombovári, A. Gálos and Z. Kónya, J. Nanosci. Nanotechnol., 2011, 11, 6735 CrossRef CAS.
- D. Carta, G. Mountjoy, M. Gass, G. Navarra, M. F. Casula and A. Corrias, J. Chem. Phys., 2007, 127, 204705 CrossRef CAS.
- A. Bianconi, X-ray absorption: principles, applications, techniques of EXAFS, SEXAFS and XANES, ed. D. C. Koninbsberger, R. Prins, Wiley, New York, Chapter 11, 1987 Search PubMed.
- K. V. Klementiev, Appl. Phys., 2001, 34, 209 Search PubMed.
- S. Tomic, B. G. Searle, A. Wander, N. M. Harrison, A. J. Dent, J. F. W. Mosselmans, J. E. Inglesfield, CCLRC Technical Report DL-TR-2005-001, 2005, ISSN 1362–0207 Search PubMed.
- S. J. Gurman, N. Binsted and I. Ross, J. Phys. C, 1984, 17, 143 CrossRef CAS.
- U. Von Barth and L. Hedin, J. Phys. C, 1972, 5, 1629 CrossRef CAS.
- E. D. Crozier, Nucl. Instrum. Methods Phys. Res., Sect. B, 1997, 133, 134 CrossRef CAS.
- B. K. Teo, J. Am. Chem. Soc., 1981, 103, 3990 CrossRef CAS.
- Error Report of the International XAFS Society Standards and Criteria Committee, 2000, (http://ixs.iit.edu/subcommittee_reports/sc/).
- S. Bordiga, R. Buzzoni, F. Geobaldo, C. Lamberti, E. Giamello, A. Zecchina, G. Leofanti, G. Petrini, G. Tozzola and G. Vlaic, J. Catal., 1996, 158, 486 CrossRef CAS.
- E. M. Flanigen, J. M. Bennett, R. W. Grose, J. P. Cohen, R. L. Patton, R. M. Kirchner and J. Smith, Nature, 1978, 271, 512 CrossRef CAS.
- M. Wilke, F. Farges, P. Petit, G. E. Brown Jr. and F. Martin, Am. Mineral., 2001, 86, 714 CAS.
- A. Tuel, I. Arcon and J. M. M. Millet, J. Chem. Soc., Faraday Trans., 1998, 94, 3501 RSC.
- B. Echchahed, A. Moen, D. Nicholson and L. Bonneviot, Chem. Mater., 1997, 9, 1716 CrossRef CAS.
- X. Wang, Q. Zhang, S. Yang and Y. Wang, J. Phys. Chem. B, 2005, 109, 23500 CrossRef CAS.
- H. E. Swanson and E. Tafte, Natl. Bur. Stand. (U.S.) Circ., 1955, 539, 4 Search PubMed.
- A. E. Owen and D. Madoc Jones, Proc. Phys. Soc., 1954, 67, 459 Search PubMed.
- Powder Diffraction File No 44-1433.
- Powder Diffraction File No 6-696.
- R. B. Greegor and F. W. Lytle, J. Catal., 1980, 63, 476 CrossRef CAS.
- P. Ramesh, T. Okazaki, R. Taniguchi, J. Kimura, T. Sugai, K. Sato, Y. Ozeki and H. Shinohara, J. Phys. Chem. B, 2005, 109, 1141 CrossRef CAS.
- Y. Yang, Z. Hu, Y. N. Lu and Y. Chen, Mater. Chem. Phys., 2003, 82, 440 CrossRef CAS.
- B. J. Landi, C. D. Cress, C. M. Evans and R. P. Raffaelle, Chem. Mater., 2005, 17, 6819 CrossRef CAS.
Footnote |
| † Electronic supplementary information (ESI) available. See DOI: 10.1039/c2ra01147f |
| This journal is © The Royal Society of Chemistry 2012 |

