DOI:
10.1039/C2RA01139E
(Paper)
RSC Adv., 2012,
2, 6672-6679
Facile synthetic fabrication of iron oxide particles and novel hydrogen superoxide supercapacitors†
Received
20th November 2011
, Accepted 15th May 2012
First published on 27th June 2012
Abstract
A facile approach for the synthetic fabrication of iron oxide (Fe3O4) particles is presented and their potential application towards energy storage (as an electrode material within a supercapacitor) is explored. The Fe3O4 asymmetric supercapacitor is found to deliver a maximum specific capacitance of ∼120 F g−1 at a current density of 0.1 A g−1 in an aqueous electrolyte solution (3M KOH) retaining 93.70% of its initial capacity over 1000 cycles. Additionally, an iron based hydrogen superoxide [FeO(OH)] supercapacitor is readily fabricated and is found to exhibit a maximum specific capacitance of ∼400 F g−1 at a discharge current of 0.1 A g−1 in a 3M KOH solution.
Introduction
In response to the increasing energy needs of modern society and the emerging ecological concerns, it has become essential to find new, alternative and innovative energy storage systems, where it has become apparent that conventional technologies (batteries and electrolytic capacitors) are not capable of providing efficient solutions for new market applications.1,2 Supercapacitors (also called electrochemical capacitors or ultracapacitors), 3,4 are considered the most promising candidate and one of the newest innovations in electrical energy storage. These devices have gained significant interest of late,2,5 exhibiting desirable characteristics such as low equivalent series resistance (ESR), long charge/discharge life, and several orders of magnitude higher power density (able to store and deliver energy at relatively high rates, beyond those accessible by a typical battery),6,7 furthermore, the deficiencies of other power sources, for example fuel cells, could be complemented by the inclusion of supercapacitors.8
Depending on the fundamental mechanisms that preside over the capacitance, supercapacitors can be placed into one of two types: 1) Electrical double layer capacitors (EDLC), for which the capacitance arises from the accumulation of ionic charges at the electrode-electrolyte interface and a high surface area (carbon based material) is favourable;9–11 2) Redox capacitors, for which a reversible faradaic reaction of the electro-active species (like an actual battery) occurs leading to the pseudo-capacitance. Typically conducting polymers and metal oxides belong to the second kind of capacitance material. 12–14 Carbon, in its various forms, 3,15–22 has been extensively used as an electrode material within supercapacitors, with the intent of attaining high specific capacitance, together with high power densities. Bauer et al. investigated the electrochemical and capacitative properties of basal and edge planes, utilizing ordinary pyrolytic graphite, demonstrating capacitance values of 12 and 60 μF cm−2 for cleaving (basal) and polishing (edge), respectively.23 The capacitance contributed by the basal planes can be characterised as a space charge at its interface behaving like the ionic diffuse-layer capacitance shown in metal-electrolyte systems.7 Exposed edge plane-like defects display characteristic behaviour similar to that found at a metal/solution interface where the capacitance is determined by a combination of ionic/electronic Helmholtz compact-layer capacitance and ionic diffuse-layer capacitance, thus exhibiting a significantly larger capacitance.7 Therefore, the contribution from the ionic/electronic Helmholtz compact-layer towards the total capacitance is positively larger than that from the ionic diffuse-layer capacitance. This is attributed to the edge planes providing a larger number of adsorption sites and a larger surface charge. In contrast, the basal plane offers less adsorption sites and a decreased surface charge, generating smaller capacitance values.
While porous carbon materials exhibit a high specific surface area, their low conductivities limit their applications in high-power-density supercapacitors.24 Carbon nanotubes (CNTs), with excellent electrical conductivity, have been incorporated into supercapacitors for over a decade.15,20,24,25
However, CNT-based supercapacitors have been unable to realise their expected performance, likely due to the observed contact resistance between the electrode and current collector,22,26 resulting in many studies turning their attention to the morphology of carbon materials in order to boost capacitor performance.19,20,22,26–28 Recently, a significant amount of research has focused on hybrid supercapacitors because of their high working voltage and energy density.2 Thus far, the use of various transition metal oxides, such as RuO2, CoO and IrO2,29–31 as pseudo-capacitance electrode materials has been reported. However, application of these oxides has been hindered by their high cost. It is therefore essential to find a low-cost pseudo-capacitance material as the main focus in supercapacitor research. Inexpensive and innocuous, iron oxides demonstrate significant potential to undertake this challenge. Earlier studies using Fe3O4 as an electrode material have showed that it displays relatively low capacitance values, ranging between 60 and 80 F g−1,32,33 owed mainly to its low electrical conductivity, which does not enable effective ion diffusion.34 Blending Fe3O4 to form composites with conductive phases, e.g. carbon nanotubes, effectively increases the overall capacitance two fold.35
In this paper we report two new, facile methodologies towards the formation of carbon/iron oxide composite supercapacitors. Additionally, we present a method whereby iron oxide particles are synthesised in situ in the presence of carbon, producing capacitance values exceeding those of carbon oxygenated/oxidised modified electrodes or Fe3O4 carbon modified electrodes.
The assembly process of supercapacitors should be inexpensive and high-throughput, just like batteries. Supercapacitors can be made to be flexible using sheet-like structures, which are light-weight. Costly and expensive methods exist but are not appropriate for making millions of supercapacitors. State-of-the-art, flexible, thin-film supercapacitors, based on sprayed networks of single-walled carbon nanotubes (SWCNTs), have been constructed that display very high energy (6 Wh kg−1).36 These results demonstrate the underlying potential of printable thin film supercapacitors. Despite this scientific advance towards semi-printable/production supercapacitors, there have been limited reports using printing processes for fabricating flexible supercapacitors. To the best of our knowledge, there have been little or no reports of using true screen printing despite its inherent advantages.37,38
Innovative and unique electrochemical designs can be readily produced via screen printing by designing and producing screens which determine the geometry and thickness of the screen printed material, which is typically graphite but it can be applied to other novel materials.37 In this present paper, we utilize screen printing as a new methodology to fabricate flexible and reproducible supercapacitors with high surface areas and minimal wasted space with respect to geometric arrangement and in terms of multiple printing. The benefit of this methodology is that it can be readily scaled up, is economical and produces reproducible surface shapes and thicknesses; something which is currently lacking in this area. Ultimately, the result is a reduction of both the weight and the resistance of the printed electrodes via the elimination of the interface between the charge collectors and working electrodes, leading to higher power density.
Experimental section
All chemicals used were of analytical grade and were used as received without any further purification and were obtained from Sigma-Aldrich. All solutions were prepared with deionised water of resistivity not less than 18.2 MΩ cm.
Voltammetric measurements were carried out using a μ-AutolabIII (ECO-Chemie, The Netherlands) potentiostat. All measurements were conducted using a three electrode configuration comprising a screen printed carbon working electrode (9 mm diameter), a carbon counter and a Ag/AgCl reference electrode. The manufacture of the screen printed electrodes (SPEs) has been reported previously and they have been shown to exhibit a heterogeneous rate constant of ∼6.2 × 10⁻⁵ cm s−1 using the ferro/ferricyanide redox probe in 1M KCl.39 Connectors for the efficient connection of the screen printed substrate were purchased from Kanichi Research Services Ltd.40 Iron oxide particles were immobilised onto the screen printed electrode by dropping a 25 μl aliquot of the iron solution (1 mL 1000 ppm FeCl3/3 mL hydrogen peroxide), which was allowed to evaporate at room temperature, onto the electrode surface.
Scanning electron microscope (SEM) images and surface element analysis were obtained with a JEOL JSM-5600LV model. X-ray photoelectron spectroscopy (XPS, K-Alpha, Thermo Scientific) was used to analyze the filter surface. All spectra were collected using Al–K radiation (1486.6 eV), monochromatized by a twin crystal monochromator, yielding a focused X-ray spot with a diameter of 400 μm, at 3 mA × 12 kV. The alpha hemispherical analyser was operated in the constant energy mode with survey scan pass energies of 200 eV, to measure the whole energy band, and 50 eV in a narrow scan to selectively measure the particular elements. Thus, XPS was used to provide the chemical bonding state as well as the elemental composition of the filter surface. Charge compensation was achieved with the system flood gun that provides low energy electrons and low energy argon ions from a single source. Diamond ATR-FTIR analysis of the electrode surface was conducted using a Thermo Scientific Nicolet 380 FT-IR Spectrometer.
Results and discussion
Alkaline synthesis
It is widely accepted that Fe3O4, effectively ‘rust’, has an orthorhombic structure comprising of iron in two different oxidation states, Fe2+ and Fe3+, in a ratio of 1![[thin space (1/6-em)]](https://www.rsc.org/images/entities/char_2009.gif) :
:![[thin space (1/6-em)]](https://www.rsc.org/images/entities/char_2009.gif) 2, respectively, and it has been reported to produce relatively high specific capacitances ranging from 27 to 80 F g−1.32,33,41 Fe2O3 (α configuration, obtained commercially), on the other hand, has a very low specific capacitance, which we found to be ∼6 F g−1 in 3M KOH at a discharge current of 0.1 A g−1 (see ESI for more information†).
2, respectively, and it has been reported to produce relatively high specific capacitances ranging from 27 to 80 F g−1.32,33,41 Fe2O3 (α configuration, obtained commercially), on the other hand, has a very low specific capacitance, which we found to be ∼6 F g−1 in 3M KOH at a discharge current of 0.1 A g−1 (see ESI for more information†).
Our initial approach was the alkaline synthesis of iron oxide (Fe3O4) where both Fe2+ and Fe3+ are incorporated into the microcrystal structure. Ferric chloride, FeCl3 was dissolved into distilled water (1000 ppm, 1 mL) and mixed with sodium percarbonate (20–30% in hydrogen peroxide, 5 mL). Ferric ions (Fe2+ and Fe3+) were produced via the catalytic decomposition of hydrogen peroxide as described by the following scheme:
| | | 2Fe3+ + H2O2 ⇌ 2Fe2+ + 2 H+ + O2 | (1) |
| | | 2Fe2+ + H2O2 + 2H+ ⇌ 2H2O + 2Fe3+ | (2) |
The overall reaction of (1) and (2) can be summarised as:
Due to the strongly alkaline conditions created via the inclusion of sodium percarbonate, simultaneous precipitation of ferric and ferrous hydroxide, Fe(OH)2 and Fe(OH)3 respectively, took place as described viaeqn (3) and (4). Note that the KSP values for Fe(OH)2 and Fe(OH)3 are 1.8 × 10⁻¹⁵ and 6 × 10−38, respectively.42 The KSP values gives an indication to the order of reaction. To begin with, Fe3+ precipitate as Fe(OH)3, consequently changing the acidity of the solution. When the KSP value for Fe(OH)2 was satisfied, the remaining Fe3+, reduces to Fe2+ by the hydrogen peroxide, instantly formed the metal oxide.
The aqueous solution was then allowed to evaporate, permitting the formation of Fe3O4, in the presence of excess hydrogen peroxide (3 mL), as shown in eqn (5).
| |  | (5) |
The synthesised iron structures were suspended in ethanol and immobilised upon the working surface of the SPE. SEM imaging (Fig. 1) clearly depicts the structure of the Fe3O4 particles which, following immobilisation, exhibit unique rectangular features, typically 20 μm in size.
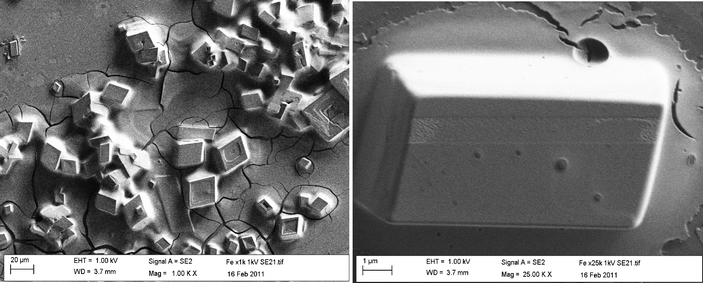 |
| | Fig. 1 Typical SEM images of the iron oxide (Fe3O4) particles immobilised upon the surface of a carbon screen printed electrode. | |
Acidic synthesis
The acidic synthesis of iron oxide is similar to the former synthesis. Hydrogen peroxide (30%, 5 mL) was added to ferric chloride, FeCl3, dissolved in distilled water (1000 ppm, 1 mL), which resulted in the catalytic decomposition of ferric ions as described by eqn (1). The hydrolysis of water, described below, led to the eventual formation of ferric hydroxide (eqn (6)):
| | | Fe3+ + 3 OH− ⇌ Fe(OH)3 (colloidal, yellow) | (6) |
As mentioned previously, Fe(OH)3 has a very low KSP value, typically 6 × 10−38.42 In strongly acidic conditions, typically at a pH value of 1, the concentration of hydroxide ions is 10−13 M and with a high concentration of ferric ions present, precipitation of ferric hydroxide occurs since [Fe3+][OH−]3 > KSP. Ferric chloride has a reported solubility of approximately 92 g/100 mL in water 43 resulting in the exclusive precipitation of Fe(OH)3 despite the high concentrations of chloride ions. Only an infinitesimal amount of iron was required prior to evaporation. The H+ ions formed hydrochloric acid (HCl) gas, consequentially reducing the acidity and thus increasing the concentration of hydroxyl ions, [OH−]. When the KSP prerequisite is satisfied, the precipitation of Fe(OH)3 ensued. Due to the limitation of available iron, a colloidal solution was readily formed. This solution, containing colloidal ferric hydroxide, was simply dried upon a hot plate and reacted further, following the addition of excess hydrogen peroxide (30%, 3 mL), according to the following mechanism:
| |  | (7) |
Aliquots of this solution were then dispersed on the surface of a screen printed electrode and allowed to dry at room temperature. Note that thermal decomposition, as described in eqn (8), was avoided since this requires elevated temperatures (∼ 300 °C), far higher than those employed here, confirming no undesirable degradation of Fe(OH)3 in our synthetic methodology, since Fe2O3 has a poor specific capacitance (as determined above).
| | | 2 Fe(OH)3 ⇌ Fe2O3 + 3 H2O | (8) |
As shown above (eqn (7)), the addition of excess hydrogen peroxide to the precipitated ferric hydroxide led to the formation of ferric hydroperoxide [FeO(OH)], and, as shown below, it is found to have a significantly higher capacitance compared to that of Fe2O3.
Characterisation of material
The surface electronic states and the chemical composition of the iron products were examined by XPS. The XPS analysis reveals the presence of Fe, C and O with the binding energies of the Fe2+ 2p3/2 and Fe3+ 2p3/2 states located at 711.7 and 713.9 eV, respectively (Fig. 2). This is in excellent agreement with the values illustrated in the literature,44 establishing substantial evidence towards a structural configuration of Fe3O4 and FeO(OH). The first is emphasized by the Fe 2p3/2 main peak including two satellite peaks on the higher binding-energy side, (718.8 and 733.1 eV) indicating the Fe ion is in a divalent state.45 The contributions at 725.6 and 727.6 eV are transition peaks due to Fe 2p1/2 and are associated to the main peaks of Fe 2p3/2 at 711.7 and 713.9 eV, respectively. The binding energy of the O 1s state at 530.6 eV is presumably coupled to Fe3O4,46 while the peaks at 532.1 eV and 534.4 eV are consistent with the binding energies previously attributed to the presence of R–O and O–H of FeO(OH) 47 and Fe(OH)3.45 Additionally, the binding energies of the C 1s states at 286.6 eV and 289.2 eV confirm the presence of C–O and C![[double bond, length as m-dash]](https://www.rsc.org/images/entities/char_e001.gif) O. To substantiate this, the difference IR spectrum were obtained by subtracting the spectrum for a standard carbon/graphite screen printed electrode from that of the hydrogen superoxide screen printed electrodes after treatment (see ESI†), to distinguish the new surface functional groups responsible for the observed capacitance values. New bands at 1006, 1267, 1394, 1562, and 2984 were observed within the IR spectrum. The bands at 1006 cm−1 and 1267 cm−1 were assigned to the stretching of C–O bonds typically associated with alcohols and carboxylic groups, respectively. The C
O. To substantiate this, the difference IR spectrum were obtained by subtracting the spectrum for a standard carbon/graphite screen printed electrode from that of the hydrogen superoxide screen printed electrodes after treatment (see ESI†), to distinguish the new surface functional groups responsible for the observed capacitance values. New bands at 1006, 1267, 1394, 1562, and 2984 were observed within the IR spectrum. The bands at 1006 cm−1 and 1267 cm−1 were assigned to the stretching of C–O bonds typically associated with alcohols and carboxylic groups, respectively. The C![[double bond, length as m-dash]](https://www.rsc.org/images/entities/char_e001.gif) O stretching of carboxylic functional groups is present at 1562 cm−1 while the vibrations from the bending of O–H bonds within carboxylic groups contributes to the band shown at 1394 cm−1. These two bands agree well with the binding energies found within the XPS spectra. Finally the broad, shallow band at 2984 cm−1 was assigned to the presence of O–H bonds from carboxylic groups. The large trailing shoulder, in partnership with this band, is compelling evidence that supports the presence of alcohols. Note that XRD was attempted, but due to the lack of crystallinity, no substantive information could be obtained.
O stretching of carboxylic functional groups is present at 1562 cm−1 while the vibrations from the bending of O–H bonds within carboxylic groups contributes to the band shown at 1394 cm−1. These two bands agree well with the binding energies found within the XPS spectra. Finally the broad, shallow band at 2984 cm−1 was assigned to the presence of O–H bonds from carboxylic groups. The large trailing shoulder, in partnership with this band, is compelling evidence that supports the presence of alcohols. Note that XRD was attempted, but due to the lack of crystallinity, no substantive information could be obtained.
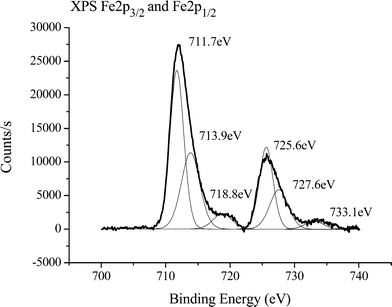 |
| | Fig. 2 XPS spectra of the iron oxide products. | |
Capacitance measurements
Supercapacitors are not dissimilar to batteries in their fabrication in that there are two electrodes immersed in an electrolyte, with an ion permeable separator situated amidst the electrodes. Double-layer capacitors exploit a combination of high surface-area with exceptionally small charge separation to generate their extremely high capacitance.48 In such a device, the interphase between an electrode and the adjacent electrolyte (which facilitates a build up of charge separated over a minute distance) constitutes a capacitor and therefore, a complete cell can be represented as two capacitors in series. Specific capacitance values reported in the literature are often derived from both cyclic voltammetry and galvanostatic charge-discharge methods using a three-electrode system that includes a reference and counter electrode.49
Firstly we examined the voltammetric performance of the Fe3O4 modified SPE hybrid supercapacitor (Fig. 3A) in a 3 electrode-cell, with a Fe3O4 modified carbon working and carbon counter electrode in a 3M KOH solution, between −1.0 and +1.0 V at a scan rate of 0.02 V s−1 (vs. Ag/AgCl). This was considered a suitable test to determine the mechanistic process of the reaction (faradaic and non-faradaic). Fig. 3A displays a predominantly rectangular shaped CV curve, strongly resembling the characteristics of an electrochemical double-layer, frequently observed for carbon based materials but also for faradaic pseudo-capacitance materials. The oxidation waves at ∼0.4 V, often associated with metal oxides, are likely attributed to the reaction mechanisms below:50
| | | Fe3O4 + 4 H+ ⇌ 2 Fe3+ + Fe2+ + 4 OH− | (9) |
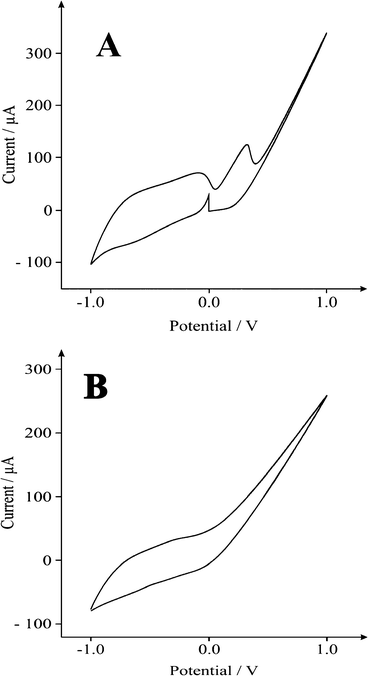 |
| | Fig. 3 Typical voltammetric signatures of (A) Fe3O4 and (B) FeO(OH) modified screen printed electrodes, recorded in a 3M KOH solution at a scan rate of 0.02 V s−1 (vs. Ag/AgCl). | |
A typical charge-discharge plot for the Fe3O4 supercapacitor is depicted in Fig. 4. The hybrid supercapacitor exhibits good electrochemical capacitance performance, demonstrated by a linear variation of the voltage during the charging-discharging process as observed in Fig. 4. The specific capacitance of the supercapacitor can be determined from the charge/discharge test, using with the following equation:2
| |  | (11) |
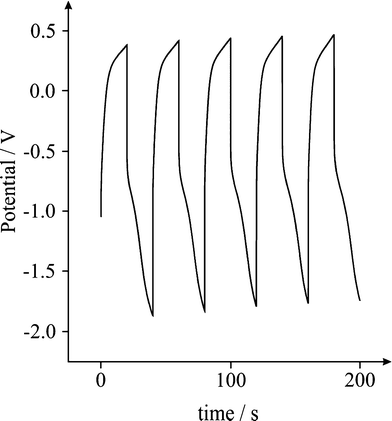 |
| | Fig. 4 Typical galvanostatic charge-discharge of a Fe3O4 modified screen printed electrode; 5 cycles over 200 s in a 3M KOH solution at 0.1 Ag−1. | |
Where Cm is the specific capacitance of the capacitor (F g−1), I is the current of the charge-discharge, Δt is the discharging time period in seconds for the potential ΔV, in volts and m is the mass load of the active materials (including the positive and negative electrode). The specific capacitance of the Fe3O4 supercapacitor was calculated to be ∼120 F g−1 at a discharge current of 0.1 A g−1. Note that this is a significant improvement over previously recorded values for Fe3O4 based supercapacitors,41 and easily comparable to the capacitance achieved by Fe3O4 composite (MWCNT) supercapacitors,51 which typically exhibit values of 27 and 165 F g−1, respectively. Reliability of the capacitance measurements was investigated through the deposition of increasing quantities of active material on the surface of the screen printed electrode, and a direct correlation between the mass and capacitance was observed (Fig. 5). The cyclic performance of the hybrid supercapacitor is impressive, retaining 93.70% of its initial capacity over 1000 cycles, as shown in Fig. 6, indicating the stability and suitability of the Fe3O4 particles for high-performance supercapacitor applications.
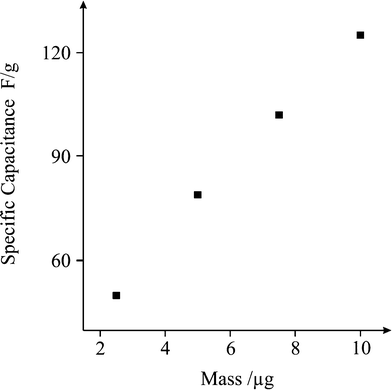 |
| | Fig. 5 Plot of mass deposited (Fe3O4) vs. specific capacitance. | |
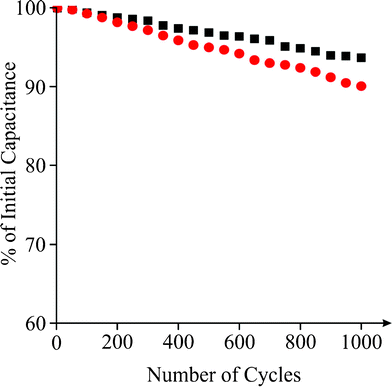 |
| | Fig. 6 A plot showing the number of charge-discharge cycles vs. % of initial capacitance for a Fe3O4 modified SPE (square) and the hydrogen superoxide SPE (circle) over 1000 cycles in 3M KOH. | |
It has been reported that oxygenated surface groups, commonly found on carbon materials, increase the electrical capacitance of the material,52 such as from a value of 80 to ∼130 F g−1 following introduction of C–O species.53 Frequently used techniques exploit oxidising agents, such as nitric acid 54 and oxygen plasma,54 to increase the number of oxygenated groups present at the surface of carbon-based materials. In our work we present a new facile methodology for the introduction of oxygenated surface groups on carbon-based materials.
Hydrogen superoxides
As was formerly discussed, ferric chloride, FeCl3 was dissolved in distilled water (1000 ppm, 1 mL) with the addition of hydrogen peroxide (30%, 5 mL). The ferric ions catalyse the hydrogen peroxide reaction, forming a range of peroxide radicals in situ via Fenton's reagent:55| | | Fe3+ + H2O2 → Fe2+ + OOH· + H+ | (12) |
| | | Fe2+ + H2O2 → Fe3+ + OH· + OH−. | (13) |
When this solution is dispersed on the surface of the working electrode, the radicals formed attack the accessible carbon material along the surface of the SPE (Fig. 7), increasing the percentage of oxygenated species present. Such radicals are very powerful and are even capable of initiating the hydroxylation of arenes (e.g. benzene to phenol).56 It is evident from SEM imaging (Fig. 7 and 8) that the iron particles in this case are much smaller than those examined previously. Energy dispersive X-ray spectroscopy (EDAX) analysis of the working surface shows a significant increase in oxygen content subsequent to treatment. Many different parameters (such as temperature or carbon content) can affect the number of oxygenated surface groups present, and in turn the capacitance, and as this is so, we recommend further investigation into these factors. The iron is likely to be in the form of Fe3O4 as described by the equations and characterisation presented earlier.
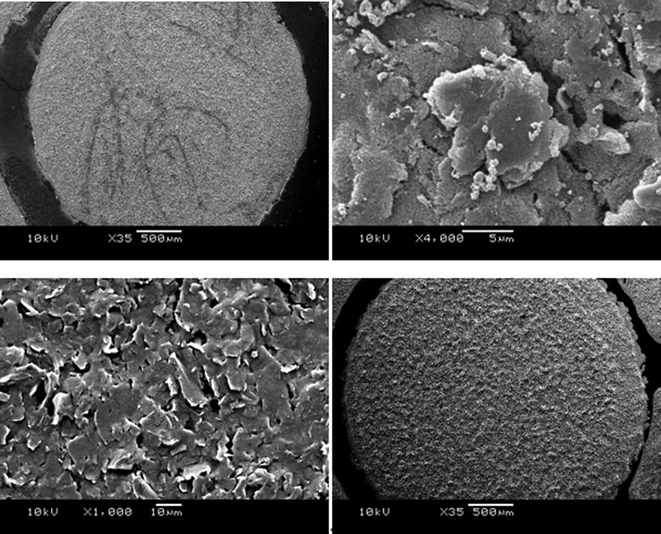 |
| | Fig. 7 SEM images of the FeO(OH) SPE (above) and standard SPE (below). | |
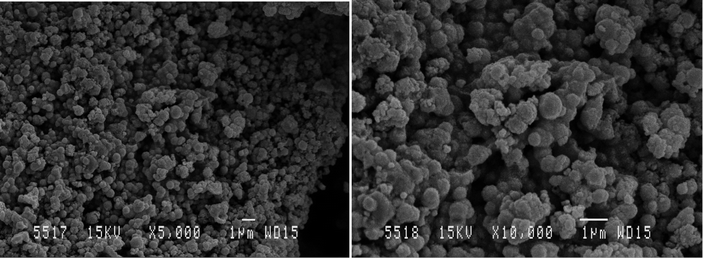 |
| | Fig. 8 SEM images of the iron oxide nanoparticles formed during the treatment of the FeO(OH) electrodes. | |
Finally, we explored and compared the performance of the fabricated FeO(OH) supercapacitor in a 3M KOH solution, as mentioned previously. Interestingly, no significant redox coupling is observed in the voltammetric profile (Fig. 3B). From eqn (11), galvanostatic charge-discharge was used to directly evaluate the applicability of the hydrogen superoxide based supercapacitor (Fig. 9) revealing a specific capacitance of ∼400 F g−1 at a discharge current of 0.1 A g−1. This may be attributed to the number of surface defects and the number of sites accessible to attack by the radical oxides. Stability is comparable with that of the Fe3O4 supercapacitor, showing a ∼10% decrease in capacitance over 1000 cycles (see above). It was found that the FeO(OH) electrode displayed superior specific capacitance to that of both pure graphene (69.2 F g−1) 57 and CNTs (58 F g−1).51 Our observed 400 F g−1 compares well with the 480 F g−1 observed for Fe3O4 nanoparticles attached to graphene oxide sheets,34 while vastly out performing capacitance values measured for Fe3O4 (27 F g−1),41 AC/Fe3O4 (37.9 F g−1)2 and Fe3O4/MWCNT (165 F g−1)51 electrodes. The specific energy density (E) and power density (P) are evaluated according to the following equations:58
| |  | (14) |
where I is the current, m is the mass of the active material, t is the discharge time and the integral  is obtained from the area under the galvanostatic discharge curve. The energy densities of the Fe3O4 and FeO(OH) electrodes reached 0.08 and 0.62 Wh Kg−1 at power densities of 16.06 and 125.60 W Kg−1, respectively.
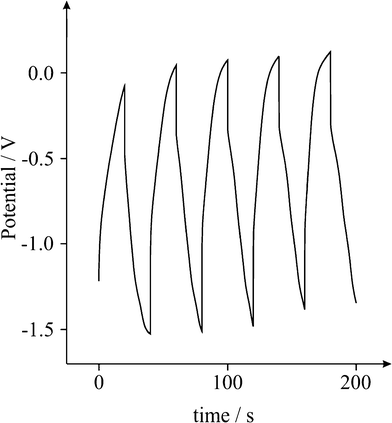 |
| | Fig. 9 Galvanostatic charge–discharge of the FeO(OH) based screen printed electrode; 5 cycles over 200 s in a 3M KOH solution at 0.1 Ag−1. | |
Conclusions
We have reported a facile approach towards the fabrication of iron oxide particles and their electrochemical performance towards energy storage. The Fe3O4 asymmetric supercapacitor delivered a maximum specific capacitance of ∼120 F g−1, retaining 93.70% of its initial capacity over 1000 scans. In comparison, the FeO(OH) based supercapacitor showed a maximum specific capacitance of ∼400 F g−1. These micromaterials show great promise and should be considered when designing electrochemical devices such as energy storage/generation devices. Future work involves the scale-up and incorporation of these methodologies into the fabrication of screen printed electrodes and would explore the application of different metal catalysts towards the formation of –OOH groups at the surface of carbon based electrodes.
Acknowledgements
M. Gómez-Mingot is grateful to the University of Alicante for her Fellowship and to Ph.D. Fernando Coloma from the Scientific Instrumentation Area of the University of Alicante for their quality work and guidance.
References
- A. S. Arico, P. Bruce, B. Scrosati, J. M. Tarascon and S. W. Van, Nat. Mater., 2005, 4, 366 CrossRef CAS.
- X. Du, C. Wang, M. Chen, Y. Jiao and J. Wang, J. Phys. Chem. C, 2009, 113, 2643 CAS.
- A. G. Pandolfo and A. F. Hollenkamp, J. Power Sources, 2006, 157, 11 CrossRef CAS.
- M. Winter and R. Brodd, Chem. Rev., 2004, 104, 4245 CrossRef CAS.
- Y. Wang, Z. Shi, Y. Huang, Y. Ma, C. Wang, M. Chen and Y. Chen, J. Phys. Chem. C, 2009, 113, 13103 CAS.
- A. Burke, J. Power Sources, 2000, 91, 37 CrossRef CAS.
-
B. E. Conway, Electrochemical supercapacitor and technological applications: Kluwer-Plenum Press, New York, 1999 Search PubMed.
- P. Simon and Y. Gogotsi, Nat. Mater., 2008, 7, 845 CrossRef CAS.
- H. Nagawa, A. Shudo and K. Miura, J. Electrochem. Soc., 2000, 147, 38 CrossRef.
- S. T. Mayer, R. W. Pekala and J. L. Kaschmitter, J. Electrochem. Soc., 1993, 140, 446 CrossRef CAS.
- A. Yoshida, S. Nonaka, I. Aoki and A. Nishino, J. Power Sources, 1996, 60, 207 CrossRef.
- W. Li, J. Chen, J. Zhao, J. Zhang and J. Zhu, Mater. Lett., 2005, 59, 800 CrossRef CAS.
- Y. Takasu and Y. Murakami, Electrochim. Acta, 2000, 45, 4135 CrossRef CAS.
- C. C. Hu and Y. H. Huang, Electrochim. Acta, 2001, 46, 3431 CrossRef CAS.
- L. Diederich, E. Barborini, P. Piseri, A. Podesta and P. Milnai, Appl. Phys. Lett., 1999, 75, 2662 CrossRef CAS.
- S. Lipka, IEEE Aerosp. Electron. Syst. Mag., 1997, 12, 27 CrossRef.
- D. N. Futaba, K. Hata, T. Yamanda, T. Hiraoka, Y. Hayamizu, Y. Kakudate, O. Tanaike, H. Hatori, M. Yumura and S. Iiyima, Nat. Mater., 2006, 5, 987 CrossRef CAS.
- S. Talapatra, S. Kar, S. K. Pal, R. Vajtai, L. Ci, P. Victor, M. M. Shaijumon, S. Kaur, O. Nalamasu and P. M. Ajayan, Nat. Nanotechnol., 2006, 1, 112 CrossRef CAS.
- G. Lota, T. A. Centeno, E. Frackowiak and F. Stoecki, Electrochim. Acta, 2008, 53, 2210 CrossRef CAS.
- K. H. An, W. S. Kim, Y. S. Park, J.–M. Moon, D. J. Bae, S. C. Lim, Y. S. Lee and Y. H. Lee, Adv. Funct. Mater., 2001, 11, 387 CrossRef CAS.
- D. Y. Qu, J. Power Sources, 2002, 109, 403 CrossRef CAS.
- M. M. Shaijumon, F. S. Ou, L. J. Ci and P. M. Ajayan, Chem. Commun., 2008, 2373 RSC.
- H. H. Bauer, M. S. Spritzer and P. J. Elving, J. Electroanal. Chem., 1968, 17, 299 CrossRef CAS.
- C. G. Liu, M. Liu, F. Li and H. M. Cheng, Appl. Phys. Lett., 2008, 92, 143108 CrossRef.
- C. M. Niu, E. Sichel, R. Hoch, D. Moy and H. Tennent, Appl. Phys. Lett., 1997, 70, 1480 CrossRef CAS.
- D. Hulicova, J. Yamashita, Y. Sonede, H. Hatori and M. Kodama, Chem. Mater., 2005, 17, 1241 CrossRef CAS.
- C. M. Yang, Y. J. Kim, M. Endo, H. Kanoh, M. Yudasaka, S. Iijima and K. Kaneko, J. Am. Chem. Soc., 2007, 129, 20 CrossRef CAS.
- E. Raymundo-Pinero, F. Leroux and F. Beguin, Adv. Mater., 2006, 18, 1877 CrossRef CAS.
- J. P. Zeng and T. R. Jow, J. Electrochem. Soc., 1995, 142, 6 CrossRef.
- A. A. F. Groupioni and T. A. F. Lassali, J. Electrochem. Soc., 2001, 148, 1015 CrossRef.
- J. M. Skowronski and K. Jurewiez, J. Power Sources, 1993, 45, 263 CrossRef.
- T. Cottineau, M. Toupin, T. Delahaye, T. Brousse and D. Belanger, Appl. Phys. A: Mater. Sci. Process., 2006, 82, 599 CrossRef CAS.
- X. Du, C. Y. Wang, M. M. Chen, Y. Jiao and J. Wang, J. Phys. Chem. C, 2009, 113, 2643 CAS.
- W. Shi, J. Zhu, D. H. Sim, Y. Y. Tay, Z. Lu, X. Zhang, Y. Sharma, M. Srinivasan, H. Zhang, H. H. Hng and Q. Yan, J. Mater. Chem., 2011, 21, 3422 RSC.
- Y.-H. Kim and S.-J. Park, Curr. Appl. Phys., 2011, 11, 462 CrossRef.
- M. Kaempgen, C. K. Chan, J. Ma, Y. Cui and G. Gruner, Nano Lett., 2009, 9(5), 1872 CrossRef CAS.
- J. P. Metters, R. O. Kadara and C. E. Banks, Analyst, 2011, 136(6), 1067 RSC.
- Y. Zhang, X. Sun, L. Pan, H. Li, Z. Sun, C. Sun and B. K. Tay, J. Alloys Compd., 2009, 480(2), L17–19 CrossRef CAS.
- R. O. Kadara, N. Jenkinson and C. E. Banks, Sens. Actuators, B, 2009, 138, 556 CrossRef.
-
http://kanichi-research.com; accessed Jan 2011; accessed Jan 2011.
- N. L. Wu, S. Y. Wang, C. Y. Han, D. S. Wu and L. R. Shiue, J. Power Sources, 2003, 113, 173 CrossRef CAS.
-
J. Bassett, R. C. Denny, G. H. Jeffery and J. Mendam, Vogel's Textbook of quantitative inorganic analysis (4th edn), 1980 Search PubMed.
-
P. Patnaik, Handbook of inorganic chemicals. McGraw-Hill, 2002, p. ISBN 0070494398X Search PubMed.
- A. P. Grosvenor, B. A. Kobe, M. C. Biesinger and N. S. Mclntyre, Surf. Interface Anal., 2004, 36, 1564 CrossRef CAS.
- S. Tang, S. Vongehr, Y. Wang, L. Chen and X. Meng, J. Solid State Chem., 2010, 183, 2166 CrossRef CAS.
- D. Brion, Appl. Surf. Sci., 1980, 5, 133 CrossRef CAS.
- T. L. Barr, J. Phys. Chem. A, 1978, 82, 1801 CAS.
- A. K. Shukla, S. Sampath and K. Vijamohanan, Curr. Sci., 2000, 79, 1656 CAS.
- D. Qu and H. Shi, J. Power Sources, 1998, 74, 99 CrossRef CAS.
- P. Kanatharana and M. S. Spritzer, Anal. Chem., 1974, 46(7), 958 CrossRef CAS.
- Y.-H. Kim and S.-J. Park, Curr. Appl. Phys., 2011, 11, 462 CrossRef.
- Y.-R. Nian and H. Teng, Fuel Chem. Division., 2002, 47, 429 CAS.
- E. Frackowiak, S. Delpeux, K. Jurewicz, K. Szostak, D. Cazorla-Amoros and F. Beguin, Chem. Phys. Lett., 2002, 361, 35 CrossRef CAS.
- A. M. Yacynych and T. Kuwana, Anal. Chem., 1978, 50, 640 CrossRef CAS.
- F. Haber and J. Weiss, Naturwissenschaften, 1932, 20, 948 CrossRef CAS.
- G. I. Panov, A. K. Uriarte, M. A. Rodkin and V. I. Sobolev, Catal. Today, 1998, 41, 365 CrossRef CAS.
- J. Yan, Carbon, 2010, 48, 1731 CrossRef CAS.
- Y. Cao and T. E. Mallouk, Chem. Mater., 2008, 20, 5260 CrossRef CAS.
Footnotes |
| † Electronic supplementary information (ESI) available. See DOI: 10.1039/c2ra01139e |
| ‡ Current Address: Physical Chemistry Department and Institute of Electrochemistry, University of Alicante, 03690, San Vicente del Raspeig, Alicante, Spain. |
|
| This journal is © The Royal Society of Chemistry 2012 |
Click here to see how this site uses Cookies. View our privacy policy here. ![[thin space (1/6-em)]](https://www.rsc.org/images/entities/char_2009.gif) :
:![[thin space (1/6-em)]](https://www.rsc.org/images/entities/char_2009.gif) 2, respectively, and it has been reported to produce relatively high specific capacitances ranging from 27 to 80 F g−1.32,33,41 Fe2O3 (α configuration, obtained commercially), on the other hand, has a very low specific capacitance, which we found to be ∼6 F g−1 in 3M KOH at a discharge current of 0.1 A g−1 (see ESI for more information†).
2, respectively, and it has been reported to produce relatively high specific capacitances ranging from 27 to 80 F g−1.32,33,41 Fe2O3 (α configuration, obtained commercially), on the other hand, has a very low specific capacitance, which we found to be ∼6 F g−1 in 3M KOH at a discharge current of 0.1 A g−1 (see ESI for more information†).


![[double bond, length as m-dash]](https://www.rsc.org/images/entities/char_e001.gif) O. To substantiate this, the difference IR spectrum were obtained by subtracting the spectrum for a standard carbon/graphite screen printed electrode from that of the hydrogen superoxide screen printed electrodes after treatment (see ESI†), to distinguish the new surface functional groups responsible for the observed capacitance values. New bands at 1006, 1267, 1394, 1562, and 2984 were observed within the IR spectrum. The bands at 1006 cm−1 and 1267 cm−1 were assigned to the stretching of C–O bonds typically associated with alcohols and carboxylic groups, respectively. The C
O. To substantiate this, the difference IR spectrum were obtained by subtracting the spectrum for a standard carbon/graphite screen printed electrode from that of the hydrogen superoxide screen printed electrodes after treatment (see ESI†), to distinguish the new surface functional groups responsible for the observed capacitance values. New bands at 1006, 1267, 1394, 1562, and 2984 were observed within the IR spectrum. The bands at 1006 cm−1 and 1267 cm−1 were assigned to the stretching of C–O bonds typically associated with alcohols and carboxylic groups, respectively. The C![[double bond, length as m-dash]](https://www.rsc.org/images/entities/char_e001.gif) O stretching of carboxylic functional groups is present at 1562 cm−1 while the vibrations from the bending of O–H bonds within carboxylic groups contributes to the band shown at 1394 cm−1. These two bands agree well with the binding energies found within the XPS spectra. Finally the broad, shallow band at 2984 cm−1 was assigned to the presence of O–H bonds from carboxylic groups. The large trailing shoulder, in partnership with this band, is compelling evidence that supports the presence of alcohols. Note that XRD was attempted, but due to the lack of crystallinity, no substantive information could be obtained.
O stretching of carboxylic functional groups is present at 1562 cm−1 while the vibrations from the bending of O–H bonds within carboxylic groups contributes to the band shown at 1394 cm−1. These two bands agree well with the binding energies found within the XPS spectra. Finally the broad, shallow band at 2984 cm−1 was assigned to the presence of O–H bonds from carboxylic groups. The large trailing shoulder, in partnership with this band, is compelling evidence that supports the presence of alcohols. Note that XRD was attempted, but due to the lack of crystallinity, no substantive information could be obtained.


 is obtained from the area under the galvanostatic discharge curve. The energy densities of the Fe3O4 and FeO(OH) electrodes reached 0.08 and 0.62 Wh Kg−1 at power densities of 16.06 and 125.60 W Kg−1, respectively.

