H2Ti6O13, a new protonated titanate prepared by Li+/H+ ion exchange: synthesis, crystal structure and electrochemical Li insertion properties†
J. C.
Pérez-Flores
*a,
C.
Baehtz
b,
M.
Hoelzel
c,
A.
Kuhn
a and
F.
García-Alvarado
a
aUniversidad San Pablo CEU, Departamento de Química, Urb. Montepríncipe, Boadilla del Monte, E-28668, Madrid, Spain. E-mail: jcaperez@ceu.es; Fax: 34 913510496; Tel: 34 91 3724715
bInstitute of Ion Beam Physics and Materials Research, Helmholtz-Zentrum Dresden-Rossendorf, D-01314 Dresden, Germany
cFRM II, Technische Universität München, Garching, E-85747-, München, Germany
First published on 2nd March 2012
Abstract
The hexatitanate H2Ti6O13 is obtained by a simple successive Na+/Li+/H+ ion exchange of Na2Ti6O13. The crystal structure of H2Ti6O13 was solved from both synchrotron and neutron powder diffraction. H2Ti6O13 crystallizes in the monoclinic space group C2/m, with a = 14.6702(3) Å; b = 3.7447(1) Å; c = 9.2594(2) Å; β = 96.941(2)°. The monoclinic symmetry of the [Ti6O13]2− framework is preserved during the exchange reaction. When compared to the positions of Na and Li in Na2Ti6O13 and Li2Ti6O13, the position of the proton is shifted towards the O3 atomic position, where it forms a covalent O–H bond. The vicinity of the proton to the O5 atom across the tunnel allows for the formation of a classical (asymmetric) hydrogen bond. H2Ti6O13 has been tested as a Li insertion material to assess its use as an electrode in lithium rechargeable batteries. It reacted irreversibly with ca. 6 Li ions per formula unit at an average voltage of 1.5 V vs. Li+/Li, with a specific discharge capacity of 315 mA h g−1. However, after first discharge, a reversible specific capacity of 170 mA h g−1 was developed. H2Ti6O13 then yielded a higher reversible specific capacity than Na2Ti6O13 and comparable to Li2Ti6O13. Besides structural details, IR spectroscopy has been used to further assess possible reaction mechanisms pointing to the transformation of H2Ti6O13 to Li2Ti6O13 when reacting with the very first two lithium ions.
1. Introduction
A great deal of papers devoted to the investigation of lithium titanates have been published in recent years. Several of these titanates have shown only very slight structural effects, such as volume change, upon lithium insertion/deinsertion cycles. This so called zero strain behaviour was early reported for Li2Ti3O7,1 Li4Ti5O12,2 and ramsdellite–TiO23–7 for instance, in which the Ti(IV)/Ti(III) redox couple is observed at ca. 1.45 V. Even though this redox potential is far higher than that of graphite or carbonaceous materials, the good cyclability of Li cells bearing zero-strain lithium titanates as the negative electrode has favoured its commercialisation.We have recently reported the synthesis, characterisation and electrochemical lithium insertion properties of Li2Ti6O13, which was readily prepared by the Na+/Li+ ion exchange of Na2Ti6O13.8 Interestingly, attempts to insert lithium into Li2Ti6O13 produce an irreversible phase transformation to a highly lithiathed material that afterwards reacts reversibly with lithium. On the contrary, Na2Ti6O13 shows truly reversible Li insertion behaviour through several solid solutions and two phase regions.9,10 A later report by Kataoka et al.11 also presented the different behaviour for the Na and the Li-derivatives. In the latter report differences in structural stability of the lithium inserted materials are pointed to as the origin of the difference in electrochemical behaviour.
Ion exchange reactions are very convenient for preparing new electrode materials as for example in the case of Nax(Mn1![[thin space (1/6-em)]](https://www.rsc.org/images/entities/char_2009.gif) −
−![[thin space (1/6-em)]](https://www.rsc.org/images/entities/char_2009.gif) yCoy)O212–15 and others.16–18 Therefore, when thinking of sodium titanates as insertion electrodes and their electrochemical performances, the ion exchange of Na+ by Li+ or H+ is very interesting. Note that substitution of the heavier sodium by the lighter lithium or even by protons produces a decrease in the molecular weight and hence a higher specific capacity is expected, provided that the same quantity of guest ions is inserted. In the case of the layered sodium trititanate Na2Ti3O7, consecutive Na+/Li+/H+ ion exchange has been shown17–19 to increase the reversible specific capacity. The protonated trititanate, H2Ti3O7, has been reported to transform to H2Ti12O25 and finally to TiO2 by dehydration20–22 through several not fully characterised intermediates, in which H2Ti6O13 was postulated as one of the intermediate phases.
yCoy)O212–15 and others.16–18 Therefore, when thinking of sodium titanates as insertion electrodes and their electrochemical performances, the ion exchange of Na+ by Li+ or H+ is very interesting. Note that substitution of the heavier sodium by the lighter lithium or even by protons produces a decrease in the molecular weight and hence a higher specific capacity is expected, provided that the same quantity of guest ions is inserted. In the case of the layered sodium trititanate Na2Ti3O7, consecutive Na+/Li+/H+ ion exchange has been shown17–19 to increase the reversible specific capacity. The protonated trititanate, H2Ti3O7, has been reported to transform to H2Ti12O25 and finally to TiO2 by dehydration20–22 through several not fully characterised intermediates, in which H2Ti6O13 was postulated as one of the intermediate phases.
Very recently, the existence of the hitherto unknown protonated hexatitanate H2Ti6O13 has been proved,23,24 though this interesting material was only partially characterised. We report here for the first time, the precise determination of the crystal structure by Rietveld analysis of synchrotron and neutron powder diffraction data combined with IR spectroscopy allowing us to shed light on the electrochemical properties. Furthermore, the electrochemical lithium insertion properties of H2Ti6O13 are evaluated in view of its possible use as an electrode for rechargeable Li batteries, and compared to those of the parent Li2Ti6O13.
2. Experimental
2.1 Synthesis and chemical lithiation
H2Ti6O13 was prepared by Li+/H+ ion exchange on Li2Ti6O13 at mild temperatures using benzoic acid (Aldrich, ≥99.5%). A 100% excess of benzoic acid with respect to the stoichiometric quantity was mixed with Li2Ti6O13 and pressed into pellets. The pellets were heated at 125 °C in air for 72 h. The resulting product was crushed, washed with distilled hot water and the remaining white solid, nominally H2Ti6O13, was filtered through 2 μm pore-size filter paper. Ethanol (Scharlau, ρ = 0.789 g mL−1) and acetone (Scharlau, ρ = 0.791 g mL−1) were used consecutively to dry the powder followed by a final drying treatment at 60 °C.Chemical lithiation of H2Ti6O13 was done with n-butyl lithium 1.6 M in hexane (Aldrich, ρ = 0.68 g mL−1). For this, 1![[thin space (1/6-em)]](https://www.rsc.org/images/entities/char_2009.gif) :
:![[thin space (1/6-em)]](https://www.rsc.org/images/entities/char_2009.gif) 1 and 1
1 and 1![[thin space (1/6-em)]](https://www.rsc.org/images/entities/char_2009.gif) :
:![[thin space (1/6-em)]](https://www.rsc.org/images/entities/char_2009.gif) 2 stoichiometric ratios were used to obtain two lithiated compounds, nominally “LiH2Ti6O13” and “Li2H2Ti6O13”.
2 stoichiometric ratios were used to obtain two lithiated compounds, nominally “LiH2Ti6O13” and “Li2H2Ti6O13”.
2.2 Chemical and structural analysis
The exchange rate was investigated using an Inductive Coupling Plasma Emission Spectrometer (ICP-OES). Analysis of both the filtered solution and the acid digested solid were carried out with a Perkin Elmer 3300 apparatus.Preliminary structural characterisation was made by means of powder X-ray diffraction (PXRD) in the angular range 2θ = 10–100°. Diffraction patterns were recorded on a Bruker D8 high-resolution diffractometer, using monochromatic CuKα1 (λ = 1.5406 Å) radiation obtained with a germanium primary monochromator, and equipped with a solid-state rapid LynxEye. The angular range, step size and counting times were selected to ensure the required data quality and resolution for the structural refinement. A deeper structural characterisation was made using neutron powder diffraction (NPD); patterns were collected on the high resolution diffractometer SPODI at the neutron source Heinz Maier-Leibnitz (FRM II, Garching, Munich, Germany) using a Ge(551) monochromator with a wavelength of λ = 1.5481 Å over an angular range 2θ = 10–138°. Additionally, synchrotron diffraction data was obtained from experiments carried out at beamline BM20 of the Helmholtz-Zentrum Dresden-Rossendorf at ESRF (Grenoble, France) in the angular range 2θ = 2–36°, using a spinning flat sample holder. A wavelength of λ = 0.495937 Å was selected by means of a double-crystal Si(111) monochromator. The diffraction patterns were analysed and crystal structures determined by Rietveld25,26 analysis with the FullProf software.27 Structural models have been drawn using the Vesta 2.90 software.28 Besides, crystal symmetry was studied by means of Selected Area Electron Diffraction (SAED) using a JEOL 2000FX electron microscope.
IR spectroscopic data were collected on a Fourier Transform Infrared (FTIR) Perkin Elmer 599 in the range of 4000 to 500 cm−1 and a resolution of 4 cm−1. Samples were prepared using a suspension of the compound (0.5 mg) in 2 drops of Nujol mineral oil (Aldrich, ρ = 0.84 g mL−1). This suspension was spread between two NaCl windows.
2.3 Electrochemical characterisation
Lithium insertion/deinsertion investigations were performed electrochemically. For this purpose lithium coin cells (CR2032 type) were assembled, accordingly to the following general configuration:| (−) Li // LiPF6 in EC + DMC // H2Ti6O13 + C + Kynarflex (+) |
For comparative purposes similar cells bearing the lithium analog, Li2Ti6O13, were also assembled and investigated.
A lithium metal disk (5 mm diameter) was used as the negative electrode. The composite positive electrode was made by mixing 60% A2Ti6O13 (A = Li or H) as active material, 35% carbon black (Cabot Corp.) and 5% Kynarflex as the binder (Elf Atochem) in weight. The resulting mixture was pressed to 8 mm diameter pellets containing ca. 10–13 mg active material. A solution of 1 M LiPF6 in a 50![[thin space (1/6-em)]](https://www.rsc.org/images/entities/char_2009.gif) :
:![[thin space (1/6-em)]](https://www.rsc.org/images/entities/char_2009.gif) 50 mixture of ethylene carbonate (EC) and dimethyl carbonate (DMC) by volume was used as the electrolyte (Selectipur LP30, Merck). The cells were assembled in an argon-filled glove box and run and controlled by using a multichannel MacPile II system (BioLogic). Galvanostatic experiments were carried out under different C/n rates, where n reflects the time needed (in hours) to insert 1 lithium per formula weight of titanate. Experiments close to equilibrium were carried out using either the potentiostatic (PITT) or galvanostatic (GITT) intermittent titration technique at constant temperature (25 °C). In galvanostatic mode current density pulses of 0.1 mA cm−2 were applied for 30 min. After each current pulse was switched off the system was allowed to relax for 12 h in order to reach equilibrium before applying the next pulse. The potentiostatic experiments under quasi-equilibrium conditions were carried out by changing the potential step in intervals of ±10 mV every 12 h.
50 mixture of ethylene carbonate (EC) and dimethyl carbonate (DMC) by volume was used as the electrolyte (Selectipur LP30, Merck). The cells were assembled in an argon-filled glove box and run and controlled by using a multichannel MacPile II system (BioLogic). Galvanostatic experiments were carried out under different C/n rates, where n reflects the time needed (in hours) to insert 1 lithium per formula weight of titanate. Experiments close to equilibrium were carried out using either the potentiostatic (PITT) or galvanostatic (GITT) intermittent titration technique at constant temperature (25 °C). In galvanostatic mode current density pulses of 0.1 mA cm−2 were applied for 30 min. After each current pulse was switched off the system was allowed to relax for 12 h in order to reach equilibrium before applying the next pulse. The potentiostatic experiments under quasi-equilibrium conditions were carried out by changing the potential step in intervals of ±10 mV every 12 h.
3. Results and discussion
3.1 Synthesis
Initial attempts to prepare H2Ti6O13 by ion exchange reaction were made on Na2Ti6O13 as the parent compound. However, no significant Na+/H+ exchange was detected with the exchange agents used (aqueous HNO3 or molten C6H5COOH at 125 °C); this result is in agreement with previous reports.29However, proton exchange takes places when the reaction is carried out on Li2Ti6O13,8 using C6H5COOH as the exchange agent under the experimental conditions described in the experimental section. Indeed, the chemical analysis of Li+ in the filtrate solution confirmed that the ion exchange of Li+ by H+ was quantitative in as much as the determined lithium quantity is coincident with that expected for total exchange. According to this finding, lithium was not detected in the solution after acid digestion of the solid product. Therefore, we assume the formation of H2Ti6O13 as the result of the exchange reaction of Li2Ti6O13 with benzoic acid. The structure of the new hexatitanate is presented in the next section.
3.2 Structural characterisation
The result of preliminary X-ray characterisation of H2Ti6O13 by PXRD can be found in Table 1 and Fig. 1 of the ESI† whereas the synchrotron diffraction patterns of Li2Ti6O13 and ion exchanged H2Ti6O13 are depicted in Fig. 1. Furthermore, the refined lattice parameters of Li2Ti6O13 and the exchanged derivative H2Ti6O13, both crystallizing in the monoclinic system with space group C2/m, are listed in Table 1. More details on the refinement results have been included in Tables 2 and 3 of the ESI†. In general terms, the diffraction patterns of both titanates are quite similar, suggesting that the skeleton structure is retained during the acidic exchange reaction. A more detailed study of the synchrotron patterns reveals that the (200) and (020) diffraction peaks are shifted to higher 2θ angles (Fig. 1) in H2Ti6O13 if compared to those of Li2Ti6O13. This observation is consistent with the shrinking of the a axis, and to a lesser extent of the b axis, in H2Ti6O13 (see Table 1). Moreover, the (003) reflection is shifted towards lower 2θ angles with respect to Li2Ti6O13, in agreement with the observed increase of the c axis upon ion exchange with protons. The combined but opposite trends in lattice parameters lead to a relatively small decrease (∼3%) of the unit cell volume. However, the a and c directions seem to be principally affected by the Li+/H+ ion exchange and should be related to a change in the tunnel space. This is likely to originate from the slightly different arrangement of the basic building units of the Ti-O framework and/or a change of the occupation site of the M+ tunnel cation.8,11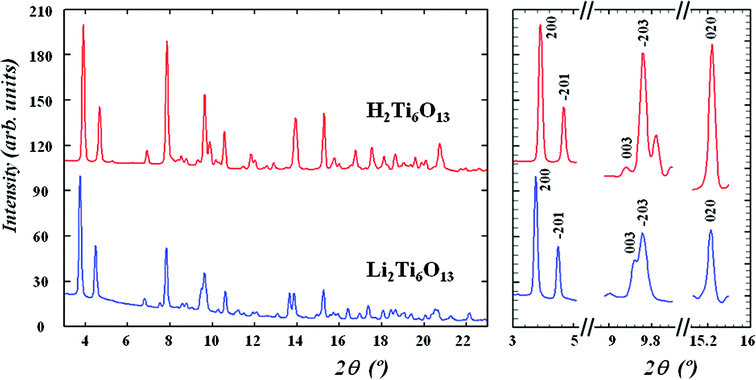 | ||
| Fig. 1 Synchrotron diffraction patterns of Li2Ti6O13 and H2Ti6O13 and selected angular regions. Although both diffraction patterns are quite similar, diffraction peaks are shifted towards higher (a and b directions) or lower (c direction) angles in H2Ti6O13, which explain the observed lattice parameter changes. | ||
| Compound | a/Å | b/Å | c/Å | β/° | V/Å3 |
|---|---|---|---|---|---|
| Li2Ti6O13 (PXRD) | 15.3457(7) | 3.7527(1) | 9.1528(2) | 99.466(2) | 519.92(3) |
| Li2Ti6O13 (NPD) | 15.3503(7) | 3.7526(2) | 9.1460(4) | 99.466(3) | 519.66(4) |
| Li2Ti6O13 (synchrotron) | 15.3488(1) | 3.7508(4) | 9.1385(9) | 99.494(3) | 518.88(9) |
| H2Ti6O13 (PXRD) | 14.6731(3) | 3.7461(1) | 9.2641(2) | 96.934(1) | 505.49(2) |
| H2Ti6O13 (NPD) | 14.6702(3) | 3.7447(1) | 9.2594(2) | 96.941(2) | 504.94(2) |
| H2Ti6O13 (synchrotron) | 14.5963(14) | 3.7283(3) | 9.2163(8) | 96.929(4) | 497.88(8) |
The synchrotron diffraction pattern of H2Ti6O13 was refined with the space group symmetry C2/m using Li2Ti6O13 as the initial structural model.11,30 According to this model, lithium has been placed on the 4i site. Isotropic displacement parameters were refined for all atoms with the exception of lithium in Li2Ti6O13 due to its negligible contribution to the pattern relative to the other heavier atoms. For refinement of H2Ti6O13 only Ti and O atoms have been considered. No attempts have been made to place the H atom. The graphical result of the Rietveld refinement of Li2Ti6O13 and H2Ti6O13 are given in Fig. 2.
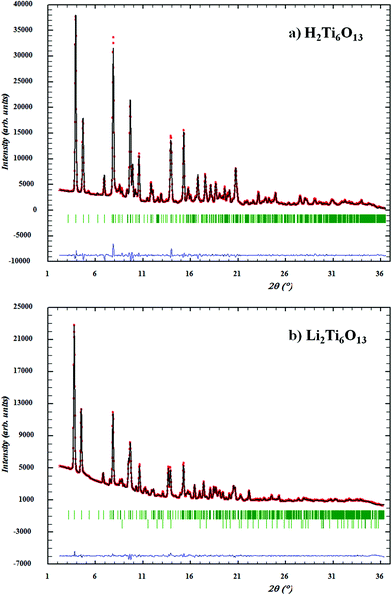 | ||
| Fig. 2 Observed (points), calculated (solid line) and difference (bottom) patterns for the Rietveld analysis of synchrotron diffraction data of (a) H2Ti6O13 and (b) Li2Ti6O13. Allowed Bragg reflections are presented as vertical bars, where TiO2 reflections are also shown as a secondary phase in the second difference row of the Li2Ti6O13 diffraction pattern. | ||
Fig. 3 shows the SAED patterns of H2Ti6O13 (Fig. 3(a)) and Li2Ti6O13 (Fig. 3(b)), taken along the same zone axis, [![[1 with combining macron]](https://www.rsc.org/images/entities/char_0031_0304.gif) 10]. Both are indexed using the monoclinic space group C2/m with cell parameters: a ≈ 15.3 Å, b ≈ 3.8 Å, c ≈ 9.1 Å and β ≈ 99° for Li2Ti6O138 and a ≈ 14.7 Å, b ≈ 3.7 Å, c ≈ 9.3 Å and β ≈ 97° for H2Ti6O13.
10]. Both are indexed using the monoclinic space group C2/m with cell parameters: a ≈ 15.3 Å, b ≈ 3.8 Å, c ≈ 9.1 Å and β ≈ 99° for Li2Ti6O138 and a ≈ 14.7 Å, b ≈ 3.7 Å, c ≈ 9.3 Å and β ≈ 97° for H2Ti6O13.
![Typical SAED patterns for (a) H2Ti6O13 and (b) Li2Ti6O13 taken along the zone axis [1̄10] and indexed using the C2/m monoclinic space group.](/image/article/2012/RA/c2ra01134d/c2ra01134d-f3.gif) | ||
Fig. 3 Typical SAED patterns for (a) H2Ti6O13 and (b) Li2Ti6O13 taken along the zone axis [![[1 with combining macron]](https://www.rsc.org/images/entities/char_0031_0304.gif) 10] and indexed using the C2/m monoclinic space group. 10] and indexed using the C2/m monoclinic space group. | ||
While X-ray diffraction using synchrotron radiation provides excellent resolution and signal-to-noise ratio, allowing for accurate phase analysis, neutron diffraction is indispensable for the deeper investigation of compounds containing lithium or hydrogen, i.e. both Li and H atoms can be readily located within the structure using subtle intensity changes in the neutron diffraction patterns.
The strategy to fit the neutron diffraction data obtained for both parent and proton exchanged derivatives was to refine first a structural model which did not contain Li or H, respectively. Afterwards, the missing atoms, Li and H, were located in the respective cell by calculating two dimensional Fourier difference maps, in which both Li and H atoms should be detectable because of their negative scattering length densities. A detailed description of the location of the tunnel ions will be reported elsewhere.
In agreement with previous reported models,8,11 the Li ions in Li2Ti6O13 were found to occupy the 4i (x,0,z) position with x = 0.0541 and z = 0.7609. Interestingly, the same 4i crystallographic site position (x,0,z) is found for H atoms in H2Ti6O13, but with x = 0.0017 and z = 0.3121. Refined atomic coordinates for Li2Ti6O13 and H2Ti6O13 are given in Table 2. Selected interatomic distances and bond angles are listed in Table 3. The final Rietveld refinement plots of the neutron diffraction patterns for Li2Ti6O13 and H2Ti6O13 are illustrated in Fig. 4.
| Li2Ti6O13a | ||||||
|---|---|---|---|---|---|---|
| Atom | Site | x | y | z | B/Å2 | Occupancy |
| Li1 | 4i | 0.0541 (9) | 0 | 0.7609 (18) | 2.134 (262) | 1.0 |
| Ti1 | 4i | 0.1164 (5) | 0 | 0.1000 (12) | 1.414 (148) | 1.0 |
| Ti2 | 4i | 0.1672 (4) | 0 | 0.4331 (10) | 0.555 (115) | 1.0 |
| Ti3 | 4i | 0.2311 (4) | 0 | 0.7684 (8) | 1.015 (123) | 1.0 |
| O1 | 2a | 0 | 0 | 0 | 1.236 (108) | 0.5 |
| O2 | 4i | 0.2386 (3) | 0 | 0.2453 (5) | 0.894 (75) | 1.0 |
| O3 | 4i | 0.0759 (3) | 0 | 0.2888 (5) | 1.107 (66) | 1.0 |
| O4 | 4i | 0.2955 (3) | 0 | 0.5713 (6) | 1.234 (85) | 1.0 |
| O5 | 4i | 0.1283 (3) | 0 | 0.6112 (6) | 1.342 (91) | 1.0 |
| O6 | 4i | 0.3536 (3) | 0 | 0.8878 (5) | 1.021 (68) | 1.0 |
| O7 | 4i | 0.1590 (3) | 0 | 0.9112 (5) | 1.276 (71) | 1.0 |
| H2Ti6O13b | ||||||
|---|---|---|---|---|---|---|
| Atom | Site | x | y | z | B/Å2 | Occupancy |
| a NPD reliability factors: Rwp = 3.51%, Rp = 2.69%, Re = 1.30%, RF = 1.71%, RB = 3.11% χ2 = 7.30 b NPD reliability factors: Rwp = 2.38%, Rp = 2.02%, Re = 2.13%, RF = 3.00%, RB = 3.21% χ2 = 1.25. | ||||||
| H1 | 4i | 0.0017 (3) | 0 | 0.3121 (4) | 2.229 (41) | 1.0 |
| Ti1 | 4i | 0.1138(5) | 0 | 0.0997(8) | 0.657 (62) | 1.0 |
| Ti2 | 4i | 0.1680 (6) | 0 | 0.4479 (10) | 0.753 (84) | 1.0 |
| Ti3 | 4i | 0.2255(6) | 0 | 0.7715 (8) | 0.157 (58) | 1.0 |
| O1 | 2a | 0 | 0 | 0 | 2.371 (44) | 0.5 |
| O2 | 4i | 0.2384 (2) | 0 | 0.2470 (3) | 0.166 (17) | 1.0 |
| O3 | 4i | 0.0666 (2) | 0 | 0.3051(3) | 0.565 (20) | 1.0 |
| O4 | 4i | 0.2956 (2) | 0 | 0.5669 (3) | 0.124 (17) | 1.0 |
| O5 | 4i | 0.1211 (2) | 0 | 0.6187 (3) | 0.658 (18) | 1.0 |
| O6 | 4i | 0.3573 (2) | 0 | 0.8716 (2) | 0.531 (17) | 1.0 |
| O7 | 4i | 0.1690 (2) | 0 | 0.9298 (3) | 1.255 (20) | 1.0 |
| Li2Ti6O13 | H2Ti6O13 | ||||||
|---|---|---|---|---|---|---|---|
| Li1–Ti1 | 3.093 (15) | O1–Li1–O3 | 74.3 (2) | H1–Ti1 | 2.712 (7) | O1–H1–O3 | 79.7 (3) |
| Li1–Ti3 | 2.71 (2) | O3–Li1–O5 | 122.1 (4) | H1–Ti2 | 2.606 (9)/3.532 (9) | O3–H1–O5 | 165.1 (4) |
| Li1–O1 | 2.463 (14) | O5–Li1–O7 | 89.1 (3) | H1–Ti3 | 3.329 (9) | O5–H1–O7 | 63.58 (13) |
| Li1–O3 | 1.972 (14) | O7–Li1–O1 | 74.5 (2) | H1–O1 | 2.887 (4) | O7–H1–O1 | 51.58 (8) |
| Li1–O5 | 1.919 (14) | H1–O3 | 0.961 (5) | ||||
| Li1–O7 | 1.937 (13) | H1–O5 | 1.984 (5) | ||||
| O1–O7 | 2.696 (4) | H1–O7 | 3.151 (4) | ||||
| O3–O5 | 3.405 (6) | O1–O7 | 2.638 (3) | ||||
| O3–O5 | 2.924 (4) | ||||||
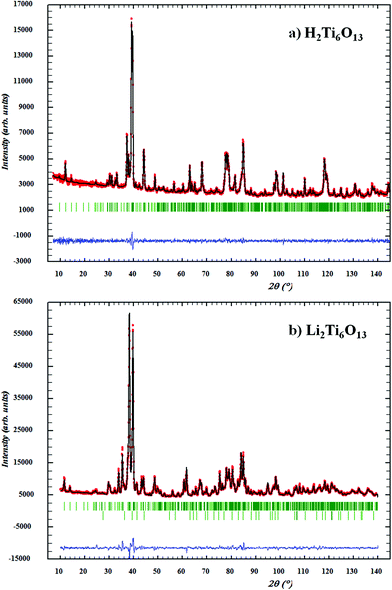 | ||
| Fig. 4 Observed (points), calculated (solid line) and difference (bottom) patterns for the Rietveld analysis from neutron powder diffraction data of (a) H2Ti6O13 and (b) Li2Ti6O13. The vertical bars indicate the peak positions of all allowed Bragg reflections, where TiO2 reflections are also shown as secondary phase in the second difference row of the Li2Ti6O13 diffraction pattern. | ||
Li presents a strongly distorted square planar LiO4 coordination, which is more precisely defined as [3+1] coordination by oxygen, in as much as three Li–O bond distances are similar and close to 1.9 Å, while the fourth distance is much longer, 2.5 Å for Li–O1, (see Fig. 5(b) and Tables 2 and 3). On the other hand, the H atom in H2Ti6O13 (Fig. 5(a)) is shifted mainly along the z coordinate towards a more central position within the tunnel, where the proton forms a covalent bond with oxygen atom O3 in view of the short O3–H bond distance: 0.961 Å. The much longer bond distance O5–H (1.984 Å) points to a hydrogen bond with that oxygen atom across the tunnel space. This asymmetric hydrogen bond of O3–H⋯O5 slightly deviates from linearity (165.1°).
![Schematic representations of the crystal structure of (a) H2Ti6O13 and (b) Li2Ti6O13. Ti atoms are centred by oxygen atoms in a distorted octahedral environment. These are corner-linked to form triple blocks of edge-sharing TiO6 octahedra. Li and H atoms are shown as spheres located in the tunnel; Li exhibit a distorted squared planar (more precisely defined as [3+1]) coordination by oxygen, while H forms a covalent bond with O3 and a hydrogen bond with O5 across the tunnel space.](/image/article/2012/RA/c2ra01134d/c2ra01134d-f5.gif) | ||
| Fig. 5 Schematic representations of the crystal structure of (a) H2Ti6O13 and (b) Li2Ti6O13. Ti atoms are centred by oxygen atoms in a distorted octahedral environment. These are corner-linked to form triple blocks of edge-sharing TiO6 octahedra. Li and H atoms are shown as spheres located in the tunnel; Li exhibit a distorted squared planar (more precisely defined as [3+1]) coordination by oxygen, while H forms a covalent bond with O3 and a hydrogen bond with O5 across the tunnel space. | ||
Similarly to Li2Ti6O13, the basic structural motif of the Ti6O132− framework structure in H2Ti6O13 consists of blocks of three edge-sharing TiO6 octahedra, which have remained mainly unchanged during the ion exchange reaction. The TiO6 octahedra in H2Ti6O13 are significantly distorted, having average Ti–O distances ranging from 1.81 to 2.14 Å. These values are comparable with those observed in Li2Ti6O13, which vary from 1.87 to 2.11 Å. As illustrated in Fig. 5, oxygen atoms O3 and O5 are placed directly opposite across the tunnel space. Therefore the O3–O5 distance can be used as a measure of the opening of the 3 × 1 octahedra tunnel space. The O3–O5 distance is significantly shorter for H2Ti6O13 than for the parent Li2Ti6O13 (2.924 Å vs. 3.405 Å respectively). This circumstance must be related to the different size of Li and H, as well as to the bonding characteristic of the hydrogen atom. It is important to mention that the O3–O5 distance is directly related to the a lattice parameter and that this cell parameter has been found to be significantly smaller in H2Ti6O13.
3.3 Electrochemical properties
The main electrochemical characteristics of H2Ti6O13 are herein presented and compared to previously reported Li2Ti6O13.8Fig. 6 shows a typical voltage composition plot for the first discharge as well as the incremental capacity between 3.0 and 1.0 V for the first and second cycle of two cells bearing either H2Ti6O13 (Fig. 6(a)) or Li2Ti6O13 (Fig. 6(b)), as the electroactive material. These cells were run at ∼C/12 or 1 Li per formula unit every 12 h (0.1 mA cm−2 or ∼4.5 μA mg−1). As it can be seen very significant differences are detected in the voltage profile. Li reacts with H2Ti6O13 through three pseudo-plateaus in the 2.1–1.0 V range (labelled as IH, IIH and IIIH), which display the corresponding minima in the incremental capacity curve (I′H, II′H and III′H). These quasi constant-voltage regions at 1.95, 1.75 and 1.47 V can be assigned to biphasic regions of different extent. Single phase regions are detected in between the biphasic regions as minima in the incremental capacity curve. Interestingly, the Li insertion profile of Li2Ti6O13 only shows one long biphasic region at 1.47 V and two apparent single phase regions at the beginning and at the end of the corresponding plateau. On the other hand, when comparing the first and second cycle of both cells a similar behaviour is found after the first discharge: the voltage profile is different indicating that an irreversible transformation occurs in both cases. For clarity Fig. 6 only shows two complete discharge–charge cycles but this is enough to show the reversibility behaviour after the first discharge.
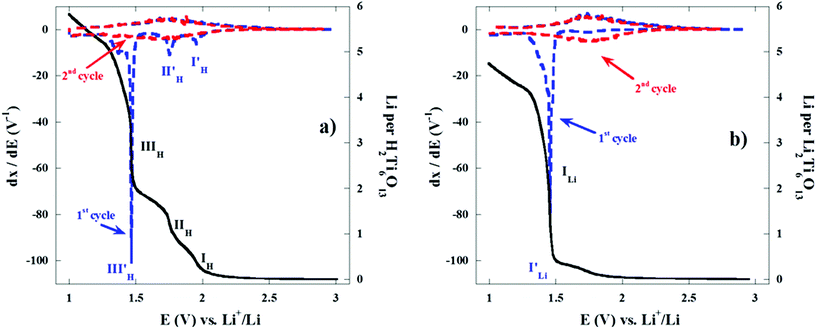 | ||
| Fig. 6 Variation of composition for the first discharge (continuous line) and incremental capacity for the first and the second (dashed lines) discharge–charge cycles vs. voltage plot for (a) H2Ti6O13 and (b) Li2Ti6O13 at ∼C/12 rate (0.1 mA cm−2 or ∼4.5 μA mg−1). | ||
The hexatitanate H2Ti6O13 reacts with almost 6 Li atoms per formula unit in the 3–1 V range, yielding a specific first discharge capacity of 315 mA h g−1. This value is close to the expected theoretical discharge capacity for this compound involving full reduction of Ti4+ to Ti3+. Fig. 7 clearly shows that the total amount of lithium at the end of the first discharge is significantly higher (two more lithium per formula) in the case of H2Ti6O13. The first discharge curves shown in Fig. 6 and 7 provide evidence that Li2Ti6O13 and H2Ti6O13 display their main electrochemical process at almost the same voltage, i.e. 1.47 V. Even more, the quantity of lithium involved in the long plateau at 1.47 V is the same. However, the difference in voltage profile and lithium quantity involved in the high voltage region is very significant. Once we have checked that the particle size of samples of both homologous titanates is similar, we have not found any reason why Ti(IV) seems to be reduced in more extent in H2Ti6O13 than in Li2Ti6O13. Hence, a reaction mechanism involving displacement of H by Li in H2Ti6O13 may be taking place in the high voltage range.
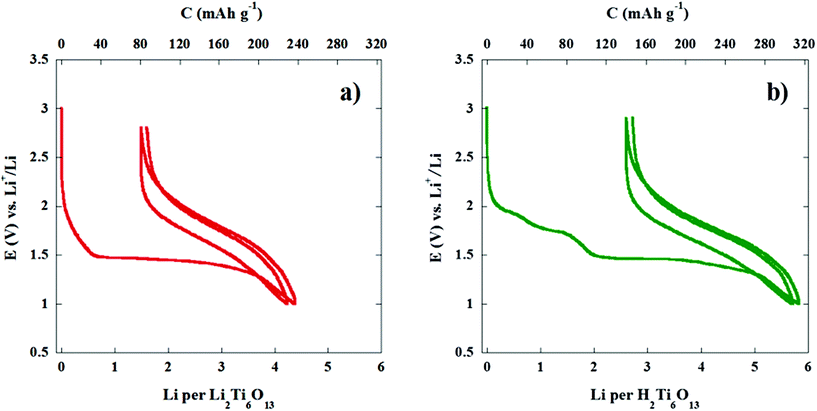 | ||
| Fig. 7 First and second cycles (discharge–charge) for (a) Li2Ti6O13 and (b) H2Ti6O13 at ∼C/12 rate (0.1 mA cm−2 or ∼4.5 μA mg−1). | ||
As previously reported,8,11 the reaction of lithium with Li2Ti6O13 yields a new phase through an irreversible phase transformation (Fig. 7(a)); the highly lithiathed phase can afterwards be deinserted and cycled although the nature of such phase has not yet been reported. The first discharge curve of H2Ti6O13 is also characterized by the presence of the same long plateau located at 1.47 V vs. Li+/Li. It is likely that in the case of H2Ti6O13 the same irreversible phase transformation (Fig. 7(b)) is taking place even though the starting composition is different. This is in agreement with the observed cycling behaviour after the long plateau which is the same for both compounds as it is shown in Fig. 7. Again, a similar behaviour is found even though the starting composition of the titanates is different and the high voltage region of the first discharge is also different. At this point it is convenient to compare with the other known homologous titanate, Na2Ti6O13 trying to get some other clues on the reaction mechanism between lithium and H2Ti6O13.
Fig. 8 illustrates the first discharge–charge cycle in the 3.0–1.0 V region of the three known homologous titanates (Na2Ti6O13, Li2Ti6O13 and H2Ti6O13). As it can be seen the shape of the reversible insertion voltage profile observed in Na2Ti6O13 is somehow similar to that of H2Ti6O13 in the higher voltage region. However, although the insertion of the two lithium ions in Na2Ti6O138,9 is reversible, for H2Ti6O13 an irreversible behaviour has been found in the 2.0 to 1.7 V voltage range. These findings were obtained by discharging two cells down to 1.87 and 1.49 V, respectively, and charging afterwards under potentiostatic equilibrium conditions (results are not shown here).
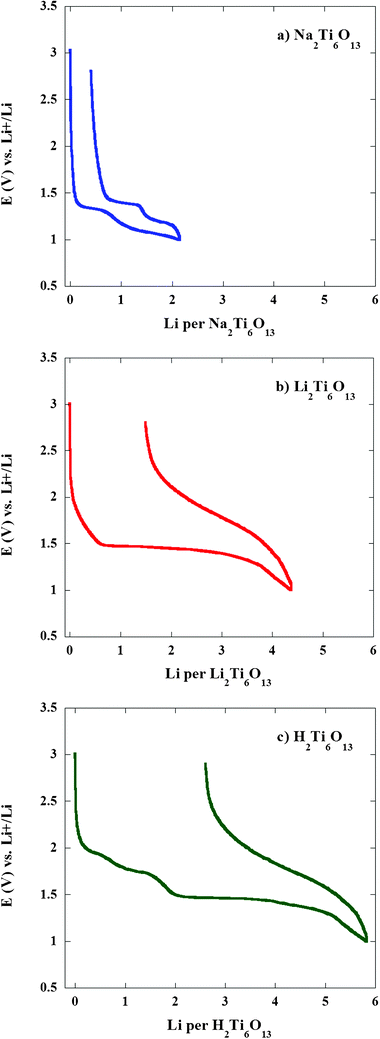 | ||
| Fig. 8 Comparative first discharge–charge voltage–composition curve in the 3.0–1.0 V range at a ∼C/12 rate (0.1 mA cm−2 or ∼4.5 μA mg−1) for (a) Na2Ti6O13, (b) Li2Ti6O13 and (c) H2Ti6O13. | ||
Regarding the electrochemical performances of the three homologous titanates, Fig. 9 shows the variation of cell capacity upon cycling. In all cases cells were run at ∼C/12 (1 Li per formula unit every 12 h, ±0.1 mA cm−2). After the capacity loss due to the irreversible transformation of first discharge, Li2Ti6O13 exhibits good cycling properties with a reversible specific capacity of 160 mA h g−1, as it is shown for the first 25 cycles. Regarding to H2Ti6O13, it develops similar reversible specific capacity values (170 mA h g−1), with a remarkable capacity retention. As can be observed, both ion exchanged products exhibit higher reversible capacities than Na2Ti6O13 (110 mA h g−1).
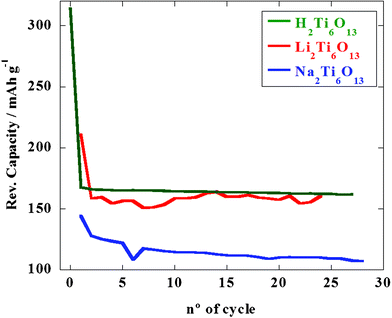 | ||
| Fig. 9 Reversible specific capacity in the 3.0–1.0 V range at a ∼C/12 rate for Na2Ti6O13 (blue line), Li2Ti6O13 (red line) and H2Ti6O13 (green line). | ||
The rate capability of H2Ti6O13 has then been further tested at different discharge rates. Fig. 10 shows the specific capacity upon cycling at different current rates for cycle no. ≥ 2. Cells bearing H2Ti6O13 are able to sustain increasing discharge rates without an apparent capacity loss up to C/4 (insertion of 1 Li every four hours) while maintaining a very good cycling behavior. A fast capacity fade is observed for higher discharging rate as it can be seen in the cell discharged at C/2 (insertion of 1 Li every 2 h) for which capacity has dropped to 106 mA h g−1 at cycle no. 50. It is interesting to note that this behavior is exhibited by a H2Ti6O13 electrode whose processing has not been optimized. Therefore, an increase in the electrochemical performances is expected with the improvement of the electrode processing system, even at higher rates.
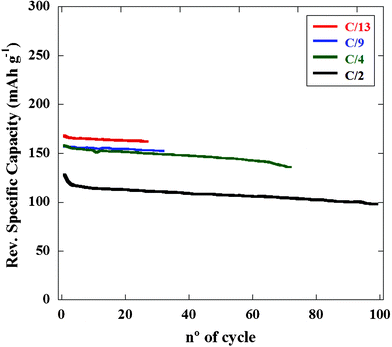 | ||
| Fig. 10 Comparative electrochemical behaviour of Li/H2Ti6O13 cells discharged down to 1.0 V at different discharge rates. | ||
The observed voltage for reduction of H2Ti6O13 with lithium is within the usual voltage range for reduction of Ti(IV) to Ti(III) as observed for the insertion of Li into some previously reported titanates and titanium oxides.8–10,31,32 Nevertheless, the electrochemical reaction in the 3.0–1.0 V range has been further investigated with close to equilibrium experiments run under isothermal conditions (25 °C) in order to obtain accurate information on the maximum quantity of lithium that reacts with H2Ti6O13 in each of the detected processes.
Fig. 11 shows the first discharge–charge cycle of a cell from its rest potential (ca. 3.0 V) to 1.0 V, under equilibrium conditions reached by applying intermittent galvanostatic and potentiostatic methods. Thus we confirm that the two initial pseudo-plateaus located at 1.9 and 1.85 V (labelled as IH and IIH in Fig. 6) involve a total of two lithium atoms per formula unit. Interestingly it seems that each of these processes is associated with the reaction of ca. one lithium atom. At lower voltages the long plateau develops through the reaction with four additional lithium ions (Fig. 11(a)).
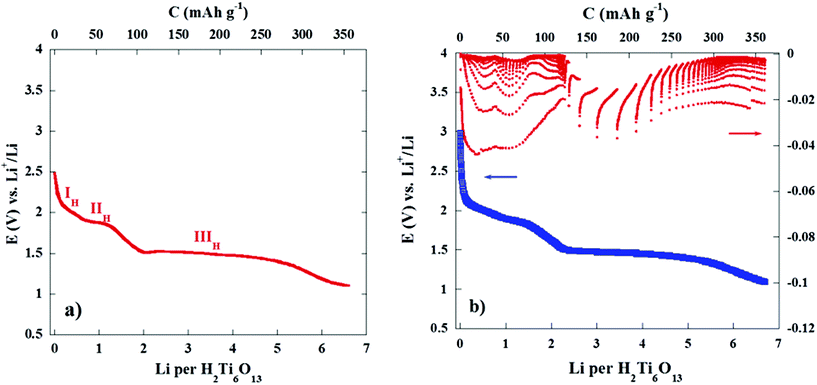 | ||
| Fig. 11 Quasi-equilibrium measurements on a Li/H2Ti6O13 cell under (a) GITT conditions, ±0.1 mA cm−2 for 30 min every 12 h and discharged down to 1.0 V and (b) PITT conditions, ±10 mV for 12 h. | ||
Fig. 11(b) shows a PITT experiment (±10 mV every 12 h) where the relaxation of current in the 2.9–1.0 V voltage interval is depicted. In the 2.9–2.1 and 1.8–1.5 voltage ranges the cell voltage decreases continuously and the current relaxation reaches a value close to zero (|I| < 0.0005 mA) after 12 h. This situation confirms that lithium diffusion is the controlling process in these two regions, which corresponds with the two narrow solid solutions (I′H, II′H) found previously in the same voltage range (see Fig. 7, for example).
These former regions are followed by the already referred quasi-constant voltage region at ca. 1.5 V, where current relaxation shows the typical behaviour of a process that is not controlled by lithium diffusion. This two phase transformation proceeds with a slower kinetic and occurs up to ca. 5 lithium atoms per formula. For higher lithium insertions values, x > 5.5 a new solid solution develops as deduced from the close to zero relaxation of current. The end of this region is not clearly distinguished in the potentiostatic experiment. However, the galvanostatic experiment (Fig. 11(a)) confirms that the end of the S-shaped curve reaches ca. 6 lithium per formula.
The reaction of H2Ti6O13 with six lithium ions, can be explained considering the full reduction of all six Ti(IV) to Ti(III), accordingly to eqn (1):
| H2(Ti4+)6O13 + 6e− + 6Li+ → Li6H2(Ti3+)6O13 | (1) |
However, taking in mind the electrochemical differences and similarities encountered between H2Ti6O13 and Li2Ti6O13, a two step reaction involving two and four lithium ions, respectively, may also fit with the reaction of six lithium ions altogether, which is described using nominal compositions by eqn (2a) and (2b):
| H2(Ti4+)6O13 + 2e− + 2Li+ → Li2(Ti4+)6O13 + H2 | (2a) |
| Li2(Ti4+)6O13 + 4e− + 4Li+ → Li6(Ti3+)4(Ti4+)2O13 | (2b) |
Although the maximum lithium quantity involved in the reaction agrees with both proposed mechanism, the intermediate stages observed in the voltage profiles are better justified by eqn (2a) and (2b); H2Ti6O13 reacts with the first two lithium ions resulting in the reduction of protons to give H2 and nominally Li2Ti6O13. In the second stage (eqn (2b)), the reaction proceeds with the reduction of Ti(IV) to Ti(III) in a similar manner to that reported for Li2Ti6O13.8 Therefore, processes labelled IH, IIH in Fig. 6 should correspond to the reduction of two protons, whereas the process labelled IIIH in Fig. 6 should correspond to Ti(IV)/Ti(III) reduction. This displacement–transformation mechanism would account for the irreversibility of the reaction of H2Ti6O13 with the first two lithium ions, whereas the reaction of Na2Ti6O13 with the same two lithium ions is reversible. It also agrees with the twin behaviour of H2Ti6O13, after having reacted with 2 lithium ions, and Li2Ti6O13.
In order to find evidence supporting the mechanism described in eqn (2a) and (2b) an IR spectroscopic study was carried out.
3.4 IR characterisation
Fig. 12 shows the IR spectra of Li2Ti6O13 and H2Ti6O13 obtained by acidic exchange reaction on Li2Ti6O13. The spectra of both titanates exhibit absorption bands between ν = 800–750 cm−1 and slightly above ν = 500 cm−1 corresponding to the symmetric and asymmetric stretching vibration of Ti–O bond in the octahedra, respectively,33 in agreement with the retention of the basic [Ti–O]6 framework. The main difference between the spectrum of H2Ti6O13 and that of Li2Ti6O13 is the presence in the former of a strong broad peak around ν = 3400 cm−1 (marked with a circle). This absorption corresponds to the O–H stretching vibration, which agrees well with the structural findings related to H2Ti6O13, in which the proton is involved in a covalent bond to an oxygen atom. Another important characteristic of H2Ti6O13 is the band close to ν = 1030 cm−1, which is assigned to the out of plane O–H⋯O bending vibration.34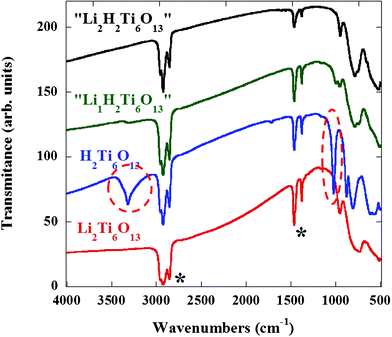 | ||
| Fig. 12 IR spectra of Li2Ti6O13 (red line), H2Ti6O13 (blue line), “Li1H2Ti6O13” (green line) and “Li2H2Ti6O13” (black line). Signals at 3000–2800 and 1500–1300 cm−1 corresponds to Nujol mineral oil (*). The bands marked with a circle, at 3400 and 1030 cm−1, corresponding to the O–H stretching and O–H⋯O bending vibrations of H2Ti6O13, disappear progressively as the lithium content increases in the chemically lithiated “LixH2Ti6O13”. | ||
The chemically lithiated compounds of nominal compositions “Li1H2Ti6O13” and “Li2H2Ti6O13” also studied using IR spectroscopy, were found to mimic the materials formed during the electrochemical reaction in the higher voltage region. Upon reaction with lithium the IR bands characteristic for the Ti–O skeleton are practically unchanged, but it is highly remarkable that a smearing of the signals at ν = 3400 and 1030 cm−1, typical of the O–H and O–H⋯O vibrations, is observed in nominal “Li1H2Ti6O13”. Even more interestingly, these signals are no longer observed in nominal “Li2H2Ti6O13” which exhibits an IR spectrum quite similar to that of Li2Ti6O13.
Bearing in mind the results from IR spectroscopy, i.e. the disappearance of the O–H stretching and the O–H⋯O bending vibration modes in the lithiated compound “Li2H2Ti6O13” on one hand, and the similar electrochemical behaviour of Li2Ti6O13 and the product electrochemically obtained after the reaction of H2Ti6O13 with 2 Li (below 1.5 V) on the other, we propose the mechanism outlined in eqn (2) to explain the electrochemical behaviour of H2Ti6O13 regarding its reaction with lithium.
According to these results, the ion exchange process of Li+ by H+ to get H2Ti6O13 leads to an improvement of the electrochemical properties with respect to Na2Ti6O13. However, with respect to Li2Ti6O13,30 only capacity retention is improved. Nevertheless, regarding applications, this improvement may not be enough to compensate for the extra synthesis step required to produce H2Ti6O13 by ion exchange of Li2Ti6O13. Note that H2Ti6O13 is obtained from Li2Ti6O13, but during lithiation the very first lithium atoms transform H2Ti6O13 to Li2Ti6O13 which is finally the active material. Anyhow, we believe that the electrochemical properties of H2Ti6O13 deserve consideration to analyse the similarities and differences found in the intercalation chemistry of the three titanate phases in relation to structural aspects. Neutron powder diffraction experiments on lithiated titanates are presently under way and are expected to shed light on the site position that inserted lithium occupies in LixA2Ti6O13 (A = Na, Li and H).
We have been made aware of a very recent patent24 describing an alternative use of H2Ti6O13 as an intermediate to prepare H2Ti12O25 and TiO2(B). These two compounds are claimed to exhibit excellent electrochemical properties.
4. Conclusions
H2Ti6O13 has been obtained at low temperature by a simple Li+/H+ ion exchange on Li2Ti6O13 using benzoic acid as the exchange agent. Li2Ti6O13 itself was prepared by Na+/Li+ ion exchange on Na2Ti6O13. The structural characterisation has shown that the [Ti6O13]2− skeleton framework, consisting of 3 × 1 edge-linked octahedra blocks, is maintained during the successive exchange reactions. Significant changes of lattice parameters are observed, which specially affect the distortion in the ac plane. This situation has been interpreted in terms of the nature of bonding of the “tunnel” ion or proton. Hydrogen forms a covalent bond with oxygen atom O3, but in addition a larger almost linear hydrogen bond forms across the tunnel with oxygen atom O5. The lithium insertion properties of H2Ti6O13 have been studied electrochemically. In view of the behavior found we propose that the first two Li atoms that react with H2Ti6O13 in the first discharge produce a displacement reaction involving the reduction of H+ yielding H2 and Li2Ti6O13. Results from IR spectroscopy show a progressive loss of the O–H stretching and H–O⋯H bending modes with increasing lithiation of H2Ti6O13, in agreement with the proposed reaction mechanism. The reversible electrochemical capacity reaches a value of 170 mA h g−1 at an average voltage of 1.7 V, which is well maintained upon cycling even at increasing discharge rates. These values are comparable to those reported for Li2Ti6O13, in agreement with the formation of Li2Ti6O13 at the very beginning of the reaction with lithium.Acknowledgements
We thank the Ministerio de Ciencia e Innovación, Comunidad de Madrid and the European Commission (7th Framework Programme through the “Research Infrastructures” action of the “Capacities” Programme) for funding the projects MAT2010-19837-C06-01, P2009/PPQ-1626 and CP-CSA_INFRA-2008-1.1.1 (n° 226507-NMI3), respectively. Financial support from Universidad CEU San Pablo is also acknowledged.References
- M. E. Arroyo y de Dompablo, E. Morán, A. Várez and F. García-Alvarado, Mater. Res. Bull., 1997, 32, 993–1001 CrossRef.
- T. Ohzuku, A. Ueda and N. Yamamoto, J. Electrochem. Soc., 1995, 142, 1431–1435 CrossRef CAS.
- A. Kuhn, C. Baehtz and F. García-Alvarado, J. Power Sources, 2007, 174, 421–427 CrossRef CAS.
- B. Zachau-Christiansen, K. West, T. Jacobsen and S. Atlung, Solid State Ionics, 1988, 28–30, 1176–1182 CrossRef.
- D. W. Murphy, R. J. Cava, S. M. Zahurak and A. Santoro, Solid State Ionics, 1983, 9–10, 413–417 CrossRef CAS.
- R. Marchand, L. Brohan and M. Tournoux, Mater. Res. Bull., 1980, 15, 1129–1133 CrossRef CAS.
- M. A. Reddy, M. S. Kishore, V. Pralong, U. V. Varadaraju and B. Raveau, Electrochem. Solid-State Lett., 2007, 10, A29–A31 CrossRef CAS.
- J. C. Pérez-Flores, A. Kuhn and F. García-Alvarado, J. Power Sources, 2011, 196, 1378–1385 CrossRef.
- R. Dominko, E. Baudrin, P. Umek, D. Arcon, M. Gaberscek and J. Jamnik, Electrochem. Commun., 2006, 8, 673–677 CrossRef CAS.
- R. Dominko, L. Dupont, M. Gaberscek, J. Jamnik and E. Baudrin, J. Power Sources, 2007, 174, 1172–1176 CrossRef CAS.
- K. Kataoka, J. Awaka, N. Kijima, H. Hayakawa, K.-i. Ohshima and J. Akimoto, Chem. Mater., 2011, 23, 2344–2352 CrossRef CAS.
- F. Capitaine, P. Gravereau and C. Delmas, Solid State Ionics, 1996, 89, 197–202 CrossRef CAS.
- A. R. Armstrong and P. G. Bruce, Nature, 1996, 381, 499–500 CrossRef CAS.
- A. R. Armstrong and R. Gitzendanner, Chem. Commun., 1998, 1833–1834 RSC.
- A. D. Robertson, A. R. Armstrong, A. J. Fowkes and P. G. Bruce, J. Mater. Chem., 2001, 11, 113–118 RSC.
- G.-A. Nazri and G. Pistoia,Lithium Batteries: Science and Technology, Springer, 2003 Search PubMed.
- J. Yang, D. Li, X. Wang, X. Yang and L. Lu, J. Mater. Sci., 2003, 38, 2907–2911 CrossRef CAS.
- K. Chiba, N. Kijima, Y. Takahashi, Y. Idemoto and J. Akimoto, Solid State Ionics, 2008, 178, 1725–1730 CrossRef CAS.
- H. Izawa, S. Kikkawa and M. Koizumi, J. Phys. Chem., 1982, 86, 5023–5026 CrossRef CAS.
- J. Akimoto, K. Chiba, N. Kijima, H. Hayakawa, S. Hayashi, Y. Gotoh and Y. Idemoto, J. Electrochem. Soc., 2011, 158, A546–A549 CrossRef CAS.
- M. Edisson Jr., P. M. Jardim, B. A. Marinkovic, F. C. Rizzo, M. A. S. de Abreu, J. L. Zotin and A. S. Araújo, Nanotechnology, 2007, 18, 495710 CrossRef.
- Y. Zhao, U.-H. Lee, M. Suh and Y.-U. Kwon, Bull. Korean Chem. Soc., 2004, 25, 1341 CrossRef CAS.
- J. Akimoto, K. Kataoka, A. Kawashima and H. Hayakawa, WO, 2010058729 A1, p. 34 Search PubMed.
- J. Akimoto, K. Kataoka, A. Kawashima and H. Hayakawa, US, 20110223098A1, p. 16 Search PubMed.
- H. Rietveld, Acta Crystallogr., 1966, 20, 508–513 CrossRef CAS.
- H. Rietveld, Acta Crystallogr., 1967, 22, 151–152 CrossRef CAS.
- J. Rodriguez-Carvajal, Phys. B, 1993, 192, 55–69 CrossRef CAS.
- K. Momma and F. Izumi, J. Appl. Crystallogr., 2008, 41, 653–658 CrossRef CAS.
- S. Papp, L. Kõrösi, V. Meynen, P. Cool, E. F. Vansant and I. Dékány, J. Solid State Chem., 2005, 178, 1614–1619 CrossRef CAS.
- J. C. Pérez-Flores, C. Baehtz, M. Hoelzel, A. Kuhn and F. García-Alvarado, Phys. Chem. Chem. Phys., 2012, 14, 2892–2899 RSC.
- S. Y. Yin, L. Song, X. Y. Wang, Y. H. Huang, K. L. Zhang and Y. X. Zhang, Electrochem. Commun., 2009, 11, 1251–1254 CrossRef CAS.
- K. Zaghib, M. Armand and M. Gauthier, J. Electrochem. Soc., 1998, 145, 3135–3140 CrossRef CAS.
- G. C. Allen and M. Paul, Appl. Spectrosc., 1995, 49, 451–458 CrossRef CAS.
- K. Nakamoto, Infrared and Raman Spectra of Inorganic and Coordination Compunds, John Wiley&Sons, New York, 1986 Search PubMed.
Footnote |
| † Electronic Supplementary Information (ESI) available: Refined lattice parameters and diffractograms of Li2Ti6O13 and H2Ti6O13 obtained by Rietveld analysis of XRD data; refined lattice parameters, reliability factors and structural parameters for Li2Ti6O13 and H2Ti6O13 obtained by Rietveld analysis of synchrotron diffraction data. See DOI: 10.1039/c2ra01134d/ |
| This journal is © The Royal Society of Chemistry 2012 |
