DOI:
10.1039/C2RA01050J
(Paper)
RSC Adv., 2012,
2, 5164-5171
Investigation of intrinsic mechanisms of aluminium anodization processes by analyzing the current density
Received
8th November 2011
, Accepted 23rd March 2012
First published on 27th April 2012
Abstract
The intrinsic mechanisms of aluminium anodization processes have been investigated in detail by analyzing the anodization current density (ia). The characteristics and general chemical reactions of mild anodization (MA) and hard anodization (HA) have been discussed, and the avalanche of the electronic current is considered to be the main reason to trigger the HA process. Moreover, the formation mechanisms of the maximum anodization voltage (Umax) in different electrolytes have been studied in detail, and it is found that the electrolyte dissociation constant can have a direct impact on the avalanche electronic current density (ie) and Umax. Based on the above arguments, the electrolyte modifying process has been investigated. In addition, the representative microstructural morphologies of anodic aluminium oxides (AAO) together with their intrinsic formation mechanisms have also been studied.
1. Introduction
Anodic aluminium oxides (AAO) fabricated by aluminium anodization processes have been investigated for more than 50 years,1–7 and have attracted considerable attention in both scientific and commercial fields. As a typical nanoporous material, AAO has become one of the most commonly used templates for the fabrication of diverse nanomaterials such as nanorods, nanowires, nanotubes and nanopores,8–13 since they have controllable microstructural parameters.14–17 Moreover, they can also be used as functional materials for various applications, such as sensors, filters, photonics, etc.13,18,19
Generally, AAO can be fabricated by two anodization regimes: conventional so-called mild anodization (MA) and hard anodization (HA).6,15,17,20–27 At present, most of the AAO are fabricated by MA processes, which have good reproducibility and reliability.6,15,20 However, these processes usually require an extremely long processing time, and their self-ordering windows are very narrow, limiting their practical applications to a large extent. To solve these problems, HA processes have attracted much attention in recent years.17,21–27 Compared with the MA processes, they always have a faster film growth rate and wider self-ordering windows. Although AAO fabricated by HA processes have merit, some problems still exist:17,21–27 (1) the processes are relatively unstable, and the breakdown phenomena readily occur, (2) the current–time transients show a nearly exponential decrease under constant-voltage mode, thus it is difficult to control the microstructural parameters of AAO, (3) the “cell separation” phenomenon occurs easily, resulting in the formation of AAO with a lower mechanical strength. In addition, the present definitions of MA and HA processes are not clear and usually cause some confusion. In former studies, the high anodization voltage, high mechanical strength of AAO and large current density have been summarized as characteristics of HA processes.17,22–24,26 However, this argument may face a challenge: (1) HA processes can conduct under both high and low anodization voltages by varying the electrolytes,17,21–27 (2) AAO fabricated by HA processes can have a lower mechanical strength than that prepared by MA processes because of the occurrence of “cell separation” phenomena,21,24–27 (3) considering that the anodization current density is made up of ionic current density and electronic current density, it is not precise to simply summarize “large current density” as a characteristic of HA processes.28–30 Therefore, finding intrinsic mechanisms and characteristics of different aluminium anodization processes is significant.
In the present work, the intrinsic mechanisms of aluminium anodization processes have been studied by analyzing the current density. The magnitude and composition of anodization current density (e.g., ionic current density and electronic current density) together with their influences on the maximum anodization voltage, the modifying of the electrolyte and microstructural morphologies of AAO have been investigated in detail. In addition, the impact of the electrolyte dissociation constant on the anodization processes has also been studied. With these results and achievements, the aluminium anodization processes can now be more controllable and predictable, widening their applications to a large extent.
2. Experimental
Highly pure aluminium sheets (99.99%) with a thickness of 1 mm were used as the starting materials. The sheets were electropolished at 0–5 °C and 21 V for 5 min in a mixture solution of perchloric acid and ethanol (1![[thin space (1/6-em)]](https://www.rsc.org/images/entities/char_2009.gif) :
:![[thin space (1/6-em)]](https://www.rsc.org/images/entities/char_2009.gif) 4, v/v) to diminish the roughness of their surface. Then the sheet was carefully washed and put into a tailor-made holder with a square area of 1 cm2 exposed to the electrolyte, and the heat was effectively removed using a copper plate which was in thermal contact with the aluminium sheet. Anodization processes were conducted in 0.3 M oxalic acid solution (Electrolyte I, 0–5 °C) and H2C2O4–C2H5OH–H2O mixture solution (ethanol
4, v/v) to diminish the roughness of their surface. Then the sheet was carefully washed and put into a tailor-made holder with a square area of 1 cm2 exposed to the electrolyte, and the heat was effectively removed using a copper plate which was in thermal contact with the aluminium sheet. Anodization processes were conducted in 0.3 M oxalic acid solution (Electrolyte I, 0–5 °C) and H2C2O4–C2H5OH–H2O mixture solution (ethanol![[thin space (1/6-em)]](https://www.rsc.org/images/entities/char_2009.gif) :
:![[thin space (1/6-em)]](https://www.rsc.org/images/entities/char_2009.gif) Electrolyte I = 1
Electrolyte I = 1![[thin space (1/6-em)]](https://www.rsc.org/images/entities/char_2009.gif) :
:![[thin space (1/6-em)]](https://www.rsc.org/images/entities/char_2009.gif) 2, 1
2, 1![[thin space (1/6-em)]](https://www.rsc.org/images/entities/char_2009.gif) :
:![[thin space (1/6-em)]](https://www.rsc.org/images/entities/char_2009.gif) 3 v/v, −10 °C), respectively, with vigorous magnetic stirring. A powerful low temperature bath, together with an electrolysis cell (1 L) was applied to maintain the low temperatures required for anodization. In addition, an improved voltage increasing process was performed in the oxalic acid electrolytes: (1) the anodization voltage (Ua) was increased at a rate of 1 V s−1 until the anodization current density (ia) reached the setting value (300 or 500 A m−2), (2) a constant-current process was applied, by which the Ua can be smoothly increased to the high target value, (3) the anodization was conducted at a designated Ua with a constant-voltage mode. The residual aluminium was removed using a saturated CuCl2 solution: (1) CuCl2·2H2O of 390 g was dissolved into 300 ml de-ionized water under 50 °C, then the temperature of the solution was reduced to 30 °C, and a saturated CuCl2 solution could be obtained, (2) the samples were put into a porous plastic cup, and then immersed into the as-prepared saturated CuCl2 solution with vigorous magnetic stirring under 30 °C for 2 min to remove the residual aluminium. The microstructural morphologies of the as-prepared specimens were examined by a field-emission scanning electron microscope (FE-SEM: LEO 1530 VP). The anodization voltage and current were measured by multimeters (Keithley 2010 and 2410).
3 v/v, −10 °C), respectively, with vigorous magnetic stirring. A powerful low temperature bath, together with an electrolysis cell (1 L) was applied to maintain the low temperatures required for anodization. In addition, an improved voltage increasing process was performed in the oxalic acid electrolytes: (1) the anodization voltage (Ua) was increased at a rate of 1 V s−1 until the anodization current density (ia) reached the setting value (300 or 500 A m−2), (2) a constant-current process was applied, by which the Ua can be smoothly increased to the high target value, (3) the anodization was conducted at a designated Ua with a constant-voltage mode. The residual aluminium was removed using a saturated CuCl2 solution: (1) CuCl2·2H2O of 390 g was dissolved into 300 ml de-ionized water under 50 °C, then the temperature of the solution was reduced to 30 °C, and a saturated CuCl2 solution could be obtained, (2) the samples were put into a porous plastic cup, and then immersed into the as-prepared saturated CuCl2 solution with vigorous magnetic stirring under 30 °C for 2 min to remove the residual aluminium. The microstructural morphologies of the as-prepared specimens were examined by a field-emission scanning electron microscope (FE-SEM: LEO 1530 VP). The anodization voltage and current were measured by multimeters (Keithley 2010 and 2410).
3. Results and discussion
3.1 Chemical reactions
There are many complicated chemical reactions occur during aluminium anodization processes, and these reactions have been investigated for many years by several research groups.7,16,28–33 It is commonly accepted that the fabrication process of porous AAO is made up of two key processes: the formation of AAO and thinning of the barrier layer, accompanied by complicated ion migration and interaction.3,34 Considering that chemical reactions can influence the anodization processes directly, summarizing the general chemical reactions which can occur in different electrolytes is significant for the controllable fabrication of various AAO. Herein, the aluminium anodization have been divided into three processes, and related general chemical reactions are shown as follows:7,16,28–33
(I): The moment at the beginning of the anodization processes. At this moment, there is not a sufficient thickness of the AAO formed on the anode, and an electrolytic reaction of water occurs.
| | | 4OH− → O2↑ + 2H2O + 4e− | (2) |
(II): The formation of the AAO. In this process, both alumina (Al2O3) and hydrated alumina (AlOOH or Al(OH)3) is formed.
| | | 2Al + 3O2− → Al2O3 + 6e− | (6) |
| | | 2Al(OH)3 → Al2O3 + 3H2O | (8) |
(III): Dissolution of the AAO. It has been known from former research that this process is acid-catalyzed (Al2O3 + 6H+ → 2Al3+ + 3H2O).28,35 However, during the anodization process, most of the H+ will be driven by the electrical field, gather near the cathode and then released in the form of hydrogen gas. As a result, not enough H+ exists at the bottom of the pores. Furthermore, Tsuchiya et al. found that regular porous AAO can also be fabricated in neutral electrolytes.36 Therefore, it can be concluded that the above acid-catalyzed dissolution reaction is not a general chemical reaction which occurs during aluminium anodization processes. Recently, Su et al. found that dissolution of the AAO can be ascribed to a hydrolytic process:7,16,32
| | | Al2O3 + nH2O → 2Al3+ + (3 + n − x)O2− + xOH− + (2n − x)H+ | (11) |
where n and x are introduced respectively to indicate the amount of water that dissociates and the OH− which can be produced per mole of Al2O3 that is dissolved at the same time. It is worth mentioning that the above chemical reactions can occur in aluminium anodization processes under different anodization conditions (e.g., anodization voltage, current density, electrolyte species and concentration), their complicated interactions can have a direct impact on the anodization processes and the as-prepared AAO.
3.2
i
a–time transients
3.2.1
i
a–time transients of MA processes.
Considering that the intrinsic mechanisms of aluminium anodization processes can be reflected by ia under constant-voltage mode, detailed investigation and analysis of the ia–time transients are necessary. The lower curve in Fig. 1 shows the typical ia–time transients of MA processes.17,34,35 It can be seen that the curve can be divided into four sections, corresponding to different stages during the aluminium anodization process. At the moment after applying the Ua, a sharp rise of the ia can be observed, which can be ascribed to the occurrence of a water-electrolytic process (Stage a, corresponding to reaction (1)–(5)). Immediately, a barrier layer starts to grow, resulting in a sharp drop of the ia under the constant-voltage mode (Stage b, corresponding to reaction (6)). At this stage, relatively fine-featured pathways can also be formed in the surface of the barrier layer prior to the true pore formation. As the anodization process conducts, some of the pathways continue to grow, thus forming pores and resulting in a rise of the ia (Stage c, corresponding to reaction (6)–(8), (11)). Finally, a relatively steady-state growth of the AAO can be realized due to the dynamic equilibrium of their forming and dissolving processes, corresponding to a relatively stable ia (Stage d, corresponding to reaction (6)–(8), (11)).
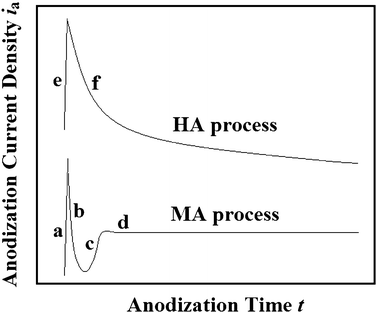 |
| | Fig. 1 Schematic curves of typical ia–time transients of MA (the lower curve) and HA (the upper curve) processes. | |
3.2.2
i
a–time transients of HA processes.
The upper curve in Fig. 1 shows the typical ia–time transients of HA processes, which can usually be divided into two stages: the voltage increasing stage (Stage e) and the constant-voltage stage (Stage f).17,25 It has been known that the HA processes usually have a higher target Ua, and breakdown phenomena will occur when the target Ua is applied directly. Therefore, a well-designed voltage increasing process is needed at the beginning of HA processes. It should be noted that the formation of the ia peak of HA process is quite different from that of MA process (Fig. 1). The latter can be reasonably elucidated by a water-electrolytic process, and the former may be ascribed to an electron avalanche process. During the anodization process, electrolyte species (e.g., specific acid anions, SO42− and C2O42−) will enter the AAO barrier layer as charged particles.28,29,37 As a consequence of the high electrical field, E (i.e., high Ua), some of the charged particles (e.g., acid anions SO42− or C2O42−) can be ionized, e.g. in a Poole–Frenkel mechanism, releasing primary electrons (i.e., primary electronic current density, ie0) into the oxide conduction band.28,37,38 Consequently, these electrons can be accelerated by the high E, thus producing avalanches by an impact ionization mechanism, and the avalanche electronic current density (ie) will grow exponentially and sharply (Stage e in Fig. 1, corresponding to reaction (6)–(11)), obeys the equation as follow:28,37| | | ie = ie0 exp(αd) = ie0 exp(αUd/E) ≈ ie0 exp(αUa/E) | (12) |
where α is the impact ionization coefficient which represents the number of times of impact ionization for an electron passing a distance of 1 cm, d is the barrier layer thickness of the AAO, and Ud is the voltage at the barrier layer (approximately equal to Ua). It worth mentioning that there is a reciprocal relationship between α and the mean free path λ of α = 1/λ, and the coefficient α will increase with the E.39 As the anodization conducts, a large number of acid anions in the barrier layer of the AAO are consumed by the avalanche process (eqn (12)), and the concentration of the acid anions at the bottom of the pores will decrease gradually due to the “diffusion limited effect” (Fig. 2).17 As a result, the acid anions in the barrier layer of the AAO are reduced, thus resulting in a decreased ie0. Considering that there is an exponential relationship in eqn (12), the ia–time transients will decrease exponentially (stage f in Fig. 1, corresponding to reaction (6)–(11)). In fact, compared with MA processes, HA processes which conduct with relatively higher Ua will better promote the ionization of the acid anions, thus resulting in smaller amounts of impure elements in the AAO. It was found by Lee et al. that the AAO fabricated by MA (40 V) and HA (110–150 V) processes have carbon element contents of 2.4 wt% and 1.8 wt% respectively, which further support the above argument.17 Moreover, it should be noted that the aluminium anodization will change from the MA process to the HA process when the avalanche phenomenon occurs.
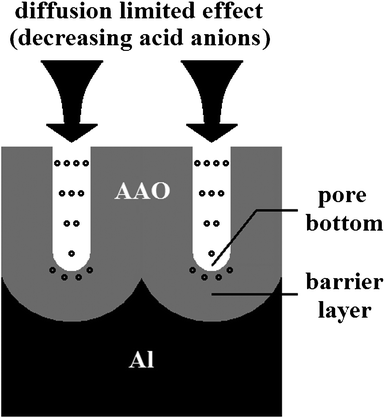 |
| | Fig. 2 Schematic drawing of the diffusion limited effect which occurs at the bottom of the AAO pores, and decreasing acid anions can thus be obtained. | |
3.3 The maximum Ua
3.3.1 Voltage applying processes.
As one of the most important microstructural parameters, the cell size (Dc) of the AAO will influence their performance directly in all the practical applications. Therefore, finding proper methods for the fabrication of AAO with a large-range tunable Dc has attracted much attention. It has been known that the Dc increases with the Ua,14,15,17,21–25 thus, applying a Ua as high as possible is an effective way for the fabrication of AAO with a large enough Dc. Considering that the voltage applying process can have a direct impact on the maximum Ua (Umax) which can be applied avoiding breakdown, different voltage applying processes have been performed under specific anodization conditions (e.g., Ua, electrolyte species and concentration).
(I): Applying the target Ua directly. This voltage applying process usually corresponds to a relatively lower Ua in the same electrolyte (MA processes). Under this Ua, the avalanche process can not be triggered. The ia will increase sharply at the beginning of the anodization process due to a water-electrolytic process, then decrease as the barrier layer thickens, and will be gradually stabilized through a self-regulated process (the lower curve in Fig. 1).17,34,35
(II): Increasing the Ua slowly. This voltage applying process usually corresponds to a relatively higher Ua in the same electrolyte (HA processes). In this case, a uniform layer of AAO should be formed on the surface of the aluminium sheet before the applying of the target Ua, thus avoiding the burning or breakdown phenomenon under a high ia.17,40 For example in 0.3 M oxalic acid electrolyte, a uniform porous AAO layer with a thickness of approximately 400 nm (barrier layer thickness, ∼50 nm) can be prefabricated on the surface of the aluminium sheet by performing the anodization process under 40 V for 8 min.17 Subsequently, the Ua is increased linearly and slowly to the high target value. Using this method, a relatively higher Ua of more than 150 V can be obtained.17 However, the breakdown phenomenon can still occur when an extremely high target Ua is applied. In fact, the ia is made up of ionic current density (ii) and electronic current density (ie), and the breakdown phenomenon will occur when the ie reaches a critical value.28,37,38 Therefore, using a constant-current voltage increasing process is an effective way to obtain a controllable ie, thus can avoid the breakdown phenomenon and obtain an extremely high Umax (e.g., more than 300 V in 0.3 M oxalic acid electrolyte).30 Using this method, AAO can be fabricated under a Ua of more than 500 V.24 The related voltage applying process is shown in Fig. 3.
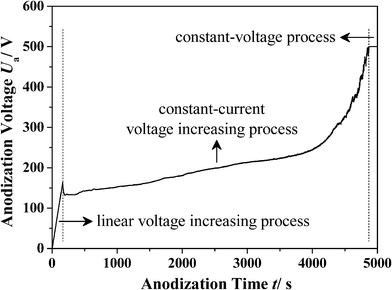 |
| | Fig. 3 The voltage applying process of AAO fabricated in an ethanol modified oxalic acid electrolyte (ethanol : 0.3 M oxalic acid = 1![[thin space (1/6-em)]](https://www.rsc.org/images/entities/char_2009.gif) : :![[thin space (1/6-em)]](https://www.rsc.org/images/entities/char_2009.gif) 2 v/v, −10 °C). It is made up of a linear voltage increasing process (1 V s−1), a constant-current voltage increasing process (300 A m−2), and a constant-voltage process (500 V). 2 v/v, −10 °C). It is made up of a linear voltage increasing process (1 V s−1), a constant-current voltage increasing process (300 A m−2), and a constant-voltage process (500 V). | |
3.3.2 The maximum Ua.
It has been known that the Ua in various electrolytes are quite different. For example, the most commonly used Ua in sulphuric acid, oxalic acid and phosphoric acid electrolytes with specific concentrations are 25 V, 40 V and 195 V, respectively.6,14,15,20 Although these voltage values can be increased to some extent by reducing the acid concentration, the actual effect of this method is very limited.21,41 Therefore, a relationship of Ua-sulphuric < Ua-oxalic < Ua-phosphoric can often be found during MA processes (i.e., the avalanche phenomenon does not occur). Considering that the Umax can influence the regulating range of AAO microstructural parameters directly, investigating intrinsic formation mechanisms of Umax in different electrolytes is very important.
During the anodization process, it is commonly accepted that the ionic current density (ii) can be further divided into oxidation current density (io) and incorporation current density (ic). The io corresponds to the inward migrating O2− and leads to the formation of aluminium oxides, while the ic comes from some contaminant species (e.g., acid anions) and makes no contribution to forming the oxides.28,37 Their relationship is shown in Fig. 4, and the corresponding equation can be written as follow:28,37
| | | ia = ii + ie = io + ic + ie = io + ic + ie0 exp(αd) | (13) |
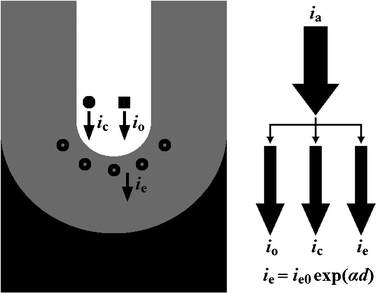 |
| | Fig. 4 Schematic drawing of the relationship among anodization current density (ia), oxidation current density (io), incorporation current density (ic), primary electronic current density (ie0), and avalanche electronic current density (ie). | |
where the ic is considered to be a constant fraction (γ) of the io (i.e., ic = γ io).28,37,42 Considering that the ie0 is dependent on the contaminant species (e.g., acid anions) as we mentioned before, the ie0 will be a definite fraction (η) of the ic (i.e., ie0 = η ic).28,37,42 According to the above discussion and eqn (12), the eqn (13) can be rewritten as follows:
| ia = io + ic + ie ≈ (1 + γ + γη exp(αUa/E)) io |
or
| | | ia ≈ (1/γ + 1 + η exp(αUa/E)) ic | (14) |
where, the γ and η are fractions determined respectively by the concentration of the electrolyte species in the oxide and by their ability to donate electrons.28,37,42 According to the traditional breakdown theory, the upper limit value of the avalanche ie avoiding breakdown can be calculated based on the condition that the ionization collision rate is less than or equal to the oxide formation rate, and the avalanche ie should be a fraction of the io (i.e., ie = z io, with z ≤ 1/3).37,43 From eqn (12) and (14), the condition of ie = z io leads to the following relationship for Umax and the breakdown voltage, Ub:
| |  | (15) |
During anodization processes, different types of acid anions (i.e., conjugate base anions) can be obtained for different electrolytes, e.g. sulphuric acid, oxalic acid and phosphoric acid electrolytes,35
| | | HSO4− → H+ + SO42− (Ka2 = 10−1.92, 25 °C) | (16) |
| | | HC2O4− → H+ + C2O42− (Ka2 = 10−4.27, 25 °C) | (17) |
| | | H2PO4− → H+ + HPO42− (Ka2 = 10−7.20, 25 °C) | (18) |
and these acid anions will enter the barrier layer of AAO, replacing O2− as substitution or contamination impurities in a certain depth.35,44 It can be seen from eqn (16)–(18) that their secondary dissociation ability (i.e., secondary dissociation constant, Ka2) are different: HSO4− > HC2O4− > H2PO4−. A higher Ka2 will correspond to more acid anions in the electrolyte, thus can obtain a higher ic. According to eqn (15), a smaller Umax and Ub can thus be obtained holding other anodization conditions unchanged. Using this argument, the commonly obtained result of Umax-sulphuric < Umax-oxalic < Umax-phosphoric can be reasonably explained. Moreover, it should be noted that the Umax and Ub can also be regulated by varying the concentration of the electrolyte. A lower concentration will lead to fewer acid anions and a smaller ic, thus can obtain a higher Umax and Ub. However, the regulating range of the Umax and Ub is quite narrow by using this method, since the varying of the concentration is negligible compared with the Ka2 (eqn (16)–(18)). It has been reported by Shingubara et al. that the Umax could only get a small increase from 27 V to 36 V, although an extremely diluted sulphuric acid electrolyte was used.41 This result further supports our above argument.
3.4 Modifying of the electrolyte
In previous studies, it was found that the Umax can be increased to some extent by modifying the electrolyte, e.g. adding a certain amount of ethanol,22–24,29 and the cooling effect is the main consideration for choosing ethanol as a modifying agent:23,26 (1) the temperature of the electrolyte can be reduced to below 0 °C by adding ethanol (freezing point, −114.3 °C), then the anodization can be performed under a relatively lower temperature, (2) the vaporization of ethanol (boiling point, 78.4 °C) will keep a lower temperature at the barrier layer of AAO.
However, the underlying intrinsic mechanisms of ethanol addition have rarely been reported. Based on our above arguments (e.g., eqn (15)) and related experimental results, the intrinsic functions of ethanol in the electrolyte can be concluded as follows: (1) the dissociation constant of the electrolyte is expected to be smaller with the addition of ethanol, then a relatively smaller ic can be obtained holding other conditions unchanged, thus leading to a higher Umax, (2) a lower temperature can be obtained at the barrier layer of AAO, then the ion diffusion ability will be reduced, thus resulting in fewer acid anions in the barrier layer, and a higher Umax can be realized.
Fig. 5 shows the evolution of Ua as a function of anodization time in the oxalic acid electrolyte system with different ethanol contents. For a comparative study, the same voltage increasing process (1 V s−1) has been used, and the maximum ia was restricted to 300 A m−2. It can be seen that the maximum Ua which can be applied before the current-limiting process for the electrolytes with different volume ratios (ethanol : 0.3 M oxalic acid) of 1/2, 1/3 and 0 are approximately 169 V (Umax-1), 115 V (Umax-2) and 89 V (Umax-3), respectively. Therefore, it can be concluded that the Umax will increase with the addition of ethanol, which further supports our arguments. Moreover, it can also be summarized that modification of the electrolyte should follow a general principle: the modified electrolyte should have a smaller dissociation constant.
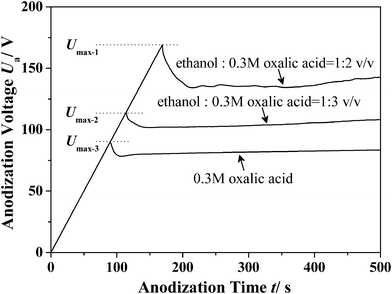 |
| | Fig. 5 The Ua–time transients of the anodization processes performed in the oxalic acid electrolyte system with different ethanol contents. The anodization processes are made up of a linear voltage increasing process (1 V s−1) and a constant-current process (300 A m−2). | |
3.5 Microstructural morphologies of AAO
Apparently, the microstructural morphologies and pore structures of AAO will influence their practical applications directly. Therefore, finding proper methods for the fabrication of AAO with controllable microstructures is significant. In recent years, some useful methods have been proposed. Lee et al. have successfully fabricated AAO films with complex microstructural morphologies using a pulse anodization method.45 Moreover, they and Losic et al. have modulated the pore structures of AAO by varying Ua or ia during the anodization processes.46,47 These methods and findings promote the practical applications of AAO to a large extent. It is commonly accepted that there are three representative microstructural morphologies of AAO, which can be obtained by varying the anodization conditions: continuous nanoporous film, smooth nanotubes, and nanotubes with wall thickness variations.6,14,17,21–27,29–31 In fact, the latter two morphologies can be further divided into two types: a gapless type and a gap type. The former has been achieved by many groups, but the latter has rarely been reported.21,24,25,29,30 Related schematic drawings and SEM images are shown in Fig. 6. It is interesting to see that there are apparent gaps between neighbouring tubes (Fig. 6 (a) and (c)) without additional chemical etching processes.
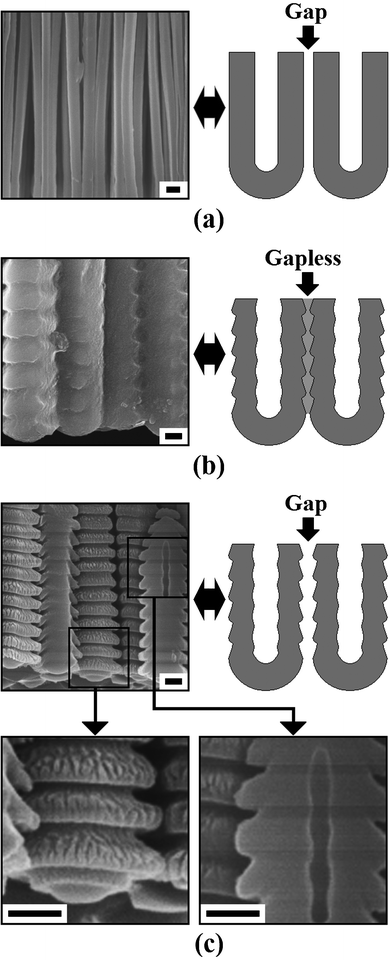 |
| | Fig. 6 Schematic drawings and SEM images of the AAO fabricated in an ethanol modified oxalic acid electrolyte (ethanol![[thin space (1/6-em)]](https://www.rsc.org/images/entities/char_2009.gif) : :![[thin space (1/6-em)]](https://www.rsc.org/images/entities/char_2009.gif) 0.3 M oxalic acid = 1 0.3 M oxalic acid = 1![[thin space (1/6-em)]](https://www.rsc.org/images/entities/char_2009.gif) : :![[thin space (1/6-em)]](https://www.rsc.org/images/entities/char_2009.gif) 2, v/v) under different anodization conditions: (a) obtained under a constant-current anodization process (500 A m−2), (b) and (c) obtained under a constant-voltage anodization process (500 V) with different ending ia of approximately 400 A m−2 and 55 A m−2, respectively. Scale bars = 300 nm. 2, v/v) under different anodization conditions: (a) obtained under a constant-current anodization process (500 A m−2), (b) and (c) obtained under a constant-voltage anodization process (500 V) with different ending ia of approximately 400 A m−2 and 55 A m−2, respectively. Scale bars = 300 nm. | |
To explain this unique phenomenon one may examine the corresponding ia–time transients (Fig. 7). It can be seen that the ia together with its oscillation amplitude decreases with anodization time.17,24,30 In recent years, Zhu et al. found that the formation of pores in AAO is dependent on the release of oxygen gas.48–50 Accordingly, the formation of the gaps shown in Fig. 6(a) and (c) may be ascribed to the coaction of the dehydration of aluminium hydroxide (e.g., Al(OH)3) and the aggregation of oxygen gas bubbles at the AAO cell junctions.24,28–30,48–51 It is believed that the decreasing ia will lead to a decreasing ie, and then the release of oxygen gas will be reduced (reaction (2) and (4)).28–30,48–50 Moreover, as the ie decreases, the heat generated by the anodization process will also reduce. Considering that the dehydration of aluminium hydroxide is endothermic, a smaller volume contraction of the AAO cell walls (i.e., tube walls) will be realized.24,29–31 As a result, the microstructural morphologies will change from gap type to gapless type under the coaction of the processes mentioned above (Fig. 6(b) and (c)).
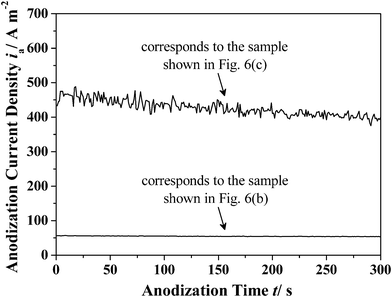 |
| | Fig. 7 The ia–time transients which correspond to the sample shown in Fig. 6(b) and Fig. 6(c), respectively. | |
Furthermore, it can be seen from the right partial enlarged image in Fig. 6(c) that the internal pore size of the as-prepared AAO is not constant, and a relatively regular modulated pore structure can be found along the axial direction. The mechanism of this phenomenon is expected to be a diffusion-controlled anodization of aluminium which has been reported and discussed in detail by Lee et al.52 Under the present anodization conditions (i.e., HA process at 500 V), the oxygen-containing anions at the bottom of the pores will be quickly depleted, and a certain degree of anion concentration gradient along the narrow pore channels may also be formed even with magnetic stirring. When a simple diffusion-controlled anodization process conducts, it has been known that the pore structures will exactly follow the details of the ia profile.52 It means that the relatively regular modulated pore structure shown in Fig. 6(c) will correspond to relatively regular oscillations of ia. However, its corresponding ia–time transients show irregular ia oscillations (Fig. 7). Therefore, in addition to the diffusion-controlled effect, there should be other processes occuring during anodization that can influence the ia–time transients. Based on our former reports, it is suggested that the formation and dehydration of aluminium hydroxide (e.g., Al(OH)3) will occur at the cell boundaries and the outer barrier layer of AAO during the high voltage anodization process.24,29,30 It has been reported that the formation and dehydration processes are accompanied by volume change, thus forming AAO tubes with continuously changed external diameter and barrier layer thickness which will influence the ia-time transients to a large extent under the constant-voltage mode with a high anodization voltage (the left partial enlarged image in Fig. 6(c)). Based on the above analysis and discussions, the coaction of diffusion-controlled anodization, and the formation and dehydration of aluminium hydroxide (e.g., Al(OH)3) is expected to be the origin of current oscillations shown in Fig. 7. Similar phenomena can also be observed during titanium anodization, which further confirms the similarity of valve metal anodization processes.53,54
In addition, the external diameter (De) of the AAO tubes (Fig. 6) can also be regulated and controlled by varying the ia and ie.29,51 Measurements show that the maximum De of the samples shown in Fig. 6(b) and (c) are approximately 1110 nm (55 A m−2) and 955 nm (400 A m−2), respectively. Accordingly, it can be concluded that the De and Dc will decrease with the increase of ia during the constant-voltage anodization processes.25,26,29,30 It worth mentioning that the AAO prepared under extremely high Ua (e.g., ≥ 500 V) usually show a relatively lower ordering and uniformity, compared with those fabricated via MA processes. For example, the AAO shown in Fig. 6(b) and (c) are uneven greyish green with a relatively non-uniform thickness.
Fig. 8 shows the fusiform AAO tubes fabricated during the constant-current voltage increasing process (500 A m−2). It was reported that different oscillation amplitudes of Ua can be obtained by varying the setting ia (e.g., 300 or 500 A m−2), thus forming AAO tubes with different microstructures.29 Repeated experiments indicate that although similar microstructures and phenomena can be found under the same anodization conditions, it is still not easy to accurately control the microstructure of the AAO tubes fabricated by simply using the constant-current anodization process since the Ua oscillations are relatively irregular.29 In recent years, Lee et al. have reported some effective methods on microstructural engineering of AAO,45,46,51e.g. AAO nanotubes with highly controllable microstructures have been fabricated by using a pulse anodization method with carefully designed ia.51 It is expected that their methods may also be applied in other electrolyte systems, i.e. fabricating AAO tubes with controllable diverse microstructural morphologies (e.g., fusiform or other shapes) by accurately designing and controlling the ia pulse or Ua pulse, which may have potential uses in many fields, such as drug carrier, slow release technique, sensors, etc.55–59
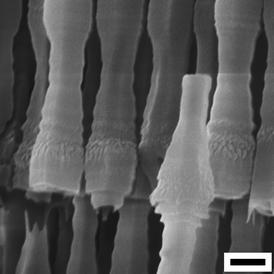 |
| | Fig. 8 AAO tubes with a unique fusiform microstructural morphology fabricated via a constant-current anodization process in an ethanol modified oxalic acid electrolyte (ethanol : 0.3 M oxalic acid = 1![[thin space (1/6-em)]](https://www.rsc.org/images/entities/char_2009.gif) : :![[thin space (1/6-em)]](https://www.rsc.org/images/entities/char_2009.gif) 2 v/v, −10 °C) with a constant ia (500 A m−2) and a fluctuating ie. Scale bar = 300 nm. 2 v/v, −10 °C) with a constant ia (500 A m−2) and a fluctuating ie. Scale bar = 300 nm. | |
4. Conclusions
In summary, the aluminium anodization processes have been studied in detail by analyzing the anodization current density (ia), and related findings are as follows. (1) The ia is made up of several parts which have different impacts on the anodization process. (2) The avalanche electronic current density (ie) is considered to be the main reason for the change from MA to HA. (3) Keeping a controllable ie is an effective way to avoid the breakdown phenomenon and obtain an extremely high anodization voltage (Ua). (4) The dissociation constant of the electrolyte can influence ie and the maximum Ua (Umax) directly, and a modified electrolyte with a smaller dissociation constant will correspond to a higher Umax. (5) The influences of ia and ie on the microstructural morphologies of AAO have also been analyzed, and a larger ie is considered an important factor for the morphology changing from a gapless to a gap type. Related investigations and arguments will enable the fabrication of AAO to be more controllable and predictable, and these findings may also be applied in other valve metal anodization processes.
Acknowledgements
This work was supported by The Project Supported by Guangdong Natural Science Foundation (S2011040005425), the Fundamental Research Funds for the Central Universities (2012ZZ0004) and the Doctoral Fund of Ministry of Education of China (20100172110011).
References
- F. Keller, M. S. Hunter and D. L. Robinson, J. Electrochem. Soc., 1953, 100, 411 CrossRef CAS.
- J. W. Diggle, T. C. Downie and C. W. Goulding, Chem. Rev., 1969, 69, 365 CrossRef CAS.
- J. P. O'Sullivan and G. C. Wood, Proc. R. Soc. London, Ser. A, 1970, 317, 511 CrossRef CAS.
- G. E. Thompson, R. C. Furneaux, G. C. Wood, J. A. Richardson and J. S. Goode, Nature, 1978, 272, 433 CrossRef CAS.
- G. E. Thompson and G. C. Wood, Nature, 1981, 290, 230 CrossRef CAS.
- H. Masuda and K. Fukuda, Science, 1995, 268, 1466 CAS.
- Z. X. Su, G. Hähner and W. Z. Zhou, J. Mater. Chem., 2008, 18, 5787 RSC.
- H. Masuda and M. Satoh, Jpn. J. Appl. Phys., 1996, 35, L126 CAS.
- R. O. Al-Kaysi and C. J. Bardeen, Chem. Commun., 2006, 1224 RSC.
- Y. Li, G. W. Meng and L. D. Zhang, Appl. Phys. Lett., 2000, 76, 2011 CrossRef CAS.
- L. Zhao, M. Yosef, M. Steinhart, P. Göring, H. Hofmeister, U. Gösele and S. Schlecht, Angew. Chem., Int. Ed., 2006, 45, 311 CrossRef CAS.
- G. Q. Ding, W. Z. Shen, M. J. Zheng and D. H. Fan, Appl. Phys. Lett., 2006, 88, 103 Search PubMed.
- Z. Y. Ling, S. S. Chen, J. C. Wang and Y. Li, Chin. Sci. Bull., 2008, 53, 183 CrossRef CAS.
- A. P. Li, F. Müller, A. Birner, K. Nielsch and U. Gösele, J. Appl. Phys., 1998, 84, 6023 CrossRef CAS.
- K. Nielsch, J. Choi, K. Schwirn, R. B. Wehrspohn and U. Gösele, Nano Lett., 2002, 2, 677 CrossRef CAS.
- Z. X. Su and W. Z. Zhou, J. Mater. Chem., 2011, 21, 357 RSC.
- W. Lee, R. Ji, U. Gösele and K. Nielsch, Nat. Mater., 2006, 5, 741 CrossRef CAS.
- T. Kyotani, W. H. Xu, Y. Yokoyama, J. Inahara, H. Touhara and A. Tomita, J. Membr. Sci., 2002, 196, 231 CrossRef CAS.
- H. Masuda, M. Ohya, K. Nishio, H. Asoh, M. Nakao, M. Nohtomi, A. Yokoo and T. Tamamura, Jpn. J. Appl. Phys., 2000, 39, L1039 CrossRef CAS.
- H. Masuda, F. Hasegwa and S. Ono, J. Electrochem. Soc., 1997, 144, L127 CrossRef CAS.
- S. Z. Chu, K. Wada, S. Inoue, M. Isogai and A. Yasumori, Adv. Mater., 2005, 17, 2115 CrossRef CAS.
- Y. B. Li, M. J. Zheng and L. Ma, Appl. Phys. Lett., 2007, 91, 073109 CrossRef.
- Y. Li, Z. Y. Ling, J. C. Wang, S. S. Chen, X. Hu and X. H. He, Chin. Sci. Bull., 2008, 53, 1608 CrossRef CAS.
- Y. Li, Z. Y. Ling, S. S. Chen, X. Hu and X. H. He, Chem. Commun., 2010, 46, 309 RSC.
- Y. Li, Z. Y. Ling, S. S. Chen and J. C. Wang, Nanotechnology, 2008, 19, 225604 CrossRef CAS.
- Y. B. Li, M. J. Zheng, L. Ma and W. Z. Shen, Nanotechnology, 2006, 17, 5101 CrossRef CAS.
- K. Schwirn, W. Lee, R. Hillebrand, M. Steinhart, K. Nielsch and U. Gösele, ACS Nano, 2008, 2, 302 CrossRef CAS.
- X. F. Zhu, Y. Song, L. Liu, C. Y. Wang, J. Zheng, H. B. Jia and X. L. Wang, Nanotechnology, 2009, 20, 475303 CrossRef.
- Y. Li, Z. Y. Ling, X. Hu, Y. S. Liu and Y. Chang, Chem. Commun., 2011, 47, 2173 RSC.
- Y. Li, Z. Y. Ling, X. Hu, Y. S. Liu and Y. Chang, J. Mater. Chem., 2011, 21, 9661 RSC.
- Z. X. Su and W. Z. Zhou, Adv. Mater., 2008, 20, 3663 CrossRef CAS.
- Z. X. Su, M. Bühl and W. Z. Zhou, J. Am. Chem. Soc., 2009, 131, 8697 CrossRef CAS.
- F. Le Coz, L. Arurault, S. Fontorbes, V. Vilar, L. Datas and P. Winterton, Surf. Interface Anal., 2010, 42, 227 CrossRef CAS.
- V. P. Parkhutik and V. I. Shershulsky, J. Phys. D: Appl. Phys., 1992, 25, 1258 CrossRef CAS.
- F. Y. Li, L. Zhang and R. M. Metzger, Chem. Mater., 1998, 10, 2470 CrossRef CAS.
- H. Tsuchiya, S. Berger, J. M. Macak, A. G. Muñoz and P. Schmuki, Electrochem. Commun., 2007, 9, 545 CrossRef CAS.
- J. M. Albella, I. Montero and J. M. Martínez-Duart, Electrochim. Acta, 1987, 32, 255 CrossRef CAS.
- I. Vrublevsky, A. Jagminas, J. Schreckenbach and W. A. Goedel, Electrochim. Acta, 2007, 53, 300 CrossRef CAS.
- J. M. Albella, I. Montero and J. M. Martínez-Duart, J. Electrochem. Soc., 1984, 131, 1101 CrossRef CAS.
- S. Ono, M. Saito and H. Asoh, Electrochem. Solid-State Lett., 2004, 7, B21 CrossRef CAS.
- S. Shingubara, K. Morimoto, H. Sakaue and T. Takahagi, Electrochem. Solid-State Lett., 2004, 7, E15 CrossRef CAS.
- J. M. Albella, I. Montero, J. M. Martínez-Duart and V. Parkhutik, J. Mater. Sci., 1991, 26, 3422 CrossRef CAS.
- S. Ikonopisov, Electrochim. Acta, 1977, 22, 1077 CrossRef CAS.
- K. Shimizu, K. Kobayashi, G. E. Thompson and G. C. Wood, Philos. Mag. A, 1992, 66, 643 CrossRef CAS.
- W. Lee, K. Schwirn, M. Steinhart, E. Pippel, R. Scholz and U. Gösele, Nat. Nanotechnol., 2008, 3, 234 CrossRef CAS.
- W. Lee and J. C. Kim, Nanotechnology, 2010, 21, 485304 CrossRef.
- D. Losic, M. Lillo and D. Losic Jr, Small, 2009, 5, 1392 CrossRef CAS.
- X. F. Zhu, L. Liu, Y. Song, H. B. Jia, H. D. Yu, X. M. Xiao and X. L. Yang, Monatsh. Chem., 2008, 139, 999 CrossRef CAS.
- X. F. Zhu, L. Liu, Y. Song, H. B. Jia, H. D. Yu, X. M. Xiao and X. L. Yang, Mater. Lett., 2008, 62, 4038 CrossRef CAS.
- X. L. Yang, X. F. Zhu, H. B. Jia and T. Han, Monatsh. Chem., 2009, 140, 595 CrossRef CAS.
- W. Lee, R. Scholz and U. Gösele, Nano Lett., 2008, 8, 2155 CrossRef CAS.
- W. Lee, J. C. Kim and U. Gösele, Adv. Funct. Mater., 2010, 20, 21 CrossRef CAS.
- J. M. Macak, H. Tsuchiya, L. Taveira, S. Aldabergerova and P. Schmuki, Angew. Chem., Int. Ed., 2005, 44, 7463 CrossRef CAS.
- A. Ghicov and P. Schmuki, Chem. Commun., 2009, 2791 RSC.
- H. Jha, F. Schmidt-Stein, N. K. Shrestha, M. Kettering, I. Hilger and P. Schmuki, Nanotechnology, 2011, 22, 115601 CrossRef.
- M. Sinn Aw, S. Simovic, J. Addai-Mensah and D. Losic, J. Mater. Chem., 2011, 21, 7082 RSC.
- B. C. Cheng, B. X. Tian, C. C. Xie, Y. H. Xiao and S. J. Lei, J. Mater. Chem., 2011, 21, 1907 RSC.
- G. S. Huang, X. L. Wu, F. Kong and Y. C. Cheng, Appl. Phys. Lett., 2006, 89, 073114 CrossRef.
- G. S. Huang, Y. Xie, X. L. Wu, L. W. Yang, Y. Shi, G. G. Siu and P. K. Chu, J. Cryst. Growth, 2006, 289, 295 CrossRef CAS.
|
| This journal is © The Royal Society of Chemistry 2012 |
Click here to see how this site uses Cookies. View our privacy policy here. ![[thin space (1/6-em)]](https://www.rsc.org/images/entities/char_2009.gif) :
:![[thin space (1/6-em)]](https://www.rsc.org/images/entities/char_2009.gif) 4, v/v) to diminish the roughness of their surface. Then the sheet was carefully washed and put into a tailor-made holder with a square area of 1 cm2 exposed to the electrolyte, and the heat was effectively removed using a copper plate which was in thermal contact with the aluminium sheet. Anodization processes were conducted in 0.3 M oxalic acid solution (Electrolyte I, 0–5 °C) and H2C2O4–C2H5OH–H2O mixture solution (ethanol
4, v/v) to diminish the roughness of their surface. Then the sheet was carefully washed and put into a tailor-made holder with a square area of 1 cm2 exposed to the electrolyte, and the heat was effectively removed using a copper plate which was in thermal contact with the aluminium sheet. Anodization processes were conducted in 0.3 M oxalic acid solution (Electrolyte I, 0–5 °C) and H2C2O4–C2H5OH–H2O mixture solution (ethanol![[thin space (1/6-em)]](https://www.rsc.org/images/entities/char_2009.gif) :
:![[thin space (1/6-em)]](https://www.rsc.org/images/entities/char_2009.gif) Electrolyte I = 1
Electrolyte I = 1![[thin space (1/6-em)]](https://www.rsc.org/images/entities/char_2009.gif) :
:![[thin space (1/6-em)]](https://www.rsc.org/images/entities/char_2009.gif) 2, 1
2, 1![[thin space (1/6-em)]](https://www.rsc.org/images/entities/char_2009.gif) :
:![[thin space (1/6-em)]](https://www.rsc.org/images/entities/char_2009.gif) 3 v/v, −10 °C), respectively, with vigorous magnetic stirring. A powerful low temperature bath, together with an electrolysis cell (1 L) was applied to maintain the low temperatures required for anodization. In addition, an improved voltage increasing process was performed in the oxalic acid electrolytes: (1) the anodization voltage (Ua) was increased at a rate of 1 V s−1 until the anodization current density (ia) reached the setting value (300 or 500 A m−2), (2) a constant-current process was applied, by which the Ua can be smoothly increased to the high target value, (3) the anodization was conducted at a designated Ua with a constant-voltage mode. The residual aluminium was removed using a saturated CuCl2 solution: (1) CuCl2·2H2O of 390 g was dissolved into 300 ml de-ionized water under 50 °C, then the temperature of the solution was reduced to 30 °C, and a saturated CuCl2 solution could be obtained, (2) the samples were put into a porous plastic cup, and then immersed into the as-prepared saturated CuCl2 solution with vigorous magnetic stirring under 30 °C for 2 min to remove the residual aluminium. The microstructural morphologies of the as-prepared specimens were examined by a field-emission scanning electron microscope (FE-SEM: LEO 1530 VP). The anodization voltage and current were measured by multimeters (Keithley 2010 and 2410).
3 v/v, −10 °C), respectively, with vigorous magnetic stirring. A powerful low temperature bath, together with an electrolysis cell (1 L) was applied to maintain the low temperatures required for anodization. In addition, an improved voltage increasing process was performed in the oxalic acid electrolytes: (1) the anodization voltage (Ua) was increased at a rate of 1 V s−1 until the anodization current density (ia) reached the setting value (300 or 500 A m−2), (2) a constant-current process was applied, by which the Ua can be smoothly increased to the high target value, (3) the anodization was conducted at a designated Ua with a constant-voltage mode. The residual aluminium was removed using a saturated CuCl2 solution: (1) CuCl2·2H2O of 390 g was dissolved into 300 ml de-ionized water under 50 °C, then the temperature of the solution was reduced to 30 °C, and a saturated CuCl2 solution could be obtained, (2) the samples were put into a porous plastic cup, and then immersed into the as-prepared saturated CuCl2 solution with vigorous magnetic stirring under 30 °C for 2 min to remove the residual aluminium. The microstructural morphologies of the as-prepared specimens were examined by a field-emission scanning electron microscope (FE-SEM: LEO 1530 VP). The anodization voltage and current were measured by multimeters (Keithley 2010 and 2410).


![[thin space (1/6-em)]](https://www.rsc.org/images/entities/char_2009.gif) :
:![[thin space (1/6-em)]](https://www.rsc.org/images/entities/char_2009.gif) 2 v/v, −10 °C). It is made up of a linear voltage increasing process (1 V s−1), a constant-current voltage increasing process (300 A m−2), and a constant-voltage process (500 V).
2 v/v, −10 °C). It is made up of a linear voltage increasing process (1 V s−1), a constant-current voltage increasing process (300 A m−2), and a constant-voltage process (500 V).


![[thin space (1/6-em)]](https://www.rsc.org/images/entities/char_2009.gif) :
:![[thin space (1/6-em)]](https://www.rsc.org/images/entities/char_2009.gif) 0.3 M oxalic acid = 1
0.3 M oxalic acid = 1![[thin space (1/6-em)]](https://www.rsc.org/images/entities/char_2009.gif) :
:![[thin space (1/6-em)]](https://www.rsc.org/images/entities/char_2009.gif) 2, v/v) under different anodization conditions: (a) obtained under a constant-current anodization process (500 A m−2), (b) and (c) obtained under a constant-voltage anodization process (500 V) with different ending ia of approximately 400 A m−2 and 55 A m−2, respectively. Scale bars = 300 nm.
2, v/v) under different anodization conditions: (a) obtained under a constant-current anodization process (500 A m−2), (b) and (c) obtained under a constant-voltage anodization process (500 V) with different ending ia of approximately 400 A m−2 and 55 A m−2, respectively. Scale bars = 300 nm.

![[thin space (1/6-em)]](https://www.rsc.org/images/entities/char_2009.gif) :
:![[thin space (1/6-em)]](https://www.rsc.org/images/entities/char_2009.gif) 2 v/v, −10 °C) with a constant ia (500 A m−2) and a fluctuating ie. Scale bar = 300 nm.
2 v/v, −10 °C) with a constant ia (500 A m−2) and a fluctuating ie. Scale bar = 300 nm.