DOI:
10.1039/C2RA01042A
(Paper)
RSC Adv., 2012,
2, 2553-2561
Macroscopic and microscopic Li+ transport parameters in cubic garnet-type “Li6.5La2.5Ba0.5ZrTaO12” as probed by impedance spectroscopy and NMR
Received
7th November 2011
, Accepted 1st December 2011
First published on 7th February 2012
Abstract
The garnet-type “Li6.5La2.5Ba0.5ZrTaO12”, crystallizing with cubic symmetry was prepared according to a conventional solid state synthesis method using metal oxides and salt precursors of high purity. The formation of the “single-phase” garnet-type structure was studied by powder X-ray diffraction (PXRD). Electron microprobe analysis (EMPA) coupled with a wavelength-dispersive spectrometer (WDS) showed a rather homogeneous distribution of Ta ions and Zr ions compared to that of Ba ions and La ions in “Li6.5La2.5Ba0.5ZrTaO12”. Li ion dynamics were complementarily studied using variable-temperature AC-impedance spectroscopy and 7Li NMR measurements. The bulk (ion) conductivities probed are in very good agreement with results reported earlier, illustrating the excellent reproducibility of the Li transport properties of “Li6.5La2.5Ba0.5ZrTaO12”. In particular, AC impedance and NMR results indicate that the Li transport process studied is of long-range nature. Finally, the chemical compatibility of the electrolyte “Li6.5La2.5Ba0.5ZrTaO12” was tested with Li2FeMn3O8, being a high-voltage cathode material. As shown by variable-temperature PXRD measurements, the garnet-type structure (bulk) was found to be stable up to 673 K.
1. Introduction
Rechargeable lithium-ion batteries are considered powerful energy storage systems.1–3 Compared to lead–acid, Ni–Cd or Ni–metal-hydride batteries, for example, commercially available lithium-ion batteries are characterized by a much higher energy density of 650 Wh l−1 and 150 Wh kg−1.1 Therefore, lithium-ion cells are increasingly used in various portable electronic devices more and more in our daily life. In addition, secondary Li–ion batteries of larger scale are being developed for hybrid electric vehicles, combining an internal combustion engine.1,2 Certainly, this is driven by the rapid depletion of fossil fuels and growing environmental concerns. The realisation of electric powered vehicles undoubtedly requires the development and investigation of new clean energy storage materials. These are needed to further improve the storage capacity, safety and rate (power) capability of lithium-ion batteries, the most promising energy storage systems in the medium run.
Currently, most conventional lithium-ion batteries utilize an organic polymer electrolyte in combination with a conducting salt such as LiPF6. However, these systems suffer from poor chemical as well as electrochemical stability resulting in manifold limitations for high power density applications. Accordingly, the fabrication of completely solid state lithium-ion batteries with electrochemically stable electrolytes which have high ionic but negligible electronic conductivity appears to be the best solution to overcome the challenges that materials scientists are faced with.2–5 For example, several solid Li electrolytes based on lithium phosphorous oxynitride (LIPON) (2.3 × 10⁻⁶ S cm−1, Ea = 0.55 (± 0.02) eV), sodium superionic conducting (NASICON) phosphates (e.g., LiTi2P3O12 (2 × 10⁻⁶ S cm−1, Ea = 0.30 eV at 300–470 K), A-site deficient perovskite-type oxides (e.g., (La(2/3)−xLi3x□(1/3)−2xTiO3) (10−3 S cm−1 (bulk) Ea = 0.40 eV) as well as silicates (e.g., Li4SiO4 10−6 S cm−1 at approximately 330 K, Ea = 0.83 eV) have been investigated for this purpose.2–9 The room temperature bulk ionic conductivity of most known solid electrolytes ranges from 10−6 to 10−3 S cm−1, while the total ionic conductivity, which is the sum of the bulk and grain-boundary conductivity, in many cases turns out to be a few orders of magnitude lower. Certainly, the values mentioned above depend somewhat on the synthesis methods used. However, in many cases even fast ion conductors offer several problems that limit their use in a lithium-ion battery. For example, the electrochemical instability of Ti–based materials such as La(2/3)−xLi3x□(1/3)−2xTiO3 is a disadvantage when the material is intended to be used as a solid electrolyte.5,6,9,10 Thus, new lithium conducting compounds are urgently needed to meet the requirements for completely solid state lithium-ion batteries fulfilling both a sufficient stability and high energy density. In particular, a thorough understanding of their Li+ transport as well as diffusion properties is expected to be of help for further advancements in clean energy storage research.
Recently, garnet-type10oxides with the nominal chemical compositions Li5La3M2O12 (M = Nb, Ta, Sb), Li6La2AM2O12 (A = earth alkaline) and Li7La3Zr2O12 have been developed and studied for this purpose. Until now, chemical compositions, crystal structures, and ionic conductivities of many Li–conducting garnets have been investigated in detail by several groups.10–22 For example, Li6La2BaTa2O12 is reported to show an electrochemical stability as high as 6 V Li−1. Some of these garnets, such as the cubic polymorph of Li7La3Zr2O12, are characterized by an extraordinary high ionic (bulk) conductivity of approximately 10−4 S cm−1 at ambient temperature13,17a making its use in an all-solid state battery feasible. For comparison, the ionic conductivity of the tetragonal phase of Li7La3Zr2O12 was found to be two orders of magnitude lower than that of the cubic modification.18 However, less is known about the details of the conduction mechanisms of Li containing oxide garnets. Complementary impedance spectroscopy measurements and NMR studies might help understand the correlation between crystal structure and Li transport properties. Quite recently, we used variable-temperature NMR spin–lattice relaxation and conductivity measurements to investigate the Li ion dynamics of phase-pure Li7La3Zr2O12 crystallizing with a tetragonal symmetry.21 In the present contribution these investigations are extended to another garnet-like oxide, viz Li6.5La2.5Ba0.5ZrMO12 (M = Nb, Ta), whose bulk conductivity15 is reported to be comparable with those of, e.g., the cubic modification of Li7La3Zr2O12 and Li6BaLa2Ta2O12. Even though the garnet Li6.5La2.5Ba0.5ZrMO12 is well studied in terms of electrical conductivity, less information is available on Li transport parameters which were probed on different time scales. Here, a combination of several techniques such as variable-temperature 7Li NMR spectroscopy, low-temperature AC-impedance measurements as well as electron microprobe analyses are used to characterize structural and dynamic properties of a single-phase sample of polycrystalline “Li6.5La2.5Ba0.5ZrTaO12”.
2. Experimental
The compound with the nominal chemical composition “Li6.5La2.5Ba0.5ZrTaO12” was prepared by a conventional solid state synthesis method (ceramic method). The precursors used for the synthesis were LiNO3 (99%, Alfa Aesar) La2O3 (99.99%, Alfa Aesar, pre-heated at 1073 K for 24 h), Ba(NO3)2 (AR grade, BDH), ZrO2 (99%, Alfa Aesar) and Nb2O5 (99.5%, Alfa Aesar). LiNO3 was added in 10 wt% excess to avoid the loss of lithium during the high temperature sintering process. Stoichiometric amounts of the precursors were ball-milled at 200 rpm for 12 h in 2-propanol (Pulverisette ball mill, Fritsch, Germany). Then the mixture was heated for 6 h at 973 K. The resultant powder was ball-milled again to ensure homogenous mixing and then pressed into pellets (Isostatic press, P. O. Weber, Germany). After that the pellets were covered with the mother powder and sintered for 6 h at 1373 K in a clean alumina crucible. The formation of the cubic phase was verified by powder X-ray diffraction (PXRD) using a Bruker D8 diffractometer (Cu-Kα, 40 kV, 40 mA). Electron microprobe analysis (EMPA) (Electron Probe Microanalyser, JEOL JXA-8200) coupled with a wavelength-dispersive spectrometer (WDS) was used to characterize morphology and composition (elemental mapping) of the samples. EMPA was carried out under vacuum at an excitation voltage of 15 kV and a current of 11.51 nA. For the electrical conductivity measurements, which were performed in air atmosphere, a Solartron SI 1260 impedance (and gain-phase) analyzer was used (frequencies ranged from 0.01 Hz to 10 MHz). Prior to the impedance measurements the pellets were cut into small discs using a diamond cutter (Buehler, Isomet 5000). Gold electrodes were pasted on both sides of the pellets and cured for 1 h at 873 K in air.
Variable-temperature 7Li nuclear magnetic resonance (NMR) spectra were recorded using an Avance III NMR spectrometer (Bruker BioSpin, Rheinstetten) in combination with a shimmed 7 T cryomagnet (Bruker). The resonance frequency was ω0/2π = 117 MHz. NMR spectra were acquired with the help of a one-pulse sequence. The recycle delay between each scan was at least 5 T1 where T1 is the spin–lattice relaxation time in the laboratory frame of reference. NMRT1 times were recorded with the saturation recovery pulse sequence: a comb of closely spaced 90° pulses destroys longitudinal magnetization and its recovery is probed as a function of delay time with a single detection pulse. A 6Li magic angle spinning (MAS) NMR spectrum was recorded at 88 MHz using an Avance 600 Bruker NMR spectrometer connected to a cryomagnet with a nominal field of 14.1 T. We used a standard 2.5 mm MAS NMR probe which was operated at a spinning speed of 30 kHz. Additionally, with the same equipment a 27Al MAS NMR spectrum was recorded which has been referenced to aqueous Al(NO3)3.
Finally, the chemical stability of “Li6.5La2.5Ba0.5ZrTaO12” with respect to a high-voltage cathode material such as Li2FeMn3O8 was tested by heating a mixture of “Li6.5La2.5Ba0.5ZrTaO12” and Li2FeMn3O8 (1![[thin space (1/6-em)]](https://www.rsc.org/images/entities/char_2009.gif) :1 wt% ratio) at 473 K, 673 K and 873 K for 24 h. PXRD measurements were carried out directly after heat treatment.
:1 wt% ratio) at 473 K, 673 K and 873 K for 24 h. PXRD measurements were carried out directly after heat treatment.
3. Results and discussion
3.1 Structural characterization
The PXRD pattern of Fig. 1 clearly shows the formation of cubic “Li6.5La2.5Ba0.5ZrTaO12”. In Table 1 the corresponding indexed PXRD data are listed; most of the peaks could be indexed according to the cubic garnet-like parent Li5La3Nb2O12 crystallizing with the space groupIa-3d.11–16,23 The cell constant a is 12.764(3) Å which is comparable to the values reported in the literature.15 However, there are some impurity peaks which could be attributed to Al2O3, Ba6ZrTa4O18, BaZrO3, and Ba0.44TaO2.94. They are marked in the selected area PXRD (see Fig. 1 (c)); the major diffractions peaks of these impurity phases are given in Table 2. As well as the separate phases, the incorporation of Al into the garnet structure, which has also been observed in the synthesis of garnet-type Li7La3Zr2O12 quite recently,19 is indicated by the 27Al MAS NMR spectrum shown in Fig. 2. The high-resolution NMR spectrum is composed of several lines at the isotropic chemical shifts (δiso) indicated. While the δiso values at around 15 ppm point to octahedrally coordinated Al ions, chemical shifts larger than 70 ppm can usually be attributed to tetrahedrally coordinated Al. Besides, Al is present in the various separate impurity phases mentioned above, most likely Al cations also occupy multiple sites in the garnet-type structure. In particular, the NMR intensities with peaks at 78 and 81 ppm might reflect Al ions in tetrahedral sites. Additional deshielding (cf. the signal located at 93 ppm) might result from cation vacancies in the direct neighbourhood of the Al ions. It can also be an indication of Al ions residing in dodecahedral cages present in the garnet-type structure. For comparison with chemical shifts of known Al–containing oxides (and hydroxides), the NMR line of α–Al2O3 usually produces a single line with a chemical shift value in the range from 13 to 17 ppm, while the NMR lines of θ–Al2O3, which has an equal number of octahedral and tetrahedral sites, are reported to be centered at 11(1) and 80(1) ppm.20 Note that the NMR line of γ–AlOOH (boehmite), which transforms into γ–Al2O3 (signals at 12 and 70 ppm) and α–Al2O3 at sufficiently high temperatures, usually shows up between 5 and 9 ppm.20 Interestingly, NMR intensities located in the range from 75 to 85 ppm are also visible in the 27Al NMR spectrum of Al–doped Li7La3Zr2O12 discussed in detail by Geiger et al.19
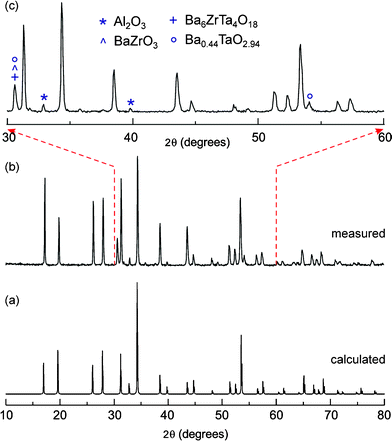 |
| | Fig. 1
Powder X-ray diffraction pattern of (a) the calculated PXRD pattern of cubic Li5La3Nb2O12 (a = 12.80654(11) Å; space group Ia-3d,23 (b) “Li6.5La2.5Ba0.5ZrTaO12” prepared by conventional solid-state synthesis and (c) selected range of the measured PXRD pattern showing the potential impurity phases present. | |
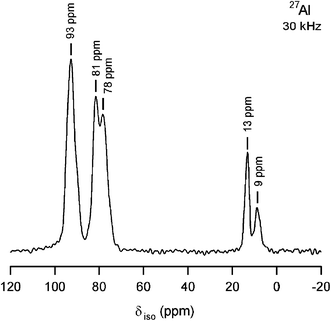 |
| | Fig. 2
27Al MAS NMR spectrum (306 K) of “Li6.5La2.5Ba0.5ZrTaO12” prepared in an Al2O3 crucible at 1373 K. The spectrum was recorded at 14.1 T using an MAS rotation frequency of 30 kHz. | |
Table 1 Indexed parameters obtained from the analyses of the PXRD pattern of “Li6.5La2.5Ba0.5ZrTaO12”
|
h
|
k
|
l
|
d
obs. (Å) |
d
cal. (Å) |
I
obs. (%) |
| 2 |
1 |
1 |
5.151 |
5.211 |
93 |
| 2 |
2 |
0 |
4.480 |
4.513 |
52 |
| 3 |
2 |
1 |
3.405 |
3.411 |
69 |
| 4 |
0 |
0 |
3.184 |
3.191 |
72 |
| 4 |
2 |
0 |
2.856 |
2.854 |
93 |
| 3 |
3 |
2 |
2.720 |
2.721 |
10 |
| 4 |
2 |
2 |
2.609 |
2.605 |
100 |
| 5 |
2 |
1 |
2.336 |
2.330 |
46 |
| 6 |
1 |
1 |
2.077 |
2.071 |
43 |
| 6 |
2 |
0 |
2.028 |
2.018 |
14 |
| 6 |
3 |
1 |
1.892 |
1.882 |
10 |
| 4 |
4 |
4 |
1.850 |
1.842 |
6 |
| 5 |
5 |
1 |
1.781 |
1.787 |
23 |
| 7 |
2 |
0 |
1.748 |
1.753 |
19 |
| 6 |
4 |
2 |
1.716 |
1.706 |
73 |
| 6 |
5 |
0 |
1.633 |
1.634 |
13 |
| 8 |
0 |
0 |
1.607 |
1.596 |
16 |
| 8 |
2 |
1 |
1.537 |
1.537 |
6 |
| 6 |
6 |
0 |
1.516 |
1.504 |
7 |
| 6 |
6 |
2 |
1.468 |
1.464 |
6 |
| 8 |
3 |
2 |
1.452 |
1.455 |
6 |
| 7 |
5 |
2 |
1.439 |
1.445 |
18 |
| 9 |
1 |
1 |
1.404 |
1.401 |
14 |
| 7 |
6 |
0 |
1.388 |
1.384 |
9 |
| 7 |
6 |
1 |
1.372 |
1.376 |
17 |
| 8 |
5 |
2 |
1.328 |
1.324 |
8 |
| 9 |
3 |
2 |
1.313 |
1.317 |
6 |
| 10 |
1 |
0 |
1.274 |
1.270 |
5 |
| 10 |
1 |
1 |
1.264 |
1.264 |
5 |
| 10 |
2 |
2 |
1.229 |
1.228 |
8 |
|
a = 12.764(3) Å |
Table 2 List of possible impurity phases that can be observed in the powder XRD pattern of “Li6.5La2.5Ba0.5ZrTaO12”
| Compound |
Symmetry |
Space group (No.) |
JCPDSa Card No. |
Characteristics Diffraction lines 2θ/degrees |
Intensity (%) |
Symbol in Fig. 1 |
|
Joint Committee on Powder Diffraction Standards (JCPDS)
|
|
θ–Al2O3 |
Monoclinic |
C2/m (12) |
01-086-1410 |
32.8 |
100 |
* |
|
C2/m (12) |
00-023-1009 |
39.8 |
62 |
* |
|
A2/m (12) |
00-009-0440 |
|
Ba6ZrTa4O18 |
Rhombohedral |
R-3m (166) |
00-044-0563 |
30.6 |
100 |
+ |
|
BaZrO3 |
Cubic |
Pm-3m (221) |
01-089-2486 |
30.5 |
100 |
ˆ |
| |
|
|
|
43.6 |
54 |
ˆ |
| Ba0.44TaO2.94 |
Hexagonal |
P-62m (189) |
00-017-0795 |
30.7 |
100 |
o |
| |
|
|
|
54.1 |
67 |
o |
Elemental mapping of a large area (in the order of several hundred of micrometre squares) of garnet-type “Li6.5La2.5Ba0.5ZrTaO12” prepared at 1373 K is shown in Fig. 3. Let us note that the potential loss of Li during preparation was compensated by adding about 10 wt% excess of LiNO3. This is a common procedure to prepare Li–containing garnets via solid-state (ceramic) synthesis routes.10–16 Irrespective of a slight contamination of the garnet phase with Al ions (Figures 1 and 2), the electron microprobe analysis (EPMA) coupled with a wavelength-dispersive spectrometer (WDS) showed a rather homogeneous distribution of Ta ions and Zr ions compared to that of Ba ions and La ions in “Li6.5La2.5Ba0.5ZrTaO12”.
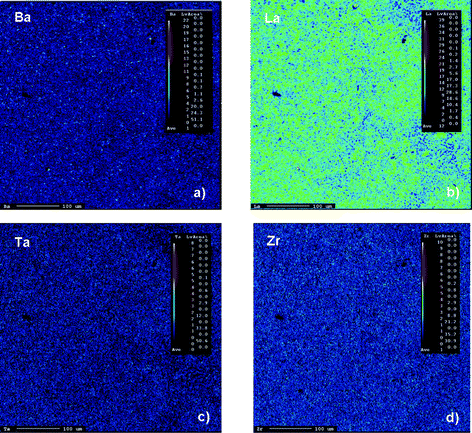 |
| | Fig. 3 Typical elemental mapping analysis of polycrystalline “Li6.5La2.5Ba0.5ZrTaO12” prepared by conventional solid state synthesis: (a) Ba, (b) La, (c) Ta and (d) Zr mapping. | |
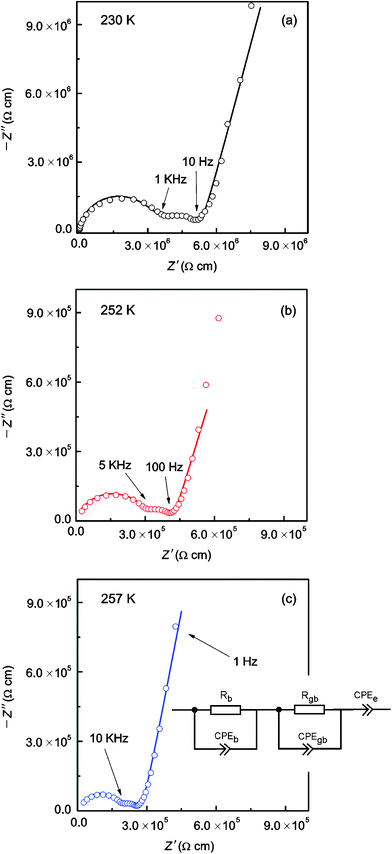 |
| | Fig. 4 Typical AC-impedance plots of “Li6.5La2.5Ba0.5ZrTaO12” which were recorded at (a) 230 K, (b) 252 K, and (c) 257 K. Solid lines show fits using the equivalent circuit shown in (c). See text for further details. Bulk, grain boundary and electrode responses can be well separated. | |
Table 3 Fitting results of the analysis of the AC-impedance data (Fig. 4 (a) to (c)) by using suitable equivalent circuit elements (see the inset of Fig. 4 (c))
|
T (K) |
R
b (Ω) |
CPE
b (F) |
n
b
|
C
b (F) |
R
gb (Ω) |
CPE
gb (F) |
n
gb
|
C
gb (F) |
CPE
el (F) |
n
el
|
χ
2
|
| 230 |
8.95 × 10⁵ |
4.62 × 10⁻¹¹ |
0.90 |
1.52 × 10⁻¹¹ |
6.04 × 10⁵ |
1.83 × 10⁻⁸ |
0.65 |
1.49 × 10⁻⁹ |
5.28 × 10⁻⁷ |
0.83 |
3 × 10⁻³ |
| 252 |
8.64 × 10⁴ |
2.81 × 10⁻¹⁰ |
0.79 |
1.59 × 10⁻¹¹ |
3.18 × 10⁴ |
4.50 × 10⁻⁸ |
0.74 |
4.55 × 10⁻⁹ |
9.30 × 10⁻⁷ |
0.81 |
9 × 10⁻⁴ |
| 257 |
3.56 × 10⁴ |
7.91 × 10⁻¹¹ |
0.91 |
2.23 × 10⁻¹¹ |
4.68 × 10⁴ |
4.29 × 10⁻⁷ |
0.38 |
7.34 × 10⁻¹⁰ |
8.83 × 10⁻⁷ |
0.88 |
4 × 10⁻⁴ |
| |

| (1) |
where the angular frequency is given by
ω = 2π ×
f (
f denotes the technical frequency).
j is equal to

,
n is an empirical parameter which can take any arbitrary value between 0 and 1.
Q has the numerical value of the admittance

at
ω = 1 rad s
−1. Accordingly, the capacitance which can be associated with the
CPE was calculated using the expression:
24| |  | (2) |
Here, the parameter n was found to be close to one, i.e., C ≈ Q. While the capacitance C for the high-frequency semicircle turned out to be in the order of 10−11 F, the semicircle showing up at intermediate frequencies is characterized by a capacitance ranging from 10−10 to 10−9 F (see Table 3). These values are typical for capacitances which can be ascribed to bulk and grain-boundary contributions in ion conducting ceramic materials.25,26 Let us mention that the quality of the fits performed, expressed by the parameter χ2 (see Table 3), increases with increasing temperature. As expected, the bulk resistance decreases with increasing T, clearly indicating a thermally-activated electrical relaxation process.
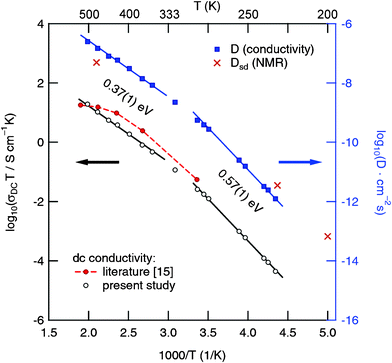
For comparison, typical impedance spectra, which are obtained by plotting the real part σ of the complex conductivity vs ω, are shown in Fig. 5 (a). Depending on temperature, in the range from 103 to 106 Hz the spectra reveal an almost frequency independent conductivity plateau. Polarization effects due to ion blocking electrodes show up when ω is smaller than approximately 102 Hz and temperatures ranging from 297 K to 357 K are regarded (Fig. 5). At the highest frequencies the beginning of a dispersive AC-conductivity region can be seen. σ(ω) seems to follow a power law behaviour according to, 27–34
where
σ(0) denotes the so-called “DC-conductivity” and
p the power law exponent which, in most cases, shows values between 0.6 and 0.8.
27–34 The corresponding complex plane plots are presented in
Fig. 5 (b). Arrows mark the frequency range used for the power law fits which are shown in
Fig. 5 (a) by solid lines. Fitting parameters are provided in
Table 4. Since the dispersive region was only partly accessible due to experimental limitations, the power law exponents have to be regarded as rough estimations. Nevertheless, the values obtained are in agreement with results which can be found in the literature, particularly with those which have been reported for structurally disordered materials.
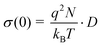
32–34 In the Arrhenius plot of
Fig. 6 the
σ(0) values are shown together with conductivity data which were taken from previous impedance studies. Above 330 K the DC-conductivities,
σ(0), obey an Arrhenius law characterized by an activation energy,
Ea, of approximately 0.34 eV which is consistent with results reported in the literature for other garnet-type electrolytes. Below 300 K the activation energy increases which might indicate a change of the conduction mechanism.
10–17 For comparison, the garnets Li
7La
3Zr
2O
12 (cubic modification), Li
6BaLa
2Ta
2O
12, Li
6BaLa
2Nb
2O
12, Li
5.5La
3Nb
1.75In
0.25O
12 and Li
5La
3Nb
2O
12 show
activation energies of 0.31, 0.40, 0.44, 0.51 and 0.43 eV, respectively.
10,13,15,17
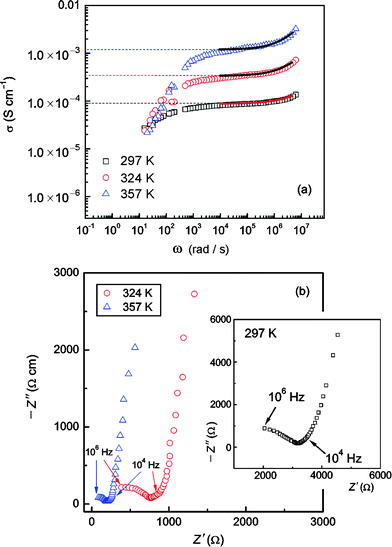 |
| | Fig. 5 (a) Impedance spectra of “Li6.5La2.5Ba0.5ZrTaO12” measured at the temperatures indicated. Prior to the measurements the polycrystalline sample was sintered at 1373 K in air. Solid lines in (a) represent a rough analysis of the data using a power law expression (see eqn (3) and Table 3), (b) Corresponding impedance plots of the data shown in (a). The frequency range used for the power law fit is marked by arrows. | |
 |
| | Fig. 6 Temperature dependence of σDCT (as well as D calculated according to eqn (4)) for polycrystalline “Li6.5La2.5Ba0.5ZrTaO12”. Solid lines represent fits using an Arrhenius law, σDCT ∝ exp(–Ea/(kBT)). For comparison, self-diffusion coefficients estimated from 7Li NMR spectroscopy are also included. See text for further details. | |
Table 4 DC-conductivity values of “Li6.5La2.5Ba0.5ZrTaO12” which were obtained from the frequency-independent plateaus (104 to 106 Hz) of the impedance spectra shown in Fig. 4 (a). For comparison, data from other ion conductors, partly showing very high ion conductivity, are also listed
| solid electrolyte |
T (K) |
σ
0 (S cm−1) |
p
|
E
a (eV) |
reference |
| “Li6.5La2.5Ba0.5ZrTaO12” |
297 |
9.0 × 10⁻⁵ |
≈ 0.67 |
0.57(1) (220 to 290 K) |
present work |
| 324 |
3.2 × 10⁻⁴ |
≈ 0.76 |
0.37(1) (330 to 500 K) |
present work |
| 357 |
1.2 × 10⁻³ |
≈ 0.82 |
— |
present work |
|
Li4SiO4 |
396 |
4.0 × 10⁻⁸ |
0.68 |
0.83 (333 to 453 K) |
32
|
| Li0.18La0.61TiO3 |
303 |
1.0 × 10⁻⁴ |
0.60 |
0.41 (370 to 523 K) |
33
|
|
Li7La3Zr2O12 (tetragonal phase) |
≈ 300 |
1.2 × 10⁻⁶ |
0.77 (< 135 K) |
0.52 (350 to 400 K) |
21
|
|
Li7La3Zr2O12 (cubic phase) |
≈ 300 |
≈ 1 × 10⁻⁴ |
— |
0.32 (290 to 573 K) |
17a
|
In order to estimate a macroscopic (solid-state) Li diffusion coefficient (D), we have converted the σ(0) values according to the Nernst–Einstein relation:
| |  | (4) |
Here, kB is Boltzmann's constant, q the elementary charge and N the number density of charge carriers which can be calculated according to N = nc/V. nc is the number of Li ions per unit cell and V the volume of the unit cell calculated from the PXRD analysis. Solid-state diffusion coefficients D range from 10−12 to 10−10 cm2 s−1 between 230 K and 280 K, and from 10−10 to 10−7 cm2 s−1 when temperatures between 320 K and 500 K are regarded. This is in good agreement with results recently reported in the literature.15
3.3
7Li NMR line shape measurements
For comparison with the conductivity results presented, we have recorded variable-temperature 7Li MAS NMR line shapes to obtain first insights into the Li dynamics from a microscopic point of view. In general, at a sufficiently low temperature the line width of an NMR spectrum acquired under static, i.e., non-rotating conditions, is dipolarly broadened due to the various Li–Li interactions present in a crystalline solid. With increasing temperature, these (homonuclear) dipole–dipole interactions are increasingly averaged due to the onset of (local) rapid Li hopping processes characterized by jump rates in the order of some kHz. Plotting the line width δ as a function of temperature T, a so-called motional narrowing (MN) curve is obtained; see also Ref. 35 for details, which can be used to roughly estimate Li diffusion parameters such as jump rates and activation energies. Starting from δ = δrl, which is the rigid-lattice line width, δ continuously decreases. In the limit of extreme narrowing, δ finally reaches δen which is solely governed by the inhomogeneities of the external magnetic field used.
In agreement with the results from impedance spectroscopy (see above), in the case of “Li6.5La2.5Ba0.5ZrTaO12” motional narrowing sets at extremely low temperatures. 7Li NMR spectra, which were recorded at different temperatures, are shown in Fig. 7 and the corresponding motional narrowing curve is given in Fig. 8. For example, at T = 200 K (≈ Tonset) the line width (full width at half maximum) is already decreased from δrl ≈ 8 kHz to δ = 7 kHz (see Fig. 8). At this temperature the mean Li jump rate 1/τ is expected to be in the order of 103 s−1. Using the well known Einstein–Smoluchowski equation:
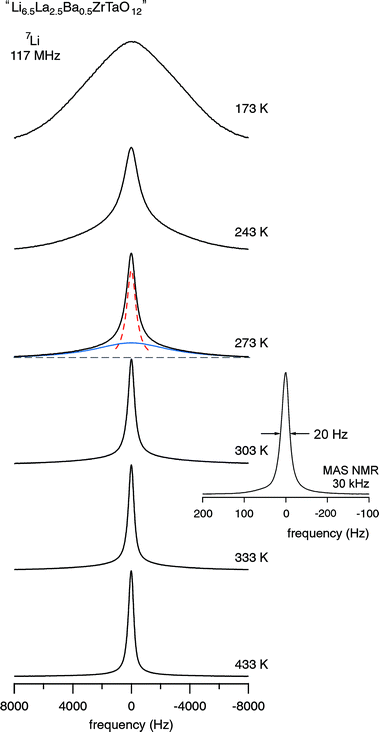 |
| | Fig. 7
7Li NMR spectra (117 MHz) of “Li6.5La2.5Ba0.5ZrTaO12” recorded at the temperatures indicated. At intermediate T the spectra are composed of two components reflecting fast and slow Li ions in the garnet. As an example, the spectrum recorded at 273 K has been fitted with a sum of a narrow Lorentzian (dashed line) and a broad Gaussian (solid line). The number fraction of fast Li ions turns out to be approximately 50% at this temperature. Inset: 6Li MAS NMR spectrum recorded at a spinning speed of 30 kHz and ambient bearing gas. | |
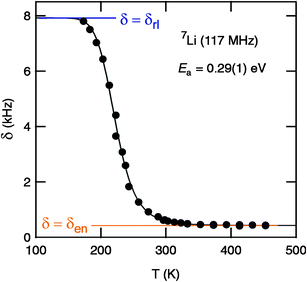 |
| | Fig. 8 Motional narrowing of the 7Li NMR spectra (117 MHz) of “Li6.5La2.5Ba0.5ZrTaO12”. The (overall) line width δ (fwhm, full width at half maximum) is plotted as a function of temperature T. Starting from a δrl slightly larger than 8 kHz, the line width is reduced to δen = 420 Hz when T is higher than 300 K. The solid line shows a fit according to the model of Hendrickson and Bray36,37 yielding an activation energy of 0.29(1) eV. See text for further details. | |
this yields a self-diffusion coefficient of Dsd ≈ 7 × 10⁻¹⁴ cm2 s−1. Here, a mean jump distance dm = 2 Å was used to estimate Dsd. The obtained value is in good agreement with those probed by impedance spectroscopy when the D values plotted in Fig. 6 are extrapolated to lower temperatures.
At T = 243 K the NMR line width is significantly narrowed, revealing a so-called two-component line shape (Fig. 7). In this intermediate temperature range the spectra are composed of a broad Gaussian superimposed by a motionally narrowed Lorentzian shaped line. Such a heterogeneous line narrowing has already been observed for other crystalline garnets by Koch et al.36 It points to a distribution of jump rates which are present at least in the range of extremely low temperatures (T < 300 K). This might be the direct consequence of an irregularly shaped potential landscape the hopping ions are exposed to.
In the present case, almost the full motional narrowing curve could be detected (Fig. 8). Thus, the inflexion point of the curve can be accurately determined. Here, δ reaches δrl/2 when T is increased to T = Tinfl. = 230 K. At this temperature the jump rate 1/τ can be approximated by 1/τ(Tinfl) = 2π × δrl. Using δrl = 8 kHz the corresponding self-diffusion coefficient, Dsd(Tinfl) = d2 2πδrl/6, is given by Dsd(230 K) ≈ 3.5 × 10⁻¹² cm2 s−1 confirming the fast ion conduction process presented in Fig. 6. Moreover, the expression introduced by Waugh and Fedin, Ea,MN/eV = 1.617 × 10⁻³ · Tonset/K, can be used to crudely estimate an activation energy from a δ(T) curve. Inserting Tonset = 200 K yields Ea,MN = 0.31 eV. Almost the same value, viz. 0.29 eV, is obtained when the motional narrowing curve is analyzed according to the model of Hendrickson and Bray, see Ref. 21,37,38 for details. Interestingly, the activation energy roughly deduced from NMR line shape measurements is lower than that directly probed by DC-conductivity measurements in the same temperature range. However, it is worth noting that changes in NMR line widths measurements are sensitive to Li dynamics taking place on a shorter length-scale than DC-conductivity measurements. The later are sensitive to long-range Li transport.
The rapid Li exchange process is also reflected by the 6Li MAS NMR spectrum shown in Fig. 7 (see inset) which was recorded with ambient bearing gas pressure and at a rotation frequency of 30 kHz. The spectrum is composed of a single NMR line whose line width (fwhm) amounts to no more than 20 Hz. Besides external spinning, an extremely fast Li exchange process, as probed by the static variable-temperature NMR line shape recorded, might additionally cause such a narrow NMR signal. Preliminary 7Li NMR spin–lattice relaxation measurements performed at ω0/2π = 117 MHz indicate that the diffusion-induced rate peak 1/T1(1/T) shows up at approximately T = 480 K. According to the condition ω0τ ≈ 1, which is valid at the temperature where the peak maximum shows up,21,39,40 at T ≈ 480 K the Li jump rate is expected to be in the order of 7.3 × 10⁸ s−1 which corresponds to Dsd ≈ 4.9 × 10⁻⁸ cm2 s−1 (Fig. 6).
3.4 Compatibility with electrode materials
Finally, the compatibility and chemical stability of “Li6.5La2.5Ba0.5ZrTaO12” against the high-voltage cathode material Li2FeMn3O8 was studied by heating a mixture of the two compounds at elevated temperatures. Interestingly, despite of the high Li diffusivity probed, cubic “Li6.5La2.5Ba0.5ZrTaO12” turns out to be stable up to 673 K (Fig. 9) while at 873 K the garnet seems to react with the cathode material. The corresponding PXRD pattern is solely governed by the peaks of the spinel Li2FeMn3O8 (Fig. 8). The chemical stability of “Li6.5La2.5Ba0.5ZrTaO12” in the presence of a commonly used cathode material such as Li2FeMn3O8 makes it a promising candidate for further battery application studies.
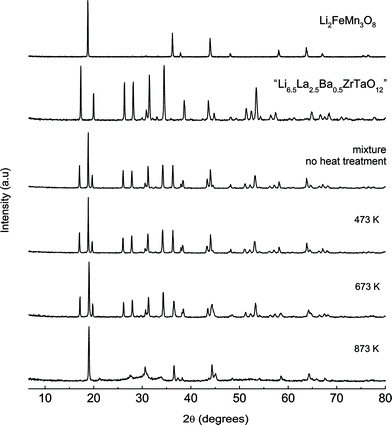 |
| | Fig. 9
PXRD pattern of mixtures of “Li6.5La2.5Ba0.5ZrTaO12” and Li2FeMn3O8 (1:1 wt% ratio) illustrating the chemical compatibility of the garnet-like oxide with a high-voltage cathode material. The mixtures have been heated at 473 K, 673 K and 873 K for 24 h in air. | |
4. Conclusions
In summary, the garnet-type “Li6.5La2.5Ba0.5ZrTaO12” represents a very promising oxide to be used as highly conducting electrolyte in future all solid state lithium-ion batteries. At room temperature (300 K), the Li conductivity σDC, characterizing long-range ion transport, is of the order of 10−4 S cm−1. Rapid Li diffusivity was confirmed by 7Li NMR line shape measurements clearly revealing that motional narrowing of the line width sets in at temperatures as low as 220 K, i.e., well below ambient temperature. Hence, NMR line shape measurements indicate that σ is solely governed by ionic conductivity. Despite of the high Li+ conductivity of garnet-type “Li6.5La2.5Ba0.5ZrTaO12”, the oxide shows a remarkably good chemical stability when heated together with a cathode material such as Li2FeMn3O8, making it a highly suitable candidate for applications in all-solid-state energy systems.
Acknowledgements
One of us (V. T.) would like to thank the AUTO21 Network of Centres of Excellence, Canada's national automotive research and development program, and the Canada Foundation for Innovation (CFI) for their support. We also thank Robert Marr of the Department of Geoscience, University of Calgary for his help with EMPA and WDS measurements.
References
-
(a) B. Scrosati, J. Hassoun and Y-K. Sun, Energy Environ. Sci., 2011, 4, 3287–3295 RSC;
(b) C.-X. Zu and H. Li, Energy Environ. Sci., 2011, 4, 2614–2624 RSC;
(c) V. Etacheri, R. Marom, R. Elazari, G. Salitra and D. Aurbach, Energy Environ. Sci., 2011, 4, 3243–3262 RSC;
(d) J. M. Tarascon and M. Armand, Nature, 2001, 414, 359–367 CrossRef CAS.
-
(a) J. B. Goodenough and Y. Kim, Chem. Mater., 2010, 22, 587–603 CrossRef CAS;
(b) X.-P. Gao and H.-X. Yang, Energy Environ. Sci., 2010, 3, 174–189 RSC.
- X. Xu, J. B. Bates, G. E. Jellison and F. X. Hart, J. Electrochem. Soc., 1997, 144, 524–532 CrossRef.
- H. Kawai and J. Kuwano, J. Electrochem. Soc., 1994, 141, L78–L79 CrossRef CAS.
- A. D. Robertson, A. R. West and A. G. Ritchie, Solid State Ionics, 1997, 104, 1–11 CrossRef CAS.
- V. Thangadurai and W. Weppner, Ionics, 2006, 12, 81–92 CrossRef CAS.
- G. Adachi, N. Imanaka and H. Aono, Adv. Mater., 1996, 8, 127–135 CrossRef CAS.
- P. Knauth, Solid State Ionics, 2009, 180, 911–916 CrossRef CAS.
- J. W. Fergus, J. Power Sources, 2010, 195, 939–954 CrossRef CAS.
- V. Thangadurai, H. Kaack and W. Weppner, J. Am. Ceram. Soc., 2003, 86, 437–440 CrossRef CAS.
- J. Percival and P. R. Slater, Solid State Commun., 2007, 142, 355–357 CrossRef CAS.
- E. J. Cussen, J. Mater. Chem., 2010, 20, 5167–5173 RSC.
- V. Thangadurai and W. Weppner, Adv. Funct. Mater., 2005, 15, 107–112 CrossRef CAS.
- M. P. O'Callaghan and E. J. Cussen, Chem. Commun., 2007, 2048–2050 RSC.
-
(a) S. Narayanan and V. Thangadurai, J. Power Sources, 2011, 196, 8080–8090 CrossRef;
(b) A. Ramzy and V. Thangadurai, Appl. Mater. Interfaces, 2010, 2, 385–390 CrossRef CAS;
(c) V. Thangadurai and W. Weppner, J. Solid State Chem., 2006, 179, 974–984 CrossRef CAS.
- J. Percival, E. Kendrick and P. Slater, Solid State Ionics, 2008, 179, 1666–1669 CrossRef CAS.
-
(a) R. Murugan, V. Thangadurai and W. Weppner, Angew. Chem. Int. Ed., 2007, 46, 7778–7781 CrossRef CAS;
(b) K. Kim, Y. Iriyama, K. Yamamoto, S. Kumazaki, T. Asaka, K. Tanabe, C. A. J. Fisher, T. Hirayama, R. Murugan and Z. Ogumi, J. Power Sources, 2011, 196, 764–767 CrossRef CAS;
(c) M. Kotobuki, H. Munakata, K. Kanamura, Y. Sato and T. Yoshida, J. Electrochem. Soc., 2010, 157, A1076–A1079 CrossRef CAS;
(d) S. Ohta, T. Kobayashi and T. Asaoka, J. Power Sources, 2011, 196, 3342–3345 CrossRef CAS;
(e) Y. Shimonishi, A. Toda, T. Zhang, A. Hirano, N. Imanishi, O. Yamamoto and Y. Takeda, Solid State Ionics, 2011, 183, 48–53 CrossRef CAS;
(f) Y. Jin and P. J. McGinn, J. Power Sources, 2011, 196, 8683–8687 CrossRef CAS.
- J. Awaka, N. Kijima, H. Hayakawa and J. Akimoto, J. Solid State Chem., 2009, 182, 2046–2052 CrossRef CAS.
- C. A. Geiger, E. Alekseev, B. Lazic, M. Fisch, T. Armbruster, R. Langner, M. Fechtelkord, N. Kim, T. Pettke and W. Weppner, Inorg. Chem., 2011, 50, 1089–1097 CrossRef CAS.
- L. A. O'Dell, S. L. P. Savin, A. V. Chadwick and M. E. Smith, Solid State Nucl. Magn. Res., 2007, 31, 169–173 CrossRef CAS.
- A. Kuhn, S. Narayanan, L. Spencer, G. Goward, V. Thangadurai and M. Wilkening, Phy. Rev. B, 2011, 83, 094302 CrossRef.
- H. Xie, J. A. Alonso, Y. Li, M. T. Fernandez and J. B. Goodenough, Chem. Mater., 2011, 23, 3587–3589 CrossRef CAS.
- E. J. Cussen, Chem. Commun., 2006, 412–413 RSC.
- Q. Li and V. Thangadurai, Fuel Cells, 2009, 9, 684–698 CrossRef CAS.
- V. Thangadurai, R. A. Huggins and W. Weppner, J. Power Sources, 2002, 108, 64–69 CrossRef CAS.
- J. T. S. Irvine, D. C. Sinclair and A. R. West, Adv. Mater., 1990, 2, 132–137 CrossRef CAS.
-
A. K. Jonscher, Dielectric Relaxation in Solids, 1983, Chelsea Dielectric Press, London. Search PubMed.
- A. K. Jonscher, Nature, 1977, 267, 673–679 CrossRef CAS.
- K. A. Mauritz, Macromolecules, 1989, 22, 4483–4488 CrossRef CAS.
- D. K. Pradhan, R. N. P. Choudhary and B. K. Samantaray, Int. J. Electrochem. Sci., 2008, 3, 597–608 CAS.
- M. A. París and J. Sanz, Chem. Mater., 2000, 12, 1694–1701 CrossRef.
- D. P. Almond, A. R. West and R. J. Grant, Solid State Commun., 1982, 44, 1277–1280 CrossRef CAS.
- D. P. Almond, G. K. Duncan and A. R. West, Solid State Ionics, 1983, 8, 159–164 CrossRef CAS.
- I. M. Hodge, M. D. Ingram and A. R. West, J. Amer. Ceram. Soc., 1976, 59, 360–366 CrossRef CAS.
- M. Wilkening, V. Epp, A. Feldhoff and P. Heitjans, J. Phys. Chem. C, 2008, 112, 9291–9300 CAS.
- B. Koch and M. Vogel, Solid State Nucl. Magn. Reson., 2008, 34, 37–43 CrossRef CAS.
- J. Hendrickson and P. Bray, J. Magn. Res., 1973, 9, 341–357 CAS.
- M. Wilkening, D. Bork, S. Indris and P. Heitjans, Phys. Chem. Chem. Phys., 2002, 4, 3246–3251 RSC.
- V. Epp and M. Wilkening, Phys. Rev. B, 2010, 82, 020301 CrossRef.
- A. Kuhn, P. Sreeraj, R. Pöttgen, H.-D. Wiemhöfer, M. Wilkening and P. Heitjans, J. Am. Chem. Soc., 2011, 133, 11018–11021 CrossRef CAS.
|
| This journal is © The Royal Society of Chemistry 2012 |
Click here to see how this site uses Cookies. View our privacy policy here.