Green-emitting phosphor Na2Gd2B2O7:Ce3+, Tb3+ for near-UV LEDs
Chongfeng
Guo
*,
Heng
Jing
and
Ting
Li
National Key Laboratory of Photoelectric Technology and Functional Materials (Culture Base) in Shaanxi Province, National Photoelectric Technology and Functional Materials & Application of Science and Technology International Cooperation Base, Institute of Photonics & Photon-Technology and Department of Physics, Northwest University, Xi'an 710069, China. E-mail: gcfzsu@yahoo.com.cn
First published on 18th January 2012
Abstract
An intense green-emitting phosphor Na2Gd2B2O7:Ce3+, Tb3+ is developed on the basis of the highly efficient energy transfer from Ce3+ to Tb3+. The photoluminescence emission and excitation spectra, the lifetime, and the effect of Tb3+ concentration are investigated in detail. Results confirm the occurrence of non-radiative energy transfer from Ce3+ to Tb3+ with an efficiency of over 80%. The intensity ratio of blue emission from Ce3+ and green emission from Tb3+can be tuned by adjusting their concentrations. The enhanced photoluminescence of Tb3+ with sharp emission lines could be obtained by the broad band excitation peak at about 360 nm from the allowed 4f–5d absorption of Ce3+ ions. The results suggest that the phosphor Na2Gd2B2O7:0.05Ce3+, 0.12Tb3+ with the optimal composition could potentially be used for near ultraviolet light-emitting diodes (n-UV LEDs).
1. Introduction
With rapid development of the world economy and the advance of modern technology, the demand for energy is increasing at an unprecedented pace. The sustainable development of the society faces huge challenges because of the depletion of traditional fossil fuels and high pollutant emission. New clean energy sources and the energy saving devices are two desirable methods to overcome this problem. Light emitting diodes (LEDs) are considered ideal candidates for the replacement of conventional lighting applications because of their energy saving and environmental friendly nature. The world wide electricity cost for lighting would decrease by more than 50% a year if LEDs could displace general illumination light sources such as incandescent and fluorescent lamps.1–2 Nowadays, white light emitting diodes (w-LEDs) fabricated with near-ultraviolet (n-UV, 350–410 nm) LED chips and tricolor (red, green and blue) phosphors are expected to dominate the market in the near future due to their high color rendering index (Ra) and tunable color temperatures (Tc).3 However, the range of phosphors suitable for n-UV LEDs is limited. Usually, the commercial phosphors for n-UV LED are the blue phosphor BaMgAl10O17:Eu2+, the green phosphor ZnS: Cu+, Al3+ and the red phosphor Y2O2S:Eu3+.4 The sulfide-based green and red phosphors suffer from poor stability, which seriously decreases the lifetime of the devices.5 Thus, it is important to develop novel green or red phosphors with high stability.The Tb3+ ion is frequently used as an activator of green emitting luminescent materials due to its predominant 5D4→7F5 transition peak at around 545 nm. Moreover, the characteristic sharp emissions of Tb3+ originating from intra-configurational 4f–4f transitions are almost independent of the host lattice since the 4f orbital is shielded from the exterior by the filled 5s2 and 5p6 orbitals, which leads to the excellent reproduction quality of the optical properties of the phosphor. Unfortunately, the intensities of the Tb3+ absorption peaks in the n-UV region are very weak and their widths are very narrow due to the strictly forbidden 4f–4f transitions,6–7 which makes it an imperfect activator for LEDs. One of the strategies to overcome the above problem is using Ce3+ as a sensitizer because it has a strong excitation band and an efficient emission band originating from allowed 4f–5d transitions, which has been investigated in different hosts. However, most of their maximum excitation wavelengths do not exceed 350 nm. The maximum excitation wavelength peaked at 400 nm for sulfide-based phosphor CaLaGa3S6O:Ce3+, Tb3+, but its energy transfer efficiency is very low (about 11%) and the stability is poor. The above results indicate that they do not match well with the n-UV LEDs chip.8–12
As an important family of luminescent materials, borate phosphors have great potential in the application of LEDs due to their low synthesizing temperature, environmental benignity, and excellent chemical and physical stability.13–15 In the present study, we develop a novel borate phosphor Na2Gd2B2O7:Ce3+, Tb3+, which shows intense broad band absorption with maximum excitation at about 360 nm and excellent green emission. This suggests that Na2Gd2B2O7:Ce3+, Tb3+ (NGBO: Ce3+, Tb3+) could be a potential green phosphor candidate for n-UV LEDs.
2. Experimental
2.1 Materials and synthesis
In the present compound Na2Gd2B2O7, we suggest that the Ce3+ and Tb3+ ions prefer to occupy the sites of Gd3+ ions because of the same valence and the cation size effect. Therefore the nominal formula of the present phosphors could be regarded as Na2Gd2−m−nB2O7: mCe3+, nTb3+ (NGBO: mCe3+, nTb3+). We prepared a series of green emitting Na2Gd1.95−nB2O7: 0.05Ce3+, nTb3+ (m = 0.05) phosphor powders by a conventional solid-state method under a CO reducing atmosphere. Stoichiometric amounts of the starting materials, Na2CO3 (A. R.), H3BO3 (A. R.), Gd2O3 (99.99%), CeO2 (99.99%) and Tb4O7 (99.99%) were mixed homogeneously and placed in a small covered corundum crucible. Then the small crucible was contained in a large outer crucible and buried in carbon sticks. Afterwards, the large crucible with its contents was calcined at 980 °C for 6 h in a muffle furnace under ambient atmospheres and then cooled to room temperature. Finally, samples were crushed to fine powder.2.2 Characterization
Powder X-ray diffractions (XRD) measurements were performed in the range of 50 ≤ 2θ ≤ 500 using an Rigaku–Dmax 3C powder diffractometer with Cu-Kα (λ = 1.5405 Å) radiation. The measurements of the photoluminescence (PL) and photoluminescence excitation (PLE) spectra were recorded with a Hitachi F-7000 fluorescence spectrophotometer equipped with a xenon lamp as its excitation source. The decay curves were determined on an Edinburgh FLS920 spectrofluorometer, equipped with a 450 W Xe lamp and a 150 W nF900 nanosecond flash lamp. To eliminate the second-order emission of the source radiation, a cutoff filter was used in the measurements. Photoluminescence spectra of all samples were tested three times to reduce the error and all measurements were performed at room temperature.3. Results and discussions
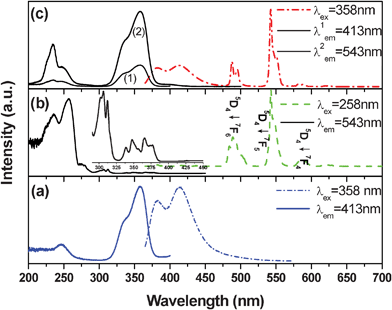
The crystal structure of Na2Gd2B2O7 has been refined to be monoclinic with lattice parameters a = 10.695(6) Å, b = 6.320(4) Å, c = 10.328(6) Å, β = 122.27° and the space group of P21/c.16 All of the as-prepared phosphor samples are identified as single-phased and are in good agreement with those reported in the JCPDS file 89-4442 regardless of the doping contents, which indicates that the introduction of activators Tb3+ and Ce3+ does not cause any significant changes in the host structures.Fig. 1a shows the PLE and PL spectra of NGBO: 0.05Ce3+. The PLE spectrum monitored at 413 nm exhibits two distinct excitation bands at 246 and 358 nm, which is assigned to the 4f–5d transitions of Ce3+. Under excitation of n-UV light (λex = 358 nm), the PL spectrum exhibits a blue emission with typical doublet bands emission peaks at about 382 and 414 nm, respectively, which corresponds to the transition of Ce3+ ions from the 5d1 excited state to the 2F5/2 and 2F7/2 ground states. As for the Tb3+ singly doped NGBO sample, its PLE and PL spectra are presented in Fig. 1b. The PL spectrum under the excitation of 258 nm displays a series of sharp line emissions at 488, 543, 586 and 620 nm, due to the 5D4→7FJ (J = 6, 5, 4, and 3) characteristic transitions of Tb3+ ions, and the green emission line at 543 nm from 5D4→7F5 transitions dominates the whole spectrum. Monitoring the emission at 543 nm, the PLE spectra include a group of weak sharp absorption peaks in the 275–400 nm longer wavelength regions (inset of Fig. 1b) and two strong absorption bands. The former is assigned to the forbidden f–f transitions of Tb3+, and the latter broad band absorption should be attributed to the allowed 4f–5d transition of Tb3+.11
 | ||
| Fig. 1 PLE (solid curve) and PL (dash curve) spectra of NGBO: 0.05Ce3+, (b) NGBO: 0.06Tb3+, and NGBO: 0.05Ce3+, 0.06Tb3+. | ||
Comparing Fig. 1a and Fig. 1b, it is clearly observed that there is an overlap between the emission spectrum of Ce3+ and the excitation spectrum of Tb3+, which indicates that the resonance-type energy transfer from Ce3+ to Tb3+ can be expected to take place in NGBO host. Moreover, the exchange interaction energy transfer behavior may occur alongside the resonant energy transfer because of the overlap between the excitation spectrum of Tb3+ and that of solely Ce3+ doped NGBO phosphors.17 As shown in Fig. 1c, the excitation spectrum of Ce3+ and Tb3+ co-doped NGBO monitored with 413 (Ce3+ emission) is similar to that monitored with 543 nm (Tb3+ emission) except for the discrepancy in relative intensity. The presence of the 4f–5d transitions from Ce3+ ions in the PLE spectrum monitored at the 5D4→7F5 transition (543 nm) proves the occurrence of energy transfer from Ce3+ to Tb3+. Under the excitation of 358 nm n-UV light from the Ce3+ absorption, blue bands from Ce3+ and green lines from Tb3+ appeared in the PL spectrum of NGBO: Ce3+, Tb3+. Therefore, it is expected that Tb3+ can serve as an activator of green emitting phosphor for n-UV LEDs through energy transfer from the Ce3+ intense broad band absorption in the n-UV region. In comparison with the maximum excitation wavelength of many Ce3+–Tb3+ co-doped phosphors for LEDs, such as 335 nm for Ba2Gd2Si4O13:Ce3+, Tb3+8 and 328 nm for NaCaPO4:Ce3+, Tb3+,11 the present green emitting phosphor with the optimal absorption at 358 nm is more suitable for n-UV LEDs.
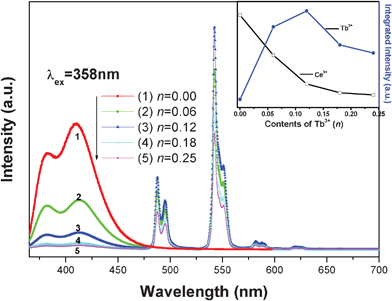
Fig. 2 shows the PL spectra of NGBO: 0.05Ce3+, nTb3+ phosphors with different Tb3+ doping contents, n, which were recorded with an excitation wavelength of 358 nm. The inset of Fig. 2 illuminates the dependence of the intensities of Ce3+ and Tb3+ as a function of Tb3+ concentrations; the intensities are defined as the area under their PL curves calculated by integrating from 365 to 475 nm for Ce3+ and from 475 to 650 nm for Tb3+, respectively. It is found that the intensity of the Ce3+ emission becomes weaker with increasing Tb3+ concentration; whereas the emission intensities of Tb3+ gradually intensify and then begin to decline after reaching the maximum value at n = 0.12 as a result of concentration quenching. The above results indicate that efficient energy transfer takes place from Ce3+ to Tb3+; furthermore, the intensity of blue emission from Ce3+ or the green emission from Tb3+ could be tuned by appropriately adjusting the concentration of the sensitizer Ce3+ and the activator Tb3+.
 | ||
| Fig. 2 PL spectra (λex = 358 nm) of NGBO: 0.05Ce3+, nTb3+ (n = 0, 0.06, 0.12, 0.18, 0.25). Inset: Integrated emission intensity of Ce3+ and Tb3+ with different concentration of Tb3+. | ||
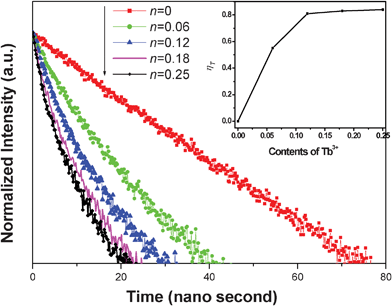
In order to well understand the energy transfer process, the decay curves of Ce3+ with different Tb3+ concentrations were measured, as shown in Fig. 3. It can be seen that the decay curve of the Ce3+ singly doped NGBO sample is well fitted with a single-exponential function with a lifetime of about 22.42 ns. However, the decay curves of Ce3+ ions significantly deviate from the single exponential rule with the introduction of Tb3+ ions, which indicates that the doping of Tb3+ ions modifies the fluorescent dynamics of the Ce3+ ions.18 The effective lifetimes are defined by eqn (1)
 | (1) |
 | (2) |
 | ||
| Fig. 3 Decay curves of the emission at 385 nm for Ce3+ in phosphors NGBO: 0.05Ce3+, nTb3+ with different contents of Tb3+ (λex = 358 nm, n = 0, 0.06, 0.12, 0.18, 0.25). Inset: Dependence of energy transfer efficiency on concentration of Tb3+. | ||
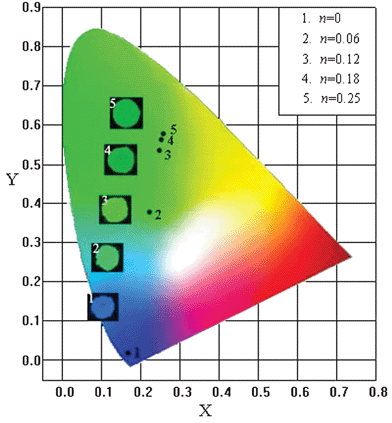
From the corresponding PL spectra upon 358 nm excitation, the commission International de I'Eclairage chromaticity coordination of the phosphors NBGO: 0.05Ce3+, nTb3+ (n = 0, 0.06, 0.12, 0.18 and 0.25) have been calculated and presented in Fig. 4. With the increase of Tb3+ concentration, the color hue of the phosphor gradually moves forward to the green region from the deep blue region under the excitation of n-UV light with 358 nm wavelength. The inset in Fig. 4 demonstrates a group of photos of the NBGO: 0.05Ce3+, nTb3+ phosphors with different Tb3+ contents under 365 nm excitation in a UV box. As consistent with Fig. 2, the results also indicate that the phosphor NBGO: 0.05Ce3+, 0.12Tb3+ shows the strongest green light, which suggest that the present phosphor could be used as a potential candidate as a green emitting phosphor for n-UV LEDs.
 | ||
| Fig. 4 CIE diagram of NBGO: 0.05Ce3+, nTb3+ phosphors (n = 0, 0.06, 0.12, 0.18 and 0.25) excited at 358 nm. Inset: phosphors under 365 nm excitation. | ||
4. Conclusion
In summary, a series of single-phased NBGO: Ce3+, Tb3+ phosphors with tunable color were developed in this paper. The emission color of the obtained phosphors can be tuned appropriately from deep blue to green through simply adjusting the concentration of Tb3+ because of the different emission compositions of Ce3+ and Tb3+. The decrease of the Ce3+ transition decay time with the introduction of Tb3+ confirms the occurrence of an efficient non-radiative energy transfer from Ce3+ to Tb3+. Tb3+ can give a bright green emitting light by a strong excitation band of Ce3+, centered at about 358 nm near-UV light, perfectly matching with n-UV LED chips. The phosphor NBGO: 0.05Ce3+, 0.12Tb3+ shows the brightest green light and its energy transfer efficiency from Ce3+ to Tb3+ is over 80%, which indicates that it can serve as a potential green emitting phosphor for n-UV LEDs.Acknowledgements
This work was supported by the high-level talent project of Northwest University, National Natural Science Foundation of China (No.50802031) and Ph.D Programs Foundation of Ministry of Education of China (No.20070487076), Natural Science Foundation of Hubei Province (2010CDB01607) and Foundation of Shaanxi Educational Committee (11JK0528).References
- E. Fred Schubert and J. K. Kim, Science, 2005, 308, 1274 CrossRef.
- Jin Z. Zhang, J. Phys. Chem. Lett., 2011, 2, 1351 CrossRef CAS.
- E. Radkov, R. Bompiedi, A. M. Srivastava, A. A. Setlur and C. Becker, Proc. SPIE–Int. Soc. Opt. Eng., 2004, 5187, 171 CAS.
- V. Sivakumar and U. V. Varadaraju, J. Solid State Chem., 2008, 181, 3344 CrossRef CAS.
- Chongfeng Guo, Fei Gao, Yan Xu, Lifang Liang, Fank G. Shi and Bohan Yan, J. Phys. D: Appl. Phys., 2009, 42, 095407 CrossRef.
- Feng Wang, Renren Deng, Juan Wang, Qingxiao Wang, Yu Han, Haomiao Zhu, Xueyuan Chen and Liu. Xiaogang, Nat. Mater., 2011, 10, 968 CrossRef CAS.
- Yan Chen, Jing Wang, Xingguo Zhang, Gongguo Zhang, Menglian Gong and Qiang Su, Sens. Actuators, B, 2010, 148, 259 CrossRef.
- Hai Guo, Hao Zhang, Jingjing Li and Fang Li, Opt. Express, 2010, 18, 27257 CrossRef CAS.
- A. Nag and T. R. N. Kutty, Mater. Chem. Phys., 2005, 91, 524 CrossRef CAS.
- Gongguo Zhang, Jing Wang, Yan Chen and Su. Qiang, Opt. Lett., 2010, 35, 2382 CrossRef CAS.
- Ning Guo, Yanhua Song, Hongpeng You, Guang Jia, Mei Yang, Kai Liu, Yuhua Zheng, Yeju Huang and Zhang. Hongjie, Eur. J. Inorg. Chem., 2010, 4636 CrossRef CAS.
- Pushpal Ghosh, Arik Kar and Patra. Amitava, Nanoscale, 2010, 2, 1196 RSC.
- Z. Li, J. Zeng, G. Zhang and Y. Li, J. Solid State Chem., 2005, 178, 3624 CrossRef CAS.
- Wei-Ren Liu, Chien-Hao Huang, Chih-Pin Wu, Yi-Chen Chiu, Yao-Tsung Yeh and Teng-Ming Chen, J. Mater. Chem., 2011, 21, 6869 RSC.
- Chongfeng Guo, Luan Lin, Yan Xu, Fei Gao and Lifang Liang, J. Electrochem. Soc., 2008, 155, J310 CrossRef CAS.
- G. Corbel, M. Leblanc, E. Antic-Fidancev and M. Lemaìtre-Blaise, J. Solid State Chem., 1999, 144, 35 CrossRef CAS.
- Z. Zhang, J. Wang, M. Zhang, Q. Zhang and Q. Su, Appl. Phys. B: Lasers Opt., 2008, 91, 529 CrossRef CAS.
- Ning Guo, Yeju Huang, Hongpeng You, Mei Yang, Yanhua Song, Kai Liu and Yuhua Zheng, Inorg. Chem., 2010, 49, 10907 CrossRef CAS.
| This journal is © The Royal Society of Chemistry 2012 |
