Biomimetic synthesis of nanocrystalline silver sol using cysteine: stability aspects and antibacterial activities†
Mainak
Roy
a,
Poulomi
Mukherjee
b,
Balaji P.
Mandal
a,
Rajendra K.
Sharma
c,
Avesh K.
Tyagi
a and
Sharad P.
Kale
*b
aBhabha Atomic Research Centre - Chemistry Division, Mumbai, Maharashtra, India
bBhabha Atomic Research Centre - Nuclear Agriculture and Biotechnology Division, Mumbai, Maharashtra, India
cBhabha Atomic Research Centre - Technical Physics Division, Mumbai, Maharashtra, India
First published on 19th June 2012
Abstract
The study reports the development of a simple, environmentally benign green chemical route to produce stable silver nanoparticle (Ag-np) sols with excellent antibacterial properties under ambient conditions. The method involves the room temperature reduction of AgNO3 by cysteine (aq) and requires no additional capping/stabilizing agent. It essentially mimics the redox reaction that takes place during incubation of the cell-free extract from Trichoderma asperellum in the presence of AgNO3 (aq) (P. Mukherjee, M. Roy, B. P. Mandal, G. K. Dey, P. K. Mukherjee, J. Ghatak, A. K. Tyagi and S. P. Kale, Nanotechnology, 2008, 19, 075103), wherein cysteine, a biomolecule present in the fungal extract, acts as a potential reducing agent. Additionally, cysteine acts as a capping molecule in the present case. Formation of Ag-nps was evidenced from UV-Vis, TEM, XRD and EDS studies. The stability of Ag sols has been shown to depend strongly on the concentration of cysteine relative to that of AgNO3. Sols obtained by reacting 0.1 mM of cysteine with 1 mM of AgNO3 remained stable for more than one month at 24 °C. The role of cysteine as capping molecule and the possible modes of its linkages with Ag-nps was studied by FT-IR, XPS and Raman spectroscopy. Bonding of Ag with either or all the three, thiolate, amino and carboxylate groups of the cysteine molecule via stable PH configuration is believed to have resulted in the stabilization of the Ag-nps. Antibacterial activity of the cysteine capped Ag sol was studied along with that of the Ag sol obtained by fungal route. Both the sols exhibited excellent and comparable efficacies as bactericidal agents against gram negative bacteria E. coli BW (25113), with one of the lowest minimum inhibitory concentration (MIC) and minimum bactericidal concentration (MBC) values published so far.
1. Introduction
Nanocrystalline silver sols are potential antibacterial agents. Growth of ampicillin-resistant E. coli and multi-drug resistant strains of S. typhi is inhibited using 25 μg ml−1 or higher concentrations of silver nanoparticles.1 Apart from therapeutic applications, nanocrystalline silver particles are used as probes for high-sensitivity bio-molecular detection,2 in catalysis3 and in micro-electronics.4The large scale chemical synthesis of silver sols is carried out using toxic reagents, surfactants for capping and organic solvents.4–6 These chemicals are extremely difficult to degrade and dispose at industrial scales and hence, might be potential hazards to the environment. Moreover, chemically synthesized silver sols are not suitable for in vivo bio-medical applications since the accompanying foreign entities are highly incompatible with biological systems and/or might even induce thrombosis or precipitate antigenic/allergic reactions in them. In view of serious limitations of the chemically synthesized metal sols, there has been a recent upsurge of interest in synthesizing metal nano-particles through environmentally benign biochemical routes, wherein non-hazardous aqueous solvents are used at biological pH and ambient temperatures.7,8 Both intra and extra cellular syntheses of metal nanoparticles using different pathogenic strains have been reported.7,8 We have recently synthesized extremely stable (stability over 1 year in darkness) silver sols using a cell-free extract of a non-pathogenic bio-control agent T. asperellum under ambient conditions.9 In the present manuscript, these biologically synthesized silver nanoparticles have been shown to exhibit excellent antibacterial efficacy against Gram negative wild type E. coli BW (25113).
However, the biological processes are in general slower compared to chemical routes and the product yield is also comparatively lower. Moreover, they involve series of complicated steps such as sterilization, filtration, preparation of culture medium, and maintenance of culture through different generations etc. These make biological routes of synthesizing nanoparticles commercially less attractive despite its tremendous potential.
Alternately, the active components of the biological systems may be identified, isolated and/or synthesized separately and made to react under normal laboratory conditions to get the desired products. Such an approach may or may not necessarily work, since it does not take into account synergistic effects of other bio-components not directly participating in the key reaction(s). For rest of the cases it is expected to enhance productivity and also increase the reaction kinetics.
We had previously reported9 that ‘cysteine’, present in the cell-free extract of T. asperellum, possibly reduced AgNO3 to form Ag-nps. If it could have stabilized the Ag-nps as well, then cysteine alone might potentially serve as a substitute for the fungal extract in our Green recipe. This hypothesis was tested in the present study. An aqueous solution of cysteine (a common laboratory bio-chemical) was allowed to react with AgNO3 at room temperature to produce Ag-nps in a hassle-free, biomimetic approach. Relative concentration of cysteine to that of AgNO3 was varied to optimise the reaction kinetics and a stable silver sol was obtained for [cysteine]/[Ag] = 0.1. No additional protective coating and/or capping agents were used to stabilize the system. The stability of the silver sols as a function of relative concentration of cysteine was investigated and the role of cysteine as a capping agent was established. The mode of stabilization of the Ag-nps by cysteine was investigated by different spectroscopic techniques that indicated the possible bonding of silver with either or all three groups of cysteine, thiolate, amino and carboxylate .
It would be of further interest if the cysteine capped nanoparticles produced under optimized conditions would exhibit morphology, particle size and properties similar to the biologically synthesized nanoparticles. To verify this, the antibacterial activity of the cysteine capped Ag sol was studied and its efficacy against Gram negative bacteria E. coli BW (25113) was compared to that of the biologically synthesized nanoparticles. Exceedingly low values of MIC and MBC were registered for both the systems.
2. Experimental
Synthesis of Ag-nps
Stock solution of 10 mM cysteine was prepared by dissolving 121.1 mg of cysteine (purchased from Sigma) in 100 ml of de-ionized (DI) water. Similarly, a stock solution of 10 mM AgNO3 (from Aldrich) was also prepared by dissolving 169.87 mg of AgNO3 in 100 ml DI water. The two stock solutions were mixed very slowly at room temperature (∼24 °C) in varying proportions and samples containing the desired starting concentration of each component were obtained. Table 1 gives the concentrations of cysteine and AgNO3 in the four samples studied, hereafter designated as samples A, B, C and D. Aqueous solutions of the individual reagents were also studied as control. The samples were left (covered with Al foil) at room temperature (∼24 °C) for a few days under observation. The observation for different samples is given in Table 1. Only sample C was found to be stable and was characterized extensively. The other samples were also studied to find out the possible effects of the relative concentration of cysteine on the nature of Ag-nps produced. They have been discussed separately at the end of the manuscript. Silver sols were prepared via the fungal route following the procedure reported earlier.| Samples | [Cysteine] (mM) | [AgNO3] (mM) | Observation |
|---|---|---|---|
| A | 0.001 | 1 | Very fine precipitation after 2 days, transparent supernatant |
| B | 0.01 | 1 | Brownish grey precipitation after 2 days, transparent supernatant |
| C | 0.1 | 1 | Yellow sols, colour deepens in 2 days remains stable for more than 1 month |
| D | 1 | 1 | Instant flocculation followed by precipitation |
Antibacterial studies
Wild type E. coli BW (25113) was cultured in a fresh medium (Luria broth) and was allowed to grow overnight. Under these conditions, the cell density was found to be of the order of 109 ml−1. Fifty micro-litres of the culture containing ∼5 × 10⁸ cfu ml−1 was added to 5 ml of fresh culture medium supplemented with various dose of Ag-nps ranging from 1.08 μg ml−1 to 8.64 μg ml−1. The antibacterial activity of both cysteine-capped and biologically grown silver nanoparticles was then studied as a function of silver dosage. Two sets of control, one without the Ag sols but with the same quantity of inoculum, and the other with similar concentrations of the Ag sols but with no added inoculum were simultaneously maintained. All studies were done in triplicates. Care was taken to let the aerobic environment develop within the snap cap tubes. Overnight incubation of all the tubes was carried out at 37 °C in an orbital shaker at 150 rpm. The samples were analysed after overnight incubation for visual monitoring of turbidity and the MIC values for the respective samples were determined. Appropriate serial dilution of the tubes was done and bacteria in the diluted solution were seeded in Luria agar containing plates. The plates were incubated at 37 °C for 18 h and the number of resultant colonies in each plate was counted and recorded for further analysis. A similar study on the antibacterial property of cysteine capped Ag-nps was carried out by measuring the change in optical density at 600 nm as a function of nano-silver concentration in the bacteria inoculated tubes. Further, antibacterial activity of the cysteine capped Ag sol against different bacterial strains was investigated and MIC values for the respective bacteria, were ascertained by visual inspection of the turbidity.Instrumentation
UV-Vis spectra were recorded on JASCO spectrophotometer (model: V-530) with fresh aliquots. TEM images were recorded on carbon coated copper grids using a Zeiss LIBRA microscope operated at 120 kV. XRD measurements were done on an X-ray diffractometer with a monochromatized Cu-Kα X-ray source operated at 20 kV and 30 mA. FTIR spectra of solid samples obtained by centrifugation were recorded using a diamond ATR holder on a Shimadzu Affinity 1 spectrophotometer with air as reference. Dynamic light scattering and zeta potential measurements were carried out on Malvern Zeta Sizer Nano-ZS. Raman spectra were recorded using an indigenously developed confocal micro-Raman setup configured around a Horiba Jobin Yvon spectrograph. 532 nm of frequency doubled diode pumped solid state Nd: YAG laser source was used for excitation. X-ray photoelectron spectra were obtained on a VG Scienta made spectrometer provided with single channeltron detector with a resolution of < 1 eV, using Mg-Kα radiation of SPECS make XR 50 twin X-ray source. The base pressure of the experimental chamber was < 10−8 mbar during the measurement. All the XPS spectra were corrected for any possible instrumental shift by referencing against the standard C1s peak (@285 eV).3. Results and discussion
Fig. 1 shows the UV-Vis spectrum of sample C after ageing for 13 days. It exhibits an asymmetric peak at ∼398 nm corresponding to the surface plasmon frequency of nanocrystalline silver,10 clearly indicating that cysteine (aq) had reduced AgNO3 to metallic silver. An additional hump at ∼280 nm is attributed to the [cysteine-Ag+]n complexes11 that are also formed along with Ag-nps. The observation is in agreement with that of our previous report on Ag-nps synthesized by a fungal route.9 Inset of Fig. 1 shows the EDS spectrum of the same sample. Apart from that of silver, peaks due to carbon, nitrogen, sulphur and oxygen are also observed that arise from the capping of Ag-nps by the cysteine molecules.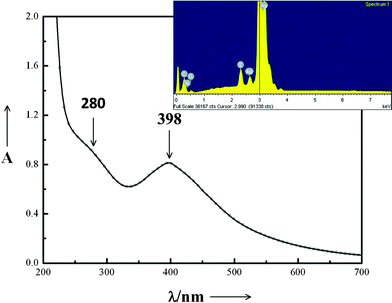 | ||
| Fig. 1 UV-Visible spectrum of sample C after ageing for 13 days. Inset: EDS spectrum of the same sample. | ||
The kinetics of the reaction were studied by drawing aliquots at regular intervals and recording the UV-vis spectra of the sol. The relative % yield of Ag-nps at a given time t was calculated according to the equation given below:
| % yield = (At/Af) × 100 | (i) |
where At and Af respectively denotes the absorbance of the sol at time t and after saturation. Fig. 2 shows the time dependent yield of Ag-nps for the sample C. The inset in Fig. 2 shows the corresponding change in absorbance at ∼398 nm with time. During the first 2–3 days, the reaction rate was quite slow which marked a phase of induction. Thereafter it increased gradually with time, indicating the growth phase. Finally after 12 days, no visible change with time of the plasmon band intensity of the sample could be observed which is also reflected in the saturation of the % yield vs. time curve. After 1 month, the plasmon band intensity started decreasing with ensuing visible precipitation. However, it may be noted that the time dependent absorbance studies provided only relative estimate of the yield, assuming it to be 100% at saturation.
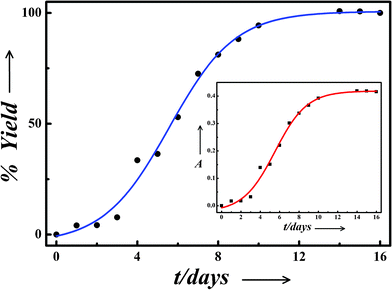 | ||
| Fig. 2 Percentage yield vs. time curve exhibiting different phases of nanoparticle synthesis by cysteine. Inset: Variation in absorbance at ∼398 nm with time of incubation for the sample C. | ||
The absolute yield was estimated to be ∼93% from the total Ag analysis of the spent solution (obtained by decantation) by atomic absorption spectroscopy (AAS). The nanoparticles obtained after removal of the spent solution were washed several times with DI water and acetone and dried at room temperature. Estimation of the nanoparticles yield was carried out by gravimetry. An average value of 78.1% was obtained from four independent runs. The washings were not included for AAS analysis to avoid dilution error. Hence, estimation by AAS provided an upper limit of the yield value due to the possibility that initially a small amount of unreacted Ag salt might have remained adsorbed on the nanoparticle surface. Conversely, gravimetry provided a lower limit of the yield value due to the unavoidable loss of nanoparticles during repeated washings.
Fig. 3 (a) shows a representative TEM image of the sample C. The dark contrasts are due to the Ag-nps. Particles with a narrow size distribution ranging between 8–18 nm and a mean value of 14.5 nm [as shown by bar diagram in Fig. 3 (b)] are observed. The average particle size for sample C, as estimated from the TEM image analysis is very much similar to that obtained for silver nanoparticles synthesized by the biological route.9 The lighter contrasts are attributed to the organic capping moieties attached with the metal nanoparticles. This is clearly illustrated in Fig. 3 (c). The hydrodynamic diameter of the capped nanoparticles comprises of metal crystals together with the organic moieties (indicated with a black circle) and is often estimated as the effective particle size by light scattering techniques. Fig. S1 in the ESI† shows the distribution of hydrodynamic diameters of the nanoparticles in sample C, statistical analysis on the same provides a mean value of 113 nm.
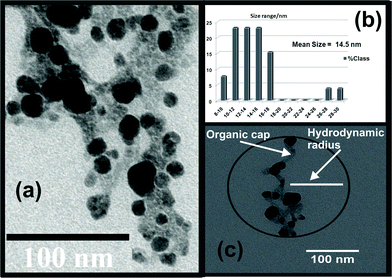 | ||
| Fig. 3 (a) TEM image of the sample C, (b) bar diagram showing a narrow particle size distribution and (c) estimated hydrodynamic diameter comprising of the nanoparticles and the organic caps. | ||
Fig. 4 shows the XRD pattern recorded in the 2θ range 20°–70°of sample C after attaining saturation, drop cast on a glass slide. The sample was further heated to remove organic moieties present in the sample. The capping molecules form an amorphous network around the metal nanoparticles [see Fig. 3(c)] and obscure the small XRD peaks of Ag at higher 2θ values. The diffraction pattern exhibits peaks at ∼38.1°, 44.2° and 64.4° attributed respectively to diffraction from (111), (200) and (220) planes of metallic silver with FCC lattice (JCPDS No. 04-0783). From broadening of the principal XRD peak at ∼38.1° of an as-grown sample (shown in the inset), the average crystallite size has been estimated using Scherrer equation to be ∼14.4 nm. The value is in excellent agreement with that obtained from the TEM analysis.
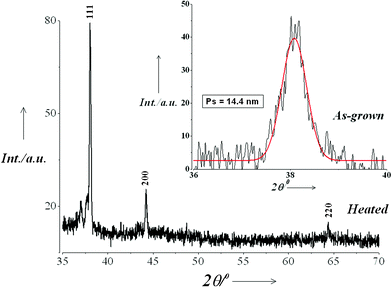 | ||
| Fig. 4 XRD pattern recorded in the 2θ range 20°–70°of sample C drop cast on a glass slide and heated to remove the organic moieties present in the sample. Inset: Particle size estimation from XRD peak broadening of an as-grown sample. | ||
Antibacterial activity
The antibacterial activity of Ag-np sols was studied using the model organism E.coli BW25113. Fig. 5 shows a log-normal plot of surviving bacterial colonies of E.coli relative to that of the control vs. dose of Ag nanoparticles, synthesized (a) via the fungal route9 and (b) using cysteine. In either case, the cell numbers dropped steadily with the increasing dosage of silver nanoparticles. Similar trends were also obtained from the decreasing saturation-OD values by spectrophotometry (see ESI†). MIC and MBC values were estimated for both the samples and have been pointed out on the respective graphs. Since the MBC values for either case falls within four times of their respective MIC values, both may be classically termed as bactericidal agents according to the definition given in ref. 12. The insert in Fig. 5 shows how a typical culture and control looks like after administration of different dosage of Ag nanoparticles. In both cases, the MIC and MBC values are significantly lower than those published in earlier reports,9,13,14 confirming the efficacy of the silver nanoparticles synthesized by these techniques. The higher antibacterial activity of cysteine capped and fungus-synthesized Ag-nps was possibly due to the contribution of capping agents of biological origin that played a synergistic role in the activity. This observation is in agreement with the reports by Parashar et al. on Psidium guajava extract capped Ag-nps.15 They demonstrated that silver nanoparticles with organic capping agents were able to anchor to the bacterial cell wall more effectively and in shorter time compared to hydrazine reduced Ag nps.15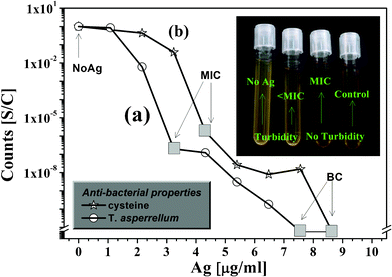 | ||
| Fig. 5 Log-normal plot of surviving bacterial colonies relative to that of the control vs. dose of Ag nanoparticles synthesized (a) via a fungal route and (b) using cysteine. Inset: Digital photograph of the controls and culture supplemented with different dosage of Ag nanoparticles. | ||
On a comparative note, MIC and MBC values of Ag-nps synthesized via a fungal route are slightly lower by 1.08 μg ml−1 than those of cysteine capped Ag-nps. The small difference in antibacterial efficacies of the two systems is again attributed to the difference in the nature of their capping molecules that played a significant role. Therefore, we report an exceedingly high bactericidal potency of Ag-nps synthesized by a novel fungal route that employs a non-pathogenic bio-control agent T. asperellum.9 We also report (almost) equally low MIC and MBC values for cysteine stabilized nano-silver particles prepared by a hassle-free bio-mimetic chemical route.
Studies on other bacteria
The growth inhibitory effect of cysteine capped Ag-nps was tested against different bacteria, namely Klebsiella, Pseudomonas, and a Gram positive organism Staphylococcus. The growth response of each of these organisms against different doses of Ag sol in terms of the appearance of turbidity upon overnight incubation at 37 °C, was noted. MIC values were estimated by visual inspection of turbidity and were used as an index for comparing the antibacterial efficacy of Ag-nps against these pathogenic strains. Fig. 6 shows the MIC values obtained against the different bacteria. The highest MIC was obtained against Staphylococcus. This observation may be explained on the basis of thicker peptidoglycan layer on the cell wall of Gram positive bacteria16 which provided protection and resistance against nanoparticle mediated toxicity as compared to their Gram negative counterparts like E. coli.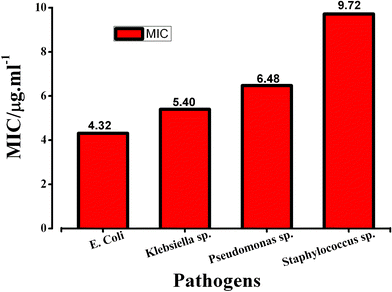 | ||
| Fig. 6 Comparison of antibacterial activity of cysteine capped Ag-nps against different pathogenic strains. | ||
![[thin space (1/6-em)]](https://www.rsc.org/images/entities/b_char_2009.gif) :
:![[thin space (1/6-em)]](https://www.rsc.org/images/entities/b_char_2009.gif) cysteine ratio on the stability of Ag sols.
It has been observed that stability and dispersibility of the silver sols depends strongly on the relative concentration of cysteine and AgNO3. The sol obtained by reacting 0.1 mM of cysteine with 1 mM AgNO3 remained stable for more than a month. When [cysteine]/[Ag] was increased from 0.1 to 1 in the case of sample D, flocculation started almost instantaneously and silver particles precipitated within a short time. On the other hand, the reduction of cysteine concentration from 0.1 mM to 0.01 mM (sample B) and 0.001 mM (sample A) also decreased the stability of the metal sols. After remaining stable for ∼2 days, precipitation of brownish gray particles started in sample B that continued for l week. In contrast, very fine particulates were observed for sample A. Fig. S2 in the ESI† shows the UV-vis spectra of samples A and B recorded after ageing. Although both the spectra exhibit the typical silver plasmon peak at ∼400 nm due to the formation of Ag-nps, the low absorbance values are indicative of a small amount of the dispersed phase in the sols. The hump at ∼540 nm is due to agglomeration of particles.
cysteine ratio on the stability of Ag sols.
It has been observed that stability and dispersibility of the silver sols depends strongly on the relative concentration of cysteine and AgNO3. The sol obtained by reacting 0.1 mM of cysteine with 1 mM AgNO3 remained stable for more than a month. When [cysteine]/[Ag] was increased from 0.1 to 1 in the case of sample D, flocculation started almost instantaneously and silver particles precipitated within a short time. On the other hand, the reduction of cysteine concentration from 0.1 mM to 0.01 mM (sample B) and 0.001 mM (sample A) also decreased the stability of the metal sols. After remaining stable for ∼2 days, precipitation of brownish gray particles started in sample B that continued for l week. In contrast, very fine particulates were observed for sample A. Fig. S2 in the ESI† shows the UV-vis spectra of samples A and B recorded after ageing. Although both the spectra exhibit the typical silver plasmon peak at ∼400 nm due to the formation of Ag-nps, the low absorbance values are indicative of a small amount of the dispersed phase in the sols. The hump at ∼540 nm is due to agglomeration of particles.
Zeta potential serves as the stability index of a colloidal solution. According to the DVLO theory on the stability of colloids, the repulsive force between two colloidal particles prevents them from coming closer and coagulating. This repulsive force is proportional to the square of the zeta potential. Hence, the higher the magnitude of zeta potential, the higher the stability of the colloids. To understand how the stability of cysteine capped Ag sols gets affected by relative concentration of cysteine to AgNO3, zeta potential (ζ) and DLS measurements were carried out on all 4 samples (before the onset of precipitation for samples A, B and C and immediately after mixing the reactants for sample D). The pH of the medium was also recorded since it influenced the overall surface charge on the nanoparticles. Table 2 summarizes the ζ values and the mean effective particle sizes (hydrodynamic diameter) for the different samples as estimated by DLS. Sample C exhibited the highest ζ value of +18 mV and was most stable in the series. Moreover, the mean DLS-estimated particle size of 110 nm in sample C was the least among all the sols studied. The average particle size of sample C estimated by light scattering is in good agreement with that obtained from TEM image analysis (see Fig. S1, ESI†). Other sols had ζ values ranging between −10 mV to 10 mV and hence exhibited poor stability. It may be noted that the particle size of sample A could not be recorded with adequate reproducibility due to the very small concentration of Ag-nps in the sol and fluctuations in the scattered light.
Bare silver nanoparticles dispersed in water are negatively charged10 due to their micellar characteristics. Negative surface charge on nanoparticles of samples A and B as adjudged from ζ values hinted on the possibility of these particles being inadequately capped. At low relative concentrations of cysteine, not enough capping-molecules were available to stabilize the silver nanoparticles. Moreover at pH range 5.1–5.7, close to IEP of cysteine (pH = 5.02), low negative ζ values indicated instability of the particles. With increasing concentration of cysteine, the pH of the medium became more and more acidic due to liberation of H+ according to the equation given below:
| cysteine + 2AgNO3 cysteine (ox.) + 2Ag + 2HNO3 | (ii) |
The high positive ζ value of sample C probably resulted from the protonation of amine groups in the adsorbed cysteine molecules at pH 3.8. The net surface charge on capped nanoparticles was adequate enough to prevent their further growth and agglomeration, thereby resulting in extended stability of the sol for more than 1 month. At a still higher concentration of cysteine and at pH 3.2, sample D exhibited a small positive ζ value indicating that the nanoparticles were still capped by protonated cysteine but the stability of the sol was greatly reduced. Due to rapid reduction of AgNO3 at higher concentrations of the reducing agent (here it is cysteine), fewer nucleation centres survived that rapidly grew in size and the particles so formed coalesced into large lumps of material that tend to settle down under gravity. Aggregation of silver nanoparticles in sample D was reflected in its extremely low ζ value. Similar observations have been reported independently by different research groups for surfactant stabilized silver nanoparticles.5–8,10 Of the three sols with limited stability, sample D was particularly interesting because it produced particles with completely different non-spherical morphology and exhibited a significant shift in the plasmon peak position compared to the others. Hence, it was studied in detail. Fig. 7 shows the SEM image of prismatic agglomerates obtained from the precipitation of sample D. The agglomerates exhibit morphology that is entirely different from the pseudo-spherical nanoparticles of sample C (see TEM image in Fig. 3). The principal plasmon band of sample D appears at ∼354 nm [see inset (b) of Fig. 7]. The significant blue shift of the band compared to the other sols has been attributed to non-spherical silver nanoparticles.6–8,10–11,17 A small hump at ∼485 nm is associated with extensive agglomeration of the crystallites17 that resulted in larger particulates. Inset (a) in the figure shows the XRD pattern of a heated sample D, with characteristic peaks of metallic silver with a cubic lattice. Average crystallite size has been estimated from the broadening of the 111 peak of the as-synthesized sample using the Scherrer equation to be ∼17.5 nm.
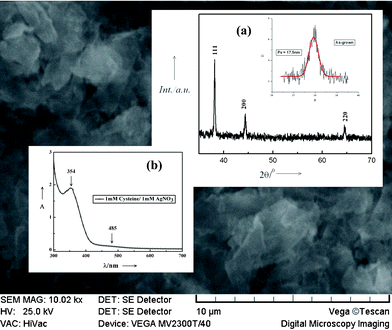 | ||
| Fig. 7 SEM micrograph of the sample D. Inset (a): XRD pattern of the heated and as-synthesized sample D, (b) UV-vis spectrum of the same sample. | ||
| [Cysteine] (mM) | Zeta potential (mV) | Mean effective particle size by DLS (nm) | pH | Stability of sol |
|---|---|---|---|---|
| 0.001(A) | −9.3 | — | 5.7 | poor |
| 0.01(B) | −10.6 | 270 | 5.1 | poor |
| 0.1(C) | 18.1 | 110 | 3.8 | good |
| 1(D) | 7.4 | 420 | 3.2 | Quick precipitation |
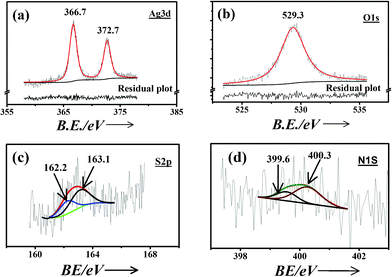 | ||
| Fig. 8 XPS spectra of (a) Ag3d, (b) O1s, (c) S2p and (d) N1s for cysteine capped Ag-nps along with the deconvoluted features. | ||
Fig. 9 shows the Raman spectrum of sample C drop cast on a silicon single crystal. Inset shows the same spectrum magnified in the range 150–350 cm−1. The spectrum exhibits peaks at ∼227, 250 and 260 cm−1. The peaks at ∼227 and 250 cm−1 have been attributed to Ag–S and Ag–N stretching vibrations20 due to the formation of covalent bonds between the Ag-nps and nitrogen atom of the amino group and sulphur atom of the thiolate group.
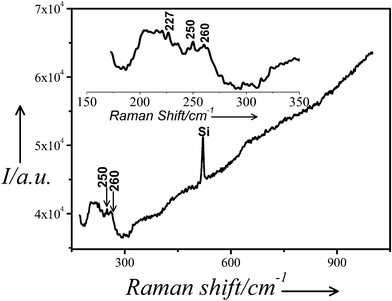 | ||
| Fig. 9 Raman spectrum of the sample C drop cast on silicon single crystal. Inset: The same spectrum magnified in the range 150–350 cm−1. | ||
Further evidence of metal cysteine bonding is derived from the FTIR spectra recorded on solid nanoparticle samples obtained after centrifugation. Fig. 10 shows the FTIR spectra of (a) pure cysteine powder and (b) cysteine capped Ag-nps. The peak at ∼2080 cm−1 is assigned to N–H stretching vibrations of the NH3+ group in the cysteine molecule and that at ∼2552 cm−1 to S–H vibration in the thiol group. The N–H stretching band of the amino group shifts to the lower wavenumbers and the peak due to S–H vibration almost vanishes for the nanoparticle sample. Absence of the S–H band in the spectrum of the Ag-nps may be attributed to the deprotonation of the thiol group in the cysteine molecule that is the pre-requisite for the formation of Ag–S bonding in the cysteine-capped Ag-nps. Moreover, peaks due to C–S and COO− stretching vibrations shift to the lower wavenumbers and increase in intensity. The shift in the peak positions and change in their intensity clearly suggests that there exists a bonding interaction between the Ag-nps and either or all the three S−, COO− and NH3+ groups of the capping cysteine molecules. Earlier, Mandal et.al.21 reported on the capping of Ag-nps by cysteine molecules via thiolate linkages. Thakur et al.22 discussed the possibility of all the three Ag–S, Ag–N and Ag–O linkages at the same time. However, all these studies were carried out in alkaline pH and strong reducing agents like NaBH4 and Na2S were used to produce Ag-nps. In contrast, cysteine has been used as the sole reducing and capping agent in our method and Ag-nps were produced in mildly acidic pH in a green chemical approach. Jing et al. extensively studied the adsorption of L-cysteine molecules on gold and silver nanoparticles by both surface enhanced resonance Raman spectroscopy and DFT calculations.23 They showed that the interaction of Ag-nps with L-cysteine, especially in the presence of NO3− takes place primarily through carboxylate and amino groups. However, a few molecules may exist in the PH and PN conformations as well. Based on spectroscopic evidences and input from the literature, it may be safely concluded that the capping of Ag-nps by cysteine in our samples took place through either or all the three thiolate, amino and carboxylate linkages via PH conformation as shown in the insets of Fig. 10. The dual role of cysteine both as a reducing and capping molecule in the preparation of Ag-nps was thus firmly established.
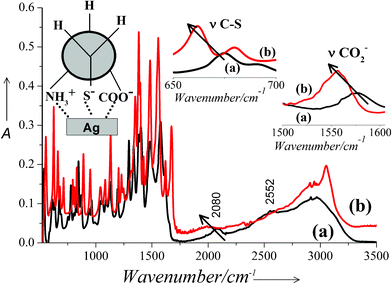 | ||
| Fig. 10 FTIR spectra of (a) pure cysteine powder and (b) cysteine capped Ag-nps. Insets: Magnified region of the spectra showing νC-S and νCO2− vibrations. | ||
4. Conclusions
The feasibility of synthesizing stable silver nanoparticles using cysteine in a biomimetic approach has been amply demonstrated in the manuscript. The dual role of cysteine as the reducing and capping molecule has been established. Capping of the nanoparticles took place via covalent bonding of either or all the three thiolate, amino and carboxylate groups of the cysteine molecule. The silver sol produced by reacting 0.1 mM of cysteine with 1 mM of AgNO3 was stable for over 1 month. It exhibited excellent antibacterial efficacy against a number of pathogens. The MIC value registered against E.coli was one of the lowest reported in the literature and was comparable with that of Ag-nps obtained via fungal route. The particle sizes are also comparable in the two cases, signifying that the products synthesized by cysteine and obtained by the fungal route mimic each other in terms of morphology and properties.In spite of the aforementioned advantages of our bio-mimetic approach over the conventional biological syntheses, the maximum stability of the sol that could be synthesized using cysteine was over 1 month as against over 1 year (in darkness) for sols synthesized by T. asperellum.9 This underlines the applicability and significance of biosynthesis, despite it being elaborate and involved. Our immediate outlook is to find an appropriate water soluble and bio compatible capping agent that would stabilize silver nanoparticles for longer periods.
Acknowledgements
We graciously acknowledge the support rendered by K. K. Pandey of High Pressure & Synchrotron Radiation Physics Division in acquiring Raman spectra, Ms. Alka Gupta of Molecular Biology Division for transmission electron microscopy, K. K. Singh of Radiation and Photo-Chemistry Division for taking FTIR measurements and Bhaskar Paul of Materials Processing Division for EDS measurements. All the above colleagues are from Bhabha Atomic Research Centre, Mumbai, India.References
- S. Shrivastava, T. Bera, A. Roy, G. Singh, P. Ramachandrarao and D. Dash, Nanotechnology, 2007, 18, 225103 CrossRef.
- S. Schultz, D. R. Smith, J. J. Mock and D. A. Schultz, Proc. Natl. Acad. Sci. U. S. A., 2000, 97, 996–1001 CrossRef CAS.
- R. M. Crooks, M. Zhao, L. Sun, V. Chechik and L. K. Yeung, Acc. Chem. Res., 2001, 34, 181–190 CrossRef CAS.
- D. I. Gittins, D. Bethell, D. J. Schiffrin and R. J. Nichols, Nature, 2000, 408, 67–69 CrossRef CAS.
- K. J. Lee, B. H. Jun, J. Choi, Y. I. Lee, J. Joung and Y. S. Oh, Nanotechnology, 2007, 18, 335601 CrossRef.
- F.-K. Liu, F.-H. Ko, P.-W. Huang, C.-H. Wu and T.-C. Chu, J. Chromatogr., A, 2005, 1062, 139–145 CrossRef CAS.
- A. Ahmad, P. Mukherjee, S. Senapati, D. Mandal, M. I. Khan, R. Kumar and M. Sastry, Colloids Surf., B, 2003, 28, 313–318 CrossRef CAS.
- D. Mandal, M. E. Bolander, D. Mukhopadhyay, G. Sarkar and P. Mukherjee, Appl. Microbiol. Biotechnol., 2006, 69, 485–492 CrossRef CAS.
- P. Mukherjee, M. Roy, B. P. Mandal, G. K. Dey, P. K. Mukherjee, J. Ghatak, A. K. Tyagi and S. P. Kale, Nanotechnology, 2008, 19, 075103 CrossRef CAS.
- W. Wang and B. Gu, in Concentrated Dispersions, American Chemical Society, Washington, DC, 2009, 1–14 Search PubMed.
- R. Mitrić, J. Petersen, A. Kulesza, V. Bonačić-Koutecký, T. Tabarin, I. Compagnon, R. Antoine, M. Broyer and P. Dugourd, Chem. Phys., 2008, 343, 372–380 CrossRef.
- G. L. French, J. Antimicrob. Chemother., 2006, 58, 1107–1117 CrossRef CAS.
- I. Sondi and B. Salopek-Sondi, J. Colloid Interface Sci., 2004, 275, 177–182 CrossRef CAS.
- P. Gong, H. Li, X. He, K. Wang, J. Hu, W. Tan, S. Zhang and X. Yang, Nanotechnology, 2007, 18, 285604 CrossRef.
- U. K. Parashar, V. Kumar, T. Bera, P. S. Saxena, G. Nath, S. K. Srivastava, R. Giri and A. Srivastava, Nanotechnology, 2011, 22, 415104 CrossRef.
- R. Y. Stanier, J. L. Ingraham, M. L. Wheelis and P. R. Painter, General Microbiology, 5th Edn, chapter 6, p. 158 Search PubMed.
- M. Popa, T. Pradell, D. Crespo and J. M. Calderón-Moreno, Colloids Surf., A, 2007, 303, 184–190 CrossRef CAS.
- G. Xue, Q. Dai and S. Jiang, J. Am. Chem. Soc., 1988, 110, 2393–2395 CrossRef CAS.
- M. Furutani and K. Kudo, J. Mater. Chem., 2012, 22, 3139–3147 RSC.
- X. Shen, H. Liang, J. Guo, C. Song, Xi-W. He and Yu-Z. Yuan, J. Inorg. Biochem., 2003, 95(2–3), 124–130 CrossRef CAS.
- S. Mandal, A. Gole, N. Lala, R. Gonnade, V. Ganvir and M. Sastry, Langmuir, 2001, 17, 6262–6268 CrossRef CAS.
- P. Thakur, S. S. Joshi, S. Kapoor and T. Mukherjee, Langmuir, 2009, 25, 6377–6384 CrossRef CAS.
- C. Jing and Y. Fang, Chem. Phys., 2007, 332, 27–32 CrossRef CAS.
Footnote |
| † Electronic supplementary information (ESI) available. See DOI: 10.1039/c2ra00785a |
| This journal is © The Royal Society of Chemistry 2012 |
