DOI:
10.1039/C2RA00050D
(Paper)
RSC Adv., 2012,
2, 5271-5276
Growth, structure and spectral properties of Cr3+-doped LiMgAl(MoO4)3 crystals with a disordered structure†
Received
9th January 2012
, Accepted 1st April 2012
First published on 2nd April 2012
Abstract
In order to obtain new, more efficient tunable laser materials for diode laser-pumping, a laser host material with broad absorption and emission bands is very important. This paper reports on the growth, structure and spectral properties of Cr3+:LiMgAl(MoO4)3 crystals. The Cr3+:LiMgAl(MoO4)3 crystals were grown using the top-seeded solution growth (TSSG) method from a flux of Li2Mo3O10. The LiMgAl(MoO4)3 crystals crystallize in a triclinic symmetry with the space group P![[1 with combining macron]](https://www.rsc.org/images/entities/char_0031_0304.gif) and have a highly disordered structure. The investigated spectral properties indicated that the Cr3+-doped LiMgAl(MoO4)3 crystals exhibited broad absorption and emission bands which are attributed to locally disordered environments around the Cr3+ centers. The spectral properties suggested that Cr3+-doped LiMgAl(MoO4)3 crystals are a potential candidate for a tunable laser crystal material.
and have a highly disordered structure. The investigated spectral properties indicated that the Cr3+-doped LiMgAl(MoO4)3 crystals exhibited broad absorption and emission bands which are attributed to locally disordered environments around the Cr3+ centers. The spectral properties suggested that Cr3+-doped LiMgAl(MoO4)3 crystals are a potential candidate for a tunable laser crystal material.
1. Introduction
Tunable solid-state lasers have a wide field of applications in medicine, ultra short pulse generation, the environment and communication.1,2 With the development of diode-pumped solid-state lasers, research on Cr3+-doped tunable solid-state laser crystals with more efficient and broader emission bands has generated much interest.3,4 Recently, Cr3+-doped molybdate crystals have received much attention because of their interesting spectral properties.5–14 It is found that in Cr3+-doped molybdate crystals the disordered structure can result in a more broad emission band.15 Therefore, to explore crystals with disordered structures is important for Cr3+-doped tunable solid-state laser crystals. The ternary molybdate compound LiMgAl(MoO4)3 was discovered in 1992.16 If the Al3+ ions could be substituted by Cr3+ ions in the LiMgAl(MoO4)3 compound, then could it be considered as a potential tunable solid-state crystal with an efficient and broad emission band? To our knowledge, the structural details and crystal growth of this compound have not been reported. This paper reports the growth, structure and spectral properties of Cr3+ doped LiMgAl(MoO4)3 crystals.
2. Experimental
2.1. Crystal growth
The Cr3+:LiMgAl(MoO4)3 crystals were grown using the top seeded solution growth (TSSG) method from a flux of Li2Mo3O10 in a vertical tubular furnace. The furnace temperature was controlled by an AL-708 controller with a controlling accuracy of ±0.1 K. The raw materials were weighed according to the molar ratio of LiMgAl(MoO4)3 to Li2Mo3O10, which is 2![[thin space (1/6-em)]](https://www.rsc.org/images/entities/char_2009.gif) :
:![[thin space (1/6-em)]](https://www.rsc.org/images/entities/char_2009.gif) 1. The chemicals used were analytical-grade Li2CO3, MgO, Al2O3 and MoO3 as well as Cr2O3 with a 99.99% purity. The growing procedure is as follows: the weighed raw materials were ground thoroughly and then put into a platinum crucible with dimensions of Ø50 × 60 mm2. The fully charged crucible was then placed into the furnace and kept at 900 °C for 48 h to make sure the solution melted completely and homogeneously. Initially, a platinum wire as a seed was soaked in the solution, and then the temperature was reduced by 10 K day−1 from 1123 K to 923 K. Then the crystals grown on the platinum wire were pulled out of the solution and cooled down to room temperature at a rate of 20 K h−1. In the second growth run, the saturation temperature was determined to be exactly 1033 K by the repeated seeding trials. Then a seed cut from the as-grown crystal was dipped into the solution. The crystal was grown at a cooling rate of 1 K day−1 and a rotating rate of 45 rpm. When growth ended, the grown crystals were pulled out of the solution and cooled slowly to room temperature at a cooling rate of 15 K h−1. A transparent crystal with dimensions of 21.2 × 13.3 × 5.3 mm3 was obtained, which exhibited well-developed faces, as shown in Fig. 1(a). The morphology of the crystal was simulated with the Bravais–Friedel and Donnay–Harker based WinXMorph software (Fig. 1(b)).17
1. The chemicals used were analytical-grade Li2CO3, MgO, Al2O3 and MoO3 as well as Cr2O3 with a 99.99% purity. The growing procedure is as follows: the weighed raw materials were ground thoroughly and then put into a platinum crucible with dimensions of Ø50 × 60 mm2. The fully charged crucible was then placed into the furnace and kept at 900 °C for 48 h to make sure the solution melted completely and homogeneously. Initially, a platinum wire as a seed was soaked in the solution, and then the temperature was reduced by 10 K day−1 from 1123 K to 923 K. Then the crystals grown on the platinum wire were pulled out of the solution and cooled down to room temperature at a rate of 20 K h−1. In the second growth run, the saturation temperature was determined to be exactly 1033 K by the repeated seeding trials. Then a seed cut from the as-grown crystal was dipped into the solution. The crystal was grown at a cooling rate of 1 K day−1 and a rotating rate of 45 rpm. When growth ended, the grown crystals were pulled out of the solution and cooled slowly to room temperature at a cooling rate of 15 K h−1. A transparent crystal with dimensions of 21.2 × 13.3 × 5.3 mm3 was obtained, which exhibited well-developed faces, as shown in Fig. 1(a). The morphology of the crystal was simulated with the Bravais–Friedel and Donnay–Harker based WinXMorph software (Fig. 1(b)).17
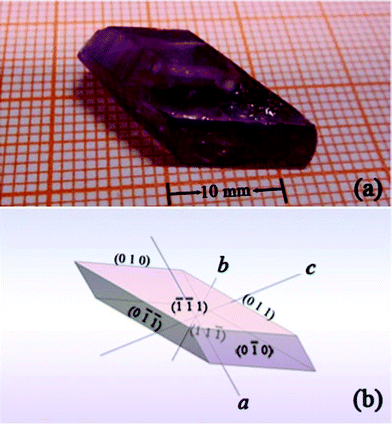 |
| | Fig. 1 (a) A Cr3+:LiMgAl(MoO4)3 crystal with dimensions of 21.2 × 13.3 × 5.3 mm3 grown by the TSSG method. (b) Simulated morphology schemes of the Cr3+:LiMgAl(MoO4)3 crystal. The facets are marked by Miller indices (hkl). | |
In order to further confirm the crystals grown, the contents of Li, Mg, Al, Mo and Cr atoms in the Cr3+:LiMgAl(MoO4)3 crystal were measured by inductively coupled plasma atomic emission spectrometry (ICP-AES). The results are listed in Table 1. The measured molar ratio of Li![[thin space (1/6-em)]](https://www.rsc.org/images/entities/char_2009.gif) :
:![[thin space (1/6-em)]](https://www.rsc.org/images/entities/char_2009.gif) Mg
Mg![[thin space (1/6-em)]](https://www.rsc.org/images/entities/char_2009.gif) :
:![[thin space (1/6-em)]](https://www.rsc.org/images/entities/char_2009.gif) (Al + Cr)
(Al + Cr)![[thin space (1/6-em)]](https://www.rsc.org/images/entities/char_2009.gif) :
:![[thin space (1/6-em)]](https://www.rsc.org/images/entities/char_2009.gif) Mo is close to 1
Mo is close to 1![[thin space (1/6-em)]](https://www.rsc.org/images/entities/char_2009.gif) :
:![[thin space (1/6-em)]](https://www.rsc.org/images/entities/char_2009.gif) 1
1![[thin space (1/6-em)]](https://www.rsc.org/images/entities/char_2009.gif) :
:![[thin space (1/6-em)]](https://www.rsc.org/images/entities/char_2009.gif) 1
1![[thin space (1/6-em)]](https://www.rsc.org/images/entities/char_2009.gif) :
:![[thin space (1/6-em)]](https://www.rsc.org/images/entities/char_2009.gif) 3, which agrees with the composition of the LiMgAl(MoO4)3 compound. The ICP analysis confirmed that the crystals grown belonged to the Cr3+:LiMgAl(MoO4)3 crystal.
3, which agrees with the composition of the LiMgAl(MoO4)3 compound. The ICP analysis confirmed that the crystals grown belonged to the Cr3+:LiMgAl(MoO4)3 crystal.
Table 1 Summary of the elemental analysis results for the Cr3+:LiMgAl(MoO4)3 crystal using the ICP-AES technique
| |
|
|
(Al + Cr)a |
|
| Elements |
Li |
Mg |
Al |
Cr |
Mo |
|
The Al3+ ions were generally substituted by Cr3+ ions in the Cr3+-doped LiMgAl(MoO4)3 crystal.
|
| Required (wt%) |
1.28 |
4.52 |
5.01 |
0.097 |
53.49 |
| Measured (wt%) |
1.24 |
4.39 |
5.09 |
0.19 |
55.75 |
| Calculated molar number |
0.18 |
0.18 |
0.19 |
0.004 |
0.58 |
| Calculated molar ratio |
1.00 |
1.01 |
1.05 |
0.02 |
3.22 |
2.2. Crystal structure analysis
A crystal with approximate dimensions of 0.10 × 0.10 × 0.15 mm3 cut from the undoped LiMgAl(MoO4)3 crystal was selected for single crystal diffraction structure analysis. The diffraction data were collected on a Mercury 70 diffractometer equipped with graphite-monochromated Mo-Kα (λ = 0.71073 Å) at room temperature. A total of 2243 independent reflections were collected in the range of 3.11° < θ < 27.52°, of which 2093 with I ≥ 2σ(I) were independent. An absorption correction based on the empirical PSI-scan technique was applied. The structure was solved by direct methods and refined using the full-matrix least squares technique with the SHELXL97 program package.18 The final values of R = 0.0267 and wR = 0.0647 with the parameters w = 1/[σ2Fo2 + (0.0308P)2 + 0.9213P], where P = (Fo2 + 2Fc2)/3, (Δρ)max = 0.830, and (Δρ)min = −1.689 e/Å3, (Δ/σ)max = 0.001, and S = 1.126 were obtained. The details of the X-ray structure analysis are listed in Table 2. The atomic coordinates and thermal parameters are given in Table 3.
Table 2 Crystal data and structure refinement details for LiMgAl(MoO4)3 crystal
| Chemical formula |
LiMgAl(MoO4)3 |
| Formula mass/g mol−1 |
538.05 |
| Crystal system |
Triclinic |
|
a/Å |
6.6969(7) |
|
b/Å |
6.8104(5) |
|
c/Å |
11.3290(7) |
|
α (°) |
77.597(19) |
|
β (°) |
85.79(2) |
|
γ (°) |
77.94(2) |
| Unit cell volume/Å3 |
493.28(7) |
|
T/K |
293(2) |
| Space group |
P![[1 with combining macron]](https://www.rsc.org/images/entities/char_0031_0304.gif) |
|
Z
|
2 |
| Index ranges |
−8 ≤ h ≤ 8 |
| |
−8 ≤ k ≤ 8 |
| |
−14 ≤ l ≤ 14 |
| Reflections measured |
5690 |
| Independent reflections |
2243 |
|
R
int
|
0.0258 |
| Final R1 values (I > 2σ(I)) |
0.0267 |
| Final wR(F2) values (I > 2σ(I)) |
0.0647 |
| Final R1 values (all data) |
0.0294 |
| Final wR(F2) values (all data) |
0.0663 |
| Final wR(F2) values (I > 2σ(I)) |
0.0647 |
Table 3 Atomic coordinates (×104) and equivalent isotropic displacement parameters (Å2 × 10³) for the LiMgAl(MoO4)3 crystal
| Atom |
x
|
y
|
z
|
U
iso/Å2 |
occupancy |
| Mo(1) |
2525(1) |
951(1) |
3501(1) |
8(1) |
1 |
| Mo(2) |
2539(1) |
−3031(1) |
−505(1) |
9(1) |
1 |
| Mo(3) |
7975(1) |
7149(1) |
3103(1) |
10(1) |
1 |
| Mg(1)/Al(1) |
6959(2) |
2312(2) |
3743(1) |
6(1) |
0.575/0.425 |
| Mg(2)/Al(2) |
3027(2) |
1591(2) |
213(1) |
11(1) |
0.425/0.575 |
| Li(3) |
3259(11) |
5628(11) |
4115(7) |
20(2) |
1 |
| O(1) |
3955(4) |
2694(4) |
3840(2) |
12(1) |
1 |
| O(2) |
3005(4) |
−1506(4) |
4503(3) |
14(1) |
1 |
| O(3) |
7128(5) |
9480(5) |
3624(3) |
19(1) |
1 |
| O(4) |
−82(4) |
2004(5) |
3619(3) |
17(1) |
1 |
| O(5) |
2955(5) |
−5523(5) |
387(3) |
21(1) |
1 |
| O(6) |
3160(4) |
602(5) |
2037(3) |
16(1) |
1 |
| O(7) |
−34(5) |
−1930(5) |
−438(3) |
24(1) |
1 |
| O(8) |
7475(5) |
7581(5) |
1573(3) |
21(1) |
1 |
| O(9) |
3186(5) |
−3151(5) |
−2018(3) |
18(1) |
1 |
| O(10) |
3877(4) |
−1352(4) |
25(3) |
14(1) |
1 |
| O(11) |
10![[thin space (1/6-em)]](https://www.rsc.org/images/entities/char_2009.gif) 564(5) 564(5) |
6402(5) |
3297(3) |
25(1) |
1 |
| O(12) |
6667(4) |
5147(4) |
3942(2) |
11(1) |
1 |
The LiMgAl(MoO4)3 crystallizes in the triclinic system with the space group P![[1 with combining macron]](https://www.rsc.org/images/entities/char_0031_0304.gif) . The unit cell parameters of LiMgAl(MoO4)3 are a = 6.6969(7) Å, b = 6.8104(5) Å, c = 11.3290(7) Å, α = 77.597(19)°, β = 85.79(2)°, γ = 77.94(2)°, and Z = 2. The structure of the LiMgAl(MoO4)3 crystal is illustrated in Fig. 2 and Fig. 3. This crystal has a highly disordered structure. The magnitude of temperature factors and the valence charge equilibrium after least-squares refinement indicates to the existence of a statistic distribution of Mg and Al atoms. Each Mg(Al) is coordinated by six oxygen atoms to form a distorted octahedron. The occupancy ratio of Mg and Al in the Mg(Al)O6 octahedron is 0.575/0.425 and 0.425/0.575 for the Mg(1)/Al(1)O6 and Mg(2)/Al(2)O6 octahedra, respectively. Such a disordered structure can result in broad absorption and emission bands in laser materials.15,19 Thereby, when the Cr3+ ions were doped into the LiMgAl(MoO4)3 crystal to replace the Al3+ ion, the Cr3+:LiMgAl(MoO4)3 crystal created broad absorption and emission bands.
. The unit cell parameters of LiMgAl(MoO4)3 are a = 6.6969(7) Å, b = 6.8104(5) Å, c = 11.3290(7) Å, α = 77.597(19)°, β = 85.79(2)°, γ = 77.94(2)°, and Z = 2. The structure of the LiMgAl(MoO4)3 crystal is illustrated in Fig. 2 and Fig. 3. This crystal has a highly disordered structure. The magnitude of temperature factors and the valence charge equilibrium after least-squares refinement indicates to the existence of a statistic distribution of Mg and Al atoms. Each Mg(Al) is coordinated by six oxygen atoms to form a distorted octahedron. The occupancy ratio of Mg and Al in the Mg(Al)O6 octahedron is 0.575/0.425 and 0.425/0.575 for the Mg(1)/Al(1)O6 and Mg(2)/Al(2)O6 octahedra, respectively. Such a disordered structure can result in broad absorption and emission bands in laser materials.15,19 Thereby, when the Cr3+ ions were doped into the LiMgAl(MoO4)3 crystal to replace the Al3+ ion, the Cr3+:LiMgAl(MoO4)3 crystal created broad absorption and emission bands.
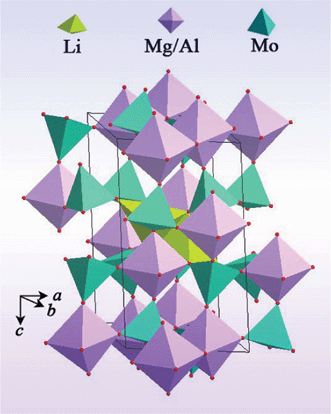 |
| | Fig. 2 A view of the structural unit of the LiMgAl(MoO4)3 crystal. | |
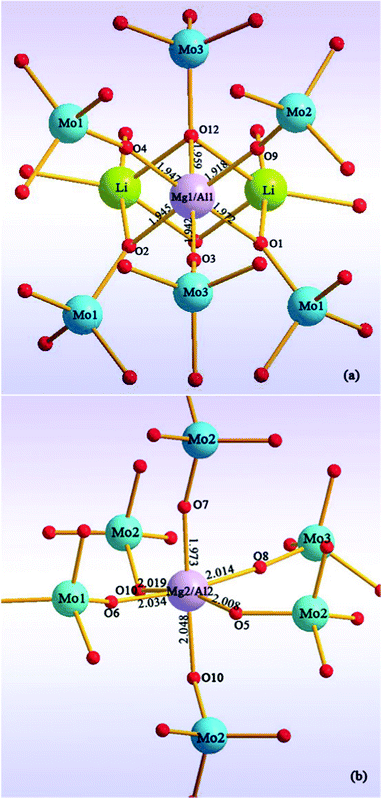 |
| | Fig. 3 A view of the coordination environment of Mg/Al atoms. | |
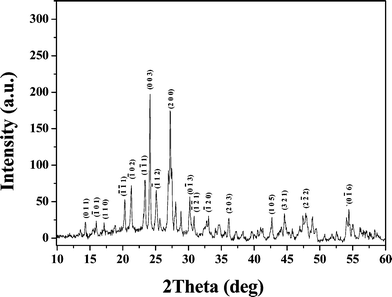
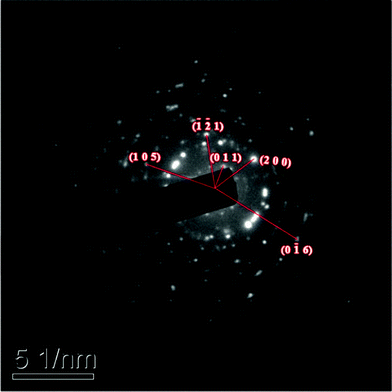
Fig. 4 shows the powder X-ray diffraction pattern of the Cr3+:LiMgAl(MoO4)3 crystal, which was determined using a Rigaku DMAX2500 diffractometer with Cu-Kα (λ = 1.54056 Å) radiation. The powder electron diffraction pattern of the Cr3+:LiMgAl(MoO4)3 crystal was determined using a JEM-2010 transmission electron microscope, as shown in Fig. 5. The indexed powder electron diffraction pattern of the Cr3+:LiMgAl(MoO4)3 crystal further confirmed the XRD result.
2.3. Spectral properties
A cuboid sample with dimensions of 6.9 × 5.8 × 2.3 mm3 was cut from the as-grown Cr3+:LiMgAl(MoO4)3 crystals. The absorption spectrum was measured by a spectrophotometer (Lambda35, PerkinElmer) in a range of 400–900 nm. The fluorescence spectrum was recorded by another spectrophotometer (FL920, Edinburgh), where a xenon lamp was equipped as the excitation source. Detection of the signals was achieved with a photomultiplier tube (R5509, Hamamatsu) in the near-infrared region. All of the spectral experiments were carried out at room temperature.
Fig. 6 shows the absorption spectrum of the Cr3+:LiMgAl(MoO4)3 crystal. Two broad absorption bands centered at 494 nm and 709 nm were observed, corresponding to Cr3+ transitions from the ground state 4A2 to the excited states 4T1 and 4T2, respectively. The existence of the two dips near 709 nm in the absorption band of the 4A2 → 4T2 transition were attributed to weak Fano anti-resonance which is due to 2E and 2T states superimposed on the 4A2 → 4T2 transition, which appears as a Fano anti-resonance structure.20,21 The absorption cross-section σabs can be obtained using the formula σabs = α/Nc, where α is the absorption coefficient and Nc is the concentration of the optically active ions. The measured Cr3+ concentration is 0.19 wt%, i.e. 8.14 × 1019 cm−3 in the Cr3+:LiMgAl(MoO4)3 crystal. Thus, the σabs are estimated to be 21 × 10−20 cm2 for the 4A2 → 4T1 transition and 23 × 10−20 cm2 for the 4A2 → 4T2 transition.
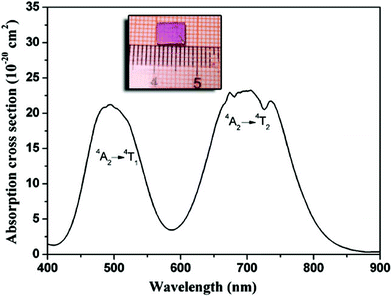 |
| | Fig. 6 Absorption spectrum of the Cr3+:LiMgAl(MoO4)3 crystal. The inset shows the polished cuboid sample for the spectral experiments. | |
The crystal field strength and Racah parameters Dq, B and C are important factors for tunable solid-state crystals, which can be derived from the absorption spectrum of the Cr3+:LiMgAl(MoO4)3 crystal. The value of Dq is obtained from the average peak energy of the 4A2 → 4T2 absorption:22
| |  | (1) |
The separation ΔE between the peaks of the 4A2 → 4T2 and 4A2 → 4T1 bands is used to calculate the B parameter from the formula:23
| |  | (2) |
From the value of Dq and ΔE = 6138.54 cm−1, the B value was calculated to be 633.61 cm−1. The Racah parameter C is derived by the following equation:
| |  | (3) |
Using the above expression, the value of the parameter C is 3341.34 cm−1. The Tanabe–Sugano diagram calculated from the above obtained values (C/B = 5.27) is given in Fig. 7. The vertical line indicates the Cr3+ ions crystal field Dq/B = 2.23. This value is clearly less than that of the crossing between the 2E and 4T2 levels (roughly 2.3), and denotes that the Cr3+:LiMgAl(MoO4)3 belongs to the low-field site crystals, so the lowest excited state is 4T2.
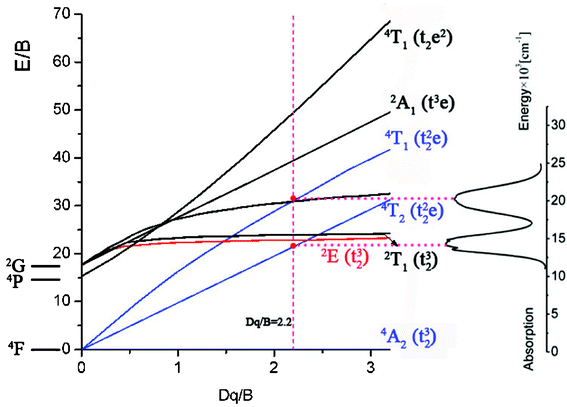 |
| | Fig. 7 Tanabe–Sugano diagram with the absorption transitions of Cr3+ in the Cr3+:LiMgAl(MoO4)3 crystal. | |
The fluorescence spectrum of the Cr3+:LiMgAl(MoO4)3 crystal is shown in Fig. 8. The observed spectrum is dominated by a broad band emission extending from 770 to 1330 nm, which is attributed to the 4T2 → 4A2 emission of Cr3+ ions located at low-field crystal sites. The most interesting feature of this fluorescence spectrum is the broad full width at half maximum (FWHM), 191 nm.
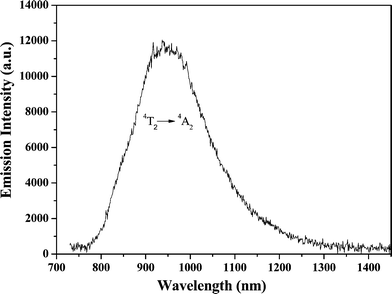 |
| | Fig. 8 Fluorescence spectrum of the Cr3+:LiMgAl(MoO4)3 crystal with an excitement wavelength of 690 nm at room temperature. | |
The emission cross section σe was determined using the formula:24
| |  | (4) |
where λ is the wavelength of the emission peak. n is the refractive index which was estimated to be 2.0 by an Abbe refractometer. Δν is the frequency at FWHM which was measured to be 6.82 × 10¹³ s−1, and τf is the fluorescence lifetime. The fluorescence lifetime was measured to be 27 μs at 300 K, thus, the emission cross section σe was calculated to be 3.0 × 1013 cm2 at 940 nm and 300 K.
3. Results and discussion
The Cr3+:LiMgAl(MoO4)3 crystal with dimensions of 21.2 × 13.3 × 5.3 mm3 was successfully grown using the TSSG method. The LiMgAl(MoO4)3 crystal belongs to the triclinic system with the space group P![[1 with combining macron]](https://www.rsc.org/images/entities/char_0031_0304.gif) . The unit cell parameters of LiMgAl(MoO4)3 are a = 6.6969(7) Å, b = 6.8104(5) Å, c = 11.3290(7) Å, α = 77.597(19)°, β = 85.79(2)°, γ = 77.94(2)°, and Z = 2. This crystal has a highly disordered structure.
. The unit cell parameters of LiMgAl(MoO4)3 are a = 6.6969(7) Å, b = 6.8104(5) Å, c = 11.3290(7) Å, α = 77.597(19)°, β = 85.79(2)°, γ = 77.94(2)°, and Z = 2. This crystal has a highly disordered structure.
The investigated spectral properties of the Cr3+:LiMgAl(MoO4)3 crystal show that the absorption and emission spectra of the Cr3+:LiMgAl(MoO4)3 crystal exhibit broad absorption and emission bands. In comparison with other Cr3+-doped molybdate crystals with an ordered structure (see Table 4), its absorption and emission bands are broader, which is attributable to locally disordered environments around the Cr3+ centers. Based on the absorption and emission spectra, the crystal field strength and Racah parameter have been calculated: Dq = 1413.8 cm−1, B = 634 cm−1, C = 3341 cm−1, and Dq/B = 2.23. The low value of Dq/B implies that the Cr3+ ions occupy the low-field crystal sites. In comparison with other Cr3+-doped molybdate crystals, the Cr3+:LiMgAl(MoO4)3 crystal has larger absorption and emission cross-sections.
Table 4 Spectral parameters of ordered and disordered molybdate crystals
| |
|
Dq/B |
B/cm−1 |
C/cm−1 |
FWHM/nm |
σ
e/10−20 cm2 |
τ
f/μs |
Ref. |
| Ordered crystals |
KAl(MoO4)2 |
2.55 |
586 |
3049 |
135 (π) |
2.39 |
33 |
25,12
|
| |
CsAl(MoO4)2 |
2.56 |
882 |
3066 |
147 |
4.27 |
21 |
26
|
| |
NaMg3Al(MoO4)5 |
2.13 |
676 |
2945 |
≈162 |
— |
— |
27
|
| Disordered crystals |
K0.6(Mg0.3Sc0.7)2(MoO4)3 |
2.18 |
651 |
2994 |
189 |
8.46 |
10 |
15
|
| |
LiMgAl(MoO4)3 |
2.23 |
634 |
3341 |
191 |
3.0 |
27 |
This work |
4. Conclusion
Since the Cr3+:LiMgAl(MoO4)3 crystal with a highly disordered structure has broad absorption and emission bands and larger absorption and emission cross-sections, the Cr3+:LiMgAl(MoO4)3 crystal may be regarded as a potential tunable laser medium.
Acknowledgements
This work is supported by the National Natural Science Foundation of China (No. 61008060) and the National Natural Science Foundation of Fujian Province (No. 2011J01376).
References
- S. Kück, Appl. Phys. B, 2001, 72, 515 CrossRef.
- T. A. Samtleben and J. Hulliger, Opt. Laser. Eng., 2005, 43, 251 CrossRef.
- R. Scheps, B. M. Gately, J. F. Myers, J. S. Krasinski and D. F. Heller, Appl. Phys. Lett., 1990, 56, 2288 CrossRef CAS.
- J. A. Skidmore, M. A. Emanuel, R. J. Beach, W. J. Benett, B. L. Freitas, N. W. Carlson and R. W. Soalrz, Appl. Phys. Lett., 1995, 66, 1163 CrossRef CAS.
- K. Hermanowicz, J. Alloys Compd., 2002, 341, 179 CrossRef CAS.
- K. Hermanowicz, M. Maczka, M. Deren, J. Hanuza, W. Strek and H. Drulis, J. Lumin., 2001, 92, 151 CrossRef.
- K. Hermanowicz, J. Hanuza, M. Maczka, P. J. Dereń, E. Mugeński, H. Drulis, I. Sokolska and J. Sokolnicki, J. Phys. Condens. Matter., 2001, 13, 5807 CrossRef CAS.
- A. Peña, R. Solé, J. Gavaldà, F. Massons, F. Díaz and M. Aguiló, Chem. Mater., 2006, 18, 442 CrossRef.
- G. J. Wang, X. M. Han, M. J. Song, Z. B. Lin, G. F. Wang and X. F. Long, Mater. Lett., 2007, 61, 3886 CrossRef CAS.
- A. J. Mao, X.Y. Kuang, H. Wang and X. F. Huang, J. Alloys Compd., 2008, 448, 6 CrossRef CAS.
- G. J. Wang, X. F. Long, L. Z. Zhang and G. F. Wang, J. Cryst. Growth, 2008, 310, 624 CrossRef CAS.
- G. J. Wang, X. F. Long, L. Z. Zhang, G. F. Wang, S. Polosan and T. Tsuboi, J. Lumin., 2008, 128, 1556 CrossRef CAS.
- G. J. Wang, Z. B. Lin, L. Z. Zhang, Y. S. Huang and G. F. Wang, J. Lumin., 2009, 129, 1398 CrossRef CAS.
- G. J. Wang, L. Z. Zhang, Z. B. Lin and G. F. Wang, J. Alloys Compd., 2010, 489, 293 CrossRef CAS.
- X. M. Meng, Z. B. Lin, L. Z. Zhang, Y. S. Huang and G. F. Wang, CrystEngComm, 2011, 13, 4069 RSC.
- N. M. Kozhevnikova and M. V. Mokhosoev, Russ. J. Inorg. Chem., 1992, 37, 1235 Search PubMed.
- W. Kaminsky, J. Appl Crystallogr., 2007, 40, 382 CrossRef CAS.
- G. M. Sheldrick, Acta Crystallogr. Sect. A: Found. Crystallogr., 2008, 64, 112 CrossRef.
- H. Li, G. J. Wang, L. Z. Zheng, Y. S. Huang and G. F. Wang, CrystEngComm, 2010, 12, 1307 RSC.
- U. Fano, Phys. Rev., 1961, 124, 1866 CrossRef CAS.
- U. Fano and J. W. Cooper, Phys. Rev., 1965, 137, A1364 CrossRef.
- Y. Tanabe and S. Sugano, J. Phys. Soc. Jpn., 1954, 9, 753 CrossRef CAS.
- M. Yamaga, B. Henderson and K. P. O'Donnell, Phys. Rev. B, 1992, 46, 3273 CrossRef CAS.
- X. F. Long, Z. B. Lin, Z. S. Hu and G. F. Wang, Chem. Phys. Lett., 2004, 392, 192 CrossRef CAS.
- G. J. Wang, X. M. Han, M. J. Song, Z. B. Lin, G. F. Wang and X. F. Long, Mater. Lett., 2007, 61, 3886 CrossRef CAS.
- G. J. Wang, L. Z. Zhang, Z. B. Lin and G. F. Wang, J. Alloys Compd., 2010, 489, 293 CrossRef CAS.
- K. Hermanowicz, M. Maczka, M. Wolcyrz, P. E. Tomaszewski, M. Pasciak and J. Hanuza, J. Solid State Chem., 2006, 179, 685 CrossRef CAS.
|
| This journal is © The Royal Society of Chemistry 2012 |
Click here to see how this site uses Cookies. View our privacy policy here. ![[1 with combining macron]](https://www.rsc.org/images/entities/char_0031_0304.gif) and have a highly disordered structure. The investigated spectral properties indicated that the Cr3+-doped LiMgAl(MoO4)3 crystals exhibited broad absorption and emission bands which are attributed to locally disordered environments around the Cr3+ centers. The spectral properties suggested that Cr3+-doped LiMgAl(MoO4)3 crystals are a potential candidate for a tunable laser crystal material.
and have a highly disordered structure. The investigated spectral properties indicated that the Cr3+-doped LiMgAl(MoO4)3 crystals exhibited broad absorption and emission bands which are attributed to locally disordered environments around the Cr3+ centers. The spectral properties suggested that Cr3+-doped LiMgAl(MoO4)3 crystals are a potential candidate for a tunable laser crystal material.![[thin space (1/6-em)]](https://www.rsc.org/images/entities/char_2009.gif) :
:![[thin space (1/6-em)]](https://www.rsc.org/images/entities/char_2009.gif) 1. The chemicals used were analytical-grade Li2CO3, MgO, Al2O3 and MoO3 as well as Cr2O3 with a 99.99% purity. The growing procedure is as follows: the weighed raw materials were ground thoroughly and then put into a platinum crucible with dimensions of Ø50 × 60 mm2. The fully charged crucible was then placed into the furnace and kept at 900 °C for 48 h to make sure the solution melted completely and homogeneously. Initially, a platinum wire as a seed was soaked in the solution, and then the temperature was reduced by 10 K day−1 from 1123 K to 923 K. Then the crystals grown on the platinum wire were pulled out of the solution and cooled down to room temperature at a rate of 20 K h−1. In the second growth run, the saturation temperature was determined to be exactly 1033 K by the repeated seeding trials. Then a seed cut from the as-grown crystal was dipped into the solution. The crystal was grown at a cooling rate of 1 K day−1 and a rotating rate of 45 rpm. When growth ended, the grown crystals were pulled out of the solution and cooled slowly to room temperature at a cooling rate of 15 K h−1. A transparent crystal with dimensions of 21.2 × 13.3 × 5.3 mm3 was obtained, which exhibited well-developed faces, as shown in Fig. 1(a). The morphology of the crystal was simulated with the Bravais–Friedel and Donnay–Harker based WinXMorph software (Fig. 1(b)).17
1. The chemicals used were analytical-grade Li2CO3, MgO, Al2O3 and MoO3 as well as Cr2O3 with a 99.99% purity. The growing procedure is as follows: the weighed raw materials were ground thoroughly and then put into a platinum crucible with dimensions of Ø50 × 60 mm2. The fully charged crucible was then placed into the furnace and kept at 900 °C for 48 h to make sure the solution melted completely and homogeneously. Initially, a platinum wire as a seed was soaked in the solution, and then the temperature was reduced by 10 K day−1 from 1123 K to 923 K. Then the crystals grown on the platinum wire were pulled out of the solution and cooled down to room temperature at a rate of 20 K h−1. In the second growth run, the saturation temperature was determined to be exactly 1033 K by the repeated seeding trials. Then a seed cut from the as-grown crystal was dipped into the solution. The crystal was grown at a cooling rate of 1 K day−1 and a rotating rate of 45 rpm. When growth ended, the grown crystals were pulled out of the solution and cooled slowly to room temperature at a cooling rate of 15 K h−1. A transparent crystal with dimensions of 21.2 × 13.3 × 5.3 mm3 was obtained, which exhibited well-developed faces, as shown in Fig. 1(a). The morphology of the crystal was simulated with the Bravais–Friedel and Donnay–Harker based WinXMorph software (Fig. 1(b)).17

![[thin space (1/6-em)]](https://www.rsc.org/images/entities/char_2009.gif) :
:![[thin space (1/6-em)]](https://www.rsc.org/images/entities/char_2009.gif) Mg
Mg![[thin space (1/6-em)]](https://www.rsc.org/images/entities/char_2009.gif) :
:![[thin space (1/6-em)]](https://www.rsc.org/images/entities/char_2009.gif) (Al + Cr)
(Al + Cr)![[thin space (1/6-em)]](https://www.rsc.org/images/entities/char_2009.gif) :
:![[thin space (1/6-em)]](https://www.rsc.org/images/entities/char_2009.gif) Mo is close to 1
Mo is close to 1![[thin space (1/6-em)]](https://www.rsc.org/images/entities/char_2009.gif) :
:![[thin space (1/6-em)]](https://www.rsc.org/images/entities/char_2009.gif) 1
1![[thin space (1/6-em)]](https://www.rsc.org/images/entities/char_2009.gif) :
:![[thin space (1/6-em)]](https://www.rsc.org/images/entities/char_2009.gif) 1
1![[thin space (1/6-em)]](https://www.rsc.org/images/entities/char_2009.gif) :
:![[thin space (1/6-em)]](https://www.rsc.org/images/entities/char_2009.gif) 3, which agrees with the composition of the LiMgAl(MoO4)3 compound. The ICP analysis confirmed that the crystals grown belonged to the Cr3+:LiMgAl(MoO4)3 crystal.
3, which agrees with the composition of the LiMgAl(MoO4)3 compound. The ICP analysis confirmed that the crystals grown belonged to the Cr3+:LiMgAl(MoO4)3 crystal.![[1 with combining macron]](https://www.rsc.org/images/entities/char_0031_0304.gif)
![[thin space (1/6-em)]](https://www.rsc.org/images/entities/char_2009.gif) 564(5)
564(5)![[1 with combining macron]](https://www.rsc.org/images/entities/char_0031_0304.gif) . The unit cell parameters of LiMgAl(MoO4)3 are a = 6.6969(7) Å, b = 6.8104(5) Å, c = 11.3290(7) Å, α = 77.597(19)°, β = 85.79(2)°, γ = 77.94(2)°, and Z = 2. The structure of the LiMgAl(MoO4)3 crystal is illustrated in Fig. 2 and Fig. 3. This crystal has a highly disordered structure. The magnitude of temperature factors and the valence charge equilibrium after least-squares refinement indicates to the existence of a statistic distribution of Mg and Al atoms. Each Mg(Al) is coordinated by six oxygen atoms to form a distorted octahedron. The occupancy ratio of Mg and Al in the Mg(Al)O6 octahedron is 0.575/0.425 and 0.425/0.575 for the Mg(1)/Al(1)O6 and Mg(2)/Al(2)O6 octahedra, respectively. Such a disordered structure can result in broad absorption and emission bands in laser materials.15,19 Thereby, when the Cr3+ ions were doped into the LiMgAl(MoO4)3 crystal to replace the Al3+ ion, the Cr3+:LiMgAl(MoO4)3 crystal created broad absorption and emission bands.
. The unit cell parameters of LiMgAl(MoO4)3 are a = 6.6969(7) Å, b = 6.8104(5) Å, c = 11.3290(7) Å, α = 77.597(19)°, β = 85.79(2)°, γ = 77.94(2)°, and Z = 2. The structure of the LiMgAl(MoO4)3 crystal is illustrated in Fig. 2 and Fig. 3. This crystal has a highly disordered structure. The magnitude of temperature factors and the valence charge equilibrium after least-squares refinement indicates to the existence of a statistic distribution of Mg and Al atoms. Each Mg(Al) is coordinated by six oxygen atoms to form a distorted octahedron. The occupancy ratio of Mg and Al in the Mg(Al)O6 octahedron is 0.575/0.425 and 0.425/0.575 for the Mg(1)/Al(1)O6 and Mg(2)/Al(2)O6 octahedra, respectively. Such a disordered structure can result in broad absorption and emission bands in laser materials.15,19 Thereby, when the Cr3+ ions were doped into the LiMgAl(MoO4)3 crystal to replace the Al3+ ion, the Cr3+:LiMgAl(MoO4)3 crystal created broad absorption and emission bands.



![[1 with combining macron]](https://www.rsc.org/images/entities/char_0031_0304.gif) . The unit cell parameters of LiMgAl(MoO4)3 are a = 6.6969(7) Å, b = 6.8104(5) Å, c = 11.3290(7) Å, α = 77.597(19)°, β = 85.79(2)°, γ = 77.94(2)°, and Z = 2. This crystal has a highly disordered structure.
. The unit cell parameters of LiMgAl(MoO4)3 are a = 6.6969(7) Å, b = 6.8104(5) Å, c = 11.3290(7) Å, α = 77.597(19)°, β = 85.79(2)°, γ = 77.94(2)°, and Z = 2. This crystal has a highly disordered structure.
