Titanium composite PBI-based membranes for high temperature polymer electrolyte membrane fuel cells. Effect on titanium dioxide amount
F. Javier
Pinar
,
Pablo
Cañizares
,
Manuel A.
Rodrigo
,
Diego
Ubeda
and
Justo
Lobato
*
Chemical Engineering Department, University of Castilla-La Mancha, Enrique Costa Building, Av. Camilo Jose Cela, n 12, E-13071, Ciudad Real, Spain. E-mail: Justo.Lobato@uclm.es; Fax: +34 926 29 52 56; Tel: +34 926 29 53 00 Ext: 6707
First published on 22nd December 2011
Abstract
The influence of different amounts of micro-sized titanium dioxide (anatase crystalline variety) dispersed into a polybenzimidazole membrane has been studied for its use as an electrolyte in high temperature polymer electrolyte membrane fuel cells. All of the membranes were cast from a polymer with the same molecular weight. The membranes were physicochemically and electrochemically characterized. From the membranes studied with different amounts of TiO2, the membrane that provided the best properties for its use as an electrolyte was the composite one which contained the lowest amount of filler. The composite membrane with 2 weight percent of the filler absorbed larger (absorbed acid: 2.42 gacid gmembrane−1) and leached lower (remaining acid: 0.78 gacid gmembrane−1) amounts of acid than the other composite and standard one. Because it has the largest acid and water absorption capability, the 2% TiO2-PBI showed also the highest ionic conductivity (0.043 S cm−1), measured out of the fuel cell. Fuel cell measurements and also stability tests (> 140 h) were made for the composite membrane with 2% of the filler and the results were compared with a standard polybenzimidazole fuel cell. The TiO2–PBI composite membrane showed the best performance and achieved a power density of 450 mW cm−1 at 175 °C. Moreover, the composite also showed the best stability under our operation conditions. Thus, the slope of the increase in the ohmic resistance of the composite membrane was 0.009 mΩ cm2 h−1 and the polarization resistance was 1.17 mΩ cm2 h−1 which was two times lower than that of the standard membrane. The benefit of inorganic filler introduction when the fuel cell operates at high temperature has been highlighted.
1. Introduction
The environmental impact of energy use from traditional sources presents serious challenges to environmental protection and the sustainability of natural resources. Over the last century, this goal has been accomplished by burning petroleum products with adverse environmental consequences.1 In recent years, a hydrogen-based economy has been proposed as a solution to the current fossil-fuel economy. Hydrogen is an excellent energy carrier with many unique properties. It is the lightest, most efficient, and cleanest fuel. One of its unique properties is that through electrochemical processes, it can be converted to electricity in fuel cells with higher efficiencies than conversion of fossil fuels to mechanical energy in internal combustion engines or to electrical energy in thermal power plants.2A polymer electrolyte membrane fuel cell (PEMFC) is an electrochemical reactor in which chemical energy of a fuel and an oxidizer is converted directly into electrical energy. PEMFCs are easily miniaturized and suited as energy sources for automobiles as well as domestic applications and portable devices. Fuel cells are also currently considered as reaching the threshold of commercialization.3
The heart of a PEMFC is the membrane–electrode assembly (MEA). Within it, the proton exchange membrane separates the reactant gases and conducts protons from the anode side to the cathode side. Nowadays, the standard membrane material is Nafion® which is a prefluorosulphonic acid membrane. The high proton conductivity and the stability of the polymer are its main properties but proton conductivity has high water dependence, so that, the water is essential for proton transport and it is needed humidification.4 This behaviour makes operational temperatures below 100 °C at 1 atm. Therefore, low cathode performance is obtained due to the slow kinetics of the oxygen reduction reaction (ORR) and a reduced tolerance of the catalyst to fuel impurities like CO and hence high purity streams have been fed to the cell.4–7
PEMFCs operating at high temperatures (HT-PEMFC) have received a great deal of attention in recent years because of their numerous advantages, which include increased reaction kinetics, easier water management and a better tolerance to CO.8–10 One of the most promising membranes for this sort of fuel cell is polybenzimidazole (PBI) doped with phosphoric acid.11 Accordingly, HT-PEMFC using phosphoric acid doped PBI as a proton conducting electrolyte is available to work at high temperatures and a low humidity environment.12
For fuel cell applications, the PBI structure has been modified to improve its properties such as conductivity, mechanical strength or chemical stability. These modifications have been carried out by modifying the monomer prior to polymerisation, by post-functionalisation of the polymer or by the addition of inorganic fillers.13,14 The proton conductivity of PBI increases by increasing the acid-doping level,8i.e. by increasing the phosphoric acid bath concentration where membranes are immersed. When PBI membranes are doped, their mechanical strength decreases dramatically and the higher the acid content, the lower the mechanical strength is.8,15 Therefore, a compromise between these factors is required. Inorganic fillers are typically added to increase the proton conductivity and/or acid uptake of PBI films. Different methods for filling have been developed and were reviewed by Kerres.13 The use of membranes based on PBI and inorganic oxides such as silica (SiO2) or zirconia (ZrO2) have been studied for HT-PEMFCs.16,17
In previous works, we found an enhancement on fuel cell performance and also in fuel cell stability when a small amount of TiO2 into the PBI membrane was added.18,19 Thus, in this work the influence of different amounts of titanium dioxide as a filler into the PBI membrane under our operation conditions for its use as electrolyte material for HT-PEMFCs has been studied. The titanium composite membranes were compared with the standard PBI membrane. All of these materials were synthesised and cast from the same pristine polymer (with the same molecular weight) and prepared in the laboratory. Moreover, all the composite membranes prepared in this work were physicochemically characterized and the one with the best features was tested in an actual single fuel cell and also compared with the standard PBI membrane under the same operating conditions to evaluate their performance in a high temperature PEMFC. Finally, stability cell tests (>140 h of operation, under accelerate degradation conditions) were carried out on the composite and standard membrane fuel cells, impedance analyses were also performed to evaluate the results.
2. Experimental
2.1 PBI based membrane preparation
The polymer was synthesized in the laboratory according to a procedure described in previous work.15 All the membranes described in this work were prepared from a polymer with the same molecular weight (≈234.1 kDa). The chemicals were used as received. The composite PBI-based membranes with TiO2 (Merck, mean particle size 1.14 μm) were prepared as described below. Firstly, a dilute PBI solution (3 wt.% PBI) in N,N-dimethylacetamide (99% DMAc, Panreac) was prepared to facilitate the dispersion of TiO2 particles. TiO2 particle size was measured by a Mastersizer 2000 (Malvern Instruments Ltd., U.K) using water as the dispersant. Certain amounts of titania, in order to get 2, 4, 8 and 16 wt.% of the filler in the membrane, were mixed with the PBI solution. The solutions were stirred for 2 h in an ultrasonic bath in order to get an homogeneous solution. Finally, the membranes were cast following the same procedure as for the standard PBI membranes15,20 using a film applicator with a doctor blade (Elcometer, S.A.). A standard PBI membrane was also prepared using DMAc as solvent.15,20 Once the membranes had been prepared, if required for the characterization, they were immersed in a 75 wt.% phosphoric acid bath (Panreac) to dope the membranes at room temperature. In order to ensure the entire H3PO4 absorption by the membranes, all of them were immersed in the acid bath during five days at least.202.2 Physicochemical characterization
X-Ray diffraction (XRD) analyses were performed on a rotating anode Philips PW-1700 diffractometer (λ = 1.5418 Å, Cu Kα). Fourier transform infrared (FT-IR) spectra were recorded on a Perkin-Elmer 16-PC IR spectrophotometer; the applied wavenumber range went from 4000 to 400 cm−1 using very thin membranes (≤ 10 μm) to avoid beam saturation. Scanning electron microscopy (SEM) images and energy dispersive spectroscopy (EDS) mapping were collected in low vacuum mode by using a JEOL JSM-6400 Scanning Electron Microscope with an accelerating voltage of 20 kV at a magnification of 500. The surfaces of samples were sputtered with gold. Thermogravimetric analyses (TGA) were performed on a Perkin-Elmer TGA7 Thermogravimetric Analyzer equipped with a Gas Selector and a Thermal Analysis Controller TAC7/DX. The samples were heated from 25 °C to 550 °C at a temperature heating scan of 10 °C min−1 in a nitrogen flow. The leaching tests were carried out by washing the doped membranes in water at 80 °C for 2 h. The phosphoric acid removed from the membrane was measured by inductively coupled plasma atomic emission spectroscopy (ICP-AES, Varian Liberty RL) analyses. Mechanical analyses were determined from stress–strain curves obtained with a universal testing machine (Instron 5565) at 125 °C, the crosshead speed was set at 5 mm min−1. The dimension values for samples in mechanical analyses were 60 × 10 mm2 with an active length of 10 mm.The acid and the water absorbed in the different membranes were calculated on the basis of thermogravimetric analysis. Two portions of the same PBI membrane were prepared with the same thickness and dimensions. Firstly, the membrane portions were introduced into an oven at 110 °C for 3–4 h to remove superficial water. The membranes were then weighed. Subsequently, one sample was dipped into a phosphoric acid solution of known concentration and the other portion was used for thermogravimetric analysis. After five days of immersion time, the second portion was removed from the phosphoric acid solution and the excess acid was wiped from the surface. The membrane portion was weighed and analyzed by TGA. Taking into account the results obtained in each TGA, the calculation of acid and water absorption by the membranes was carried out according to a procedure described elsewhere.18,19
2.3 Electrochemical characterization—fuel cell tests
Membrane ionic conductivity was evaluated using a four point probe system.16 Measurements were carried out by means of electrochemical impedance spectroscopy (EIS) at a potential of 0 V with an Autolab PGSTAT 30 potentiostat/galvanostat (Ecochemie, The Netherlands) equipped with a frequency response analyzer (FRA) module. The frequency was varied between 10![[thin space (1/6-em)]](https://www.rsc.org/images/entities/char_2009.gif) 000 and 100 Hz with sinewave amplitude of 10 mV. Measurements were performed at 125, 150 and 175 °C on the membranes cast from the same high molecular weight polymer after impregnating different strips in 75 wt.% H3PO4 for five days.
000 and 100 Hz with sinewave amplitude of 10 mV. Measurements were performed at 125, 150 and 175 °C on the membranes cast from the same high molecular weight polymer after impregnating different strips in 75 wt.% H3PO4 for five days.
Fuel cell tests were performed on a cell of 5 cm2 consisting of two bipolar plates made of graphite impregnated with a phenolic resin (Sofacel, Spain), onto which flow fields with a serpentine geometry were machined. Heat was provided by means of heating rods inserted into the cell. The temperature of the system was controlled by a CAL 3300 (Cal Controls Ltd., United Kingdom) connected to a thermocouple embedded into the graphite blocks. Gold-plated metallic bolts were screwed into the blocks to allow electrical contact. Pure hydrogen and oxygen were supplied into the cell at constant flow rates of 0.134 l min−1 and 0.076 l min−1, respectively, without any additional pre-treatment.
For the preparation of the MEA, Toray graphite paper (TGPH-120, 10% wet-proofed, Basf, USA) was used as the gas diffusion and supporting layer (GDL) taking into account our previous results.21 On the top of GDL by N2-spraying a microporous layer (MPL) consisting of 2 mg cm−2 Vulcan XC-72R carbon black (Cabot Corp., USA) and 10% PTFE (Teflon Emulsion Solution, Electrochem Inc., USA), which prevents the penetration of the catalytic layer into the carbon support.22 Onto this layer was sprayed (using N2 as a carrier gas) a catalytic ink composed of 40% platinum on carbon black Vulcan XC-72 (Basf, USA),9PBI as the binder and DMAc as the solvent. The electrodes were then dried in an oven at 190 °C for 2 h to remove the remaining solvent. The electrodes were subsequently soaked in a 10 wt.% H3PO4 solution (≈30 mg cm−2) in order to make the PBI a proton conductor and to soften the contact between the membrane and the electrodes. The Pt loading on both electrodes was 0.5 mg cm−2 and the C/PBI weight ratio was 20 according to our previous results.23 The MEA preparation procedure concluded with the assembly of the electrodes and the membrane by hot-pressing. In this process the MEA was introduced between two stainless steel blocks equipped with heating rods and a temperature control system. Hot-pressing was performed at 130 °C with a load of 1 tonne applied for 15 min.
The electrochemical analysis on the fuel cell was carried out by obtaining polarization curves and impedance spectra as follows. Firstly, the cell was kept at 125 °C for 24 h, with the voltage monitored at a constant current density of 0.215 A cm−2 (1 A). In all cases, the cell voltage reached a stationary value. Polarization curves were obtained at different temperatures with a scan rate of 1 mV s−1 and a step potential of 1 mV. EIS were obtained at a potential of 0.6 V under the different fuel cell conditions. The frequency ranged from 10 kHz down to 100 mHz, with a potential wave of 10 mV r.m.s.
For the stability tests, the different fuel cells were operated at 175 °C without any humidification of either H2 or O2. The applied current density was 0.2 A cm−2 for approximately 140 h and the cell voltage was recorded with time. EIS were also carried out at different operation times in order to evaluate the different degradation mechanisms.
3. Results and discussion
3.1 X-Ray diffraction analyses
X-Ray analyses were carried out in order to evaluate the crystallinity of the PBI membranes containing different amounts of TiO2. The X-ray patterns of the different membranes prepared in this work and for the anatase crystalline variety are shown in Fig. 1.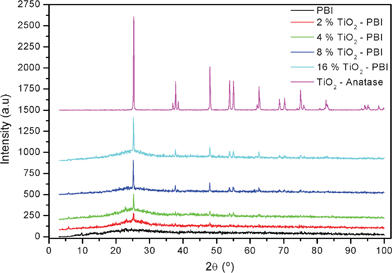 | ||
| Fig. 1 X-Ray diffraction patterns of the undoped standard PBI, TiO2 composite membranes and anatase-TiO2. | ||
It can be observed from Fig. 1 that the PBI membranes show a broad peak at around 2θ = 25°, which results from a convolution of amorphous and crystalline scattering.25 This pattern indicates that the PBI membranes were amorphous. On top of Fig. 1, it is showed the TiO2 X-ray pattern which corresponds to a crystalline variety of anatase (JCPDS 21-1272).25 All the composite membranes exhibited the main peak that is characteristic of TiO2 at a 2θ = 25.3°. The crystallite size for the four samples (from 2% to 16% of TiO2), calculated using Scherrer’s equation, was 31.7, 39.1, 44.2, and 46.4 nm, respectively. The higher the titania content, the more intense the main peak is and the other peaks from the anatase appeared. This fact confirms the presence of the filler in the polymer matrix and the structure of it did not change when was introduced into the film.
3.2 Infrared spectroscopy analyses
The FTIR spectra of the undoped membranes prepared in this work are shown in Fig. 2 to explore if any structural change occurred in the membrane when titanium dioxide was introduced into the membrane.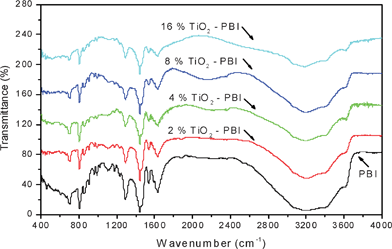 | ||
| Fig. 2 FTIR spectra of the undoped PBI-based films containing different amounts of titanium oxide. | ||
The spectra for the pristine PBI shows below 2000 cm−1 some relatively characterized narrow peaks attributed to localized normal vibrations of the phenyl groups in the pristine PBI and also to the formation of acid anions linked to the polymer by hydrogen bonding.26
Pure PBI also shows a broad intense peak in the range 3400 to 3000 cm−1 and a weak peak at around 3640 cm−1. By increasing, the TiO2 particles content in composite membranes the intensity of these peaks which appeared for N–H stretching broadened and decreased significantly. These phenomena indicate that hydrogen bonding between N–H groups in the PBI repeat unit and no condensed OH groups existed in partially hydrated titanium dioxide particles.27
3.3 Composite membrane morphology
The SEM micrographs of the different membranes prepared in this work are shown in Fig. 3. It is remarkable how the membrane with only 4% of TiO2 present many aggregates (average agglomerate size 0.82 × 0.65 μm2 approx.) and how larger and high amount of agglomerates are formed in the samples with 8% of TiO2 (average agglomerate size 0.85 × 0.92 μm2 approx.) and 16% of TiO2 (average agglomerate size 1.78 × 1.77 μm2 approx.) whereas in the case of the membrane with 2% of TiO2 the formation of agglomerates is not so evident as in the other membranes and those are smaller (average agglomerate size 0.33 × 0.22 μm2 approx.). Nevertheless, it can be said, that in all samples the particle sizes were about 0.25 μm and even lower in the case of the sample with 2% TiO2. Taking into account that the inorganic powder has elemental Ti, it was decided to carry out a mapping of this element (Figure not shown) in the sample of 2% of TiO2 and it was observed that the TiO2 was uniformly distributed throughout the surface of the membrane.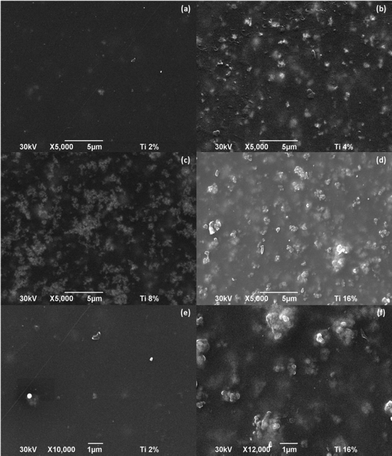 | ||
Fig. 3
SEM micrograph of the x%-TiO2 composite membrane surface (a) 2%-TiO2 (b) 4%-TiO2 (c) 8%-TiO2 (d) 16%-TiO2 (e) 2%-TiO2 (Magnification: 10![[thin space (1/6-em)]](https://www.rsc.org/images/entities/char_2009.gif) 000) (f) 2%-TiO2 (Magnification: 12 000) (f) 2%-TiO2 (Magnification: 12![[thin space (1/6-em)]](https://www.rsc.org/images/entities/char_2009.gif) 000). 000). | ||
3.4 Thermogravimetric analyses
The results of the thermogravimetric analysis curves for the different undoped and doped membranes prepared are shown in Fig. 4.a and Fig. 4.b, respectively.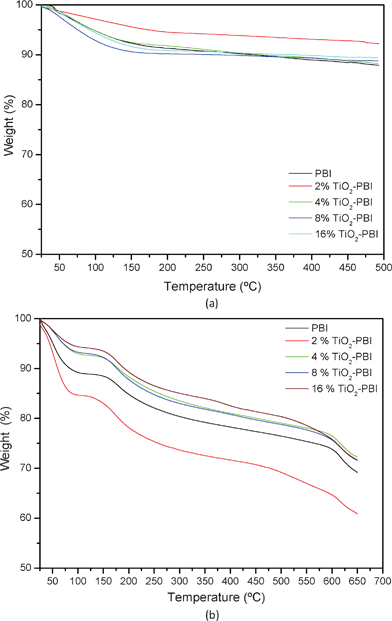 | ||
| Fig. 4 Thermograms of the different (a) undoped and (b) doped composite PBI-based membranes containing titanium dioxide and the standard one. | ||
As it was demonstrated in some of our previous works12,15,18–20 and by other authors,28–29PBI and also the composite PBI-based membranes show (Fig. 4.a) exceptional high temperature stability up to temperatures of 500 °C. The initial decrease observed for all cases was due to the loss of water of hydration (below 150 °C),8,15,18–20,23
From Fig. 4.b, all the samples show two well defined weight decays. The first goes from room temperature to 100 °C. This loss of weight is related to the absorbed water contained in the polymer because of both the hydrophilic nature of the polymer and the hygroscopic characteristics of the phosphoric acid.12,30 The second one, appearing at around 160 °C, is due to the thermal changes in phosphoric acid. Some authors attribute these losses to the self-dehydration reaction of phosphoric acid, forming the pyrophosphoric and triphosphoric acid,12,20,28,30
As described in the experimental section, the acid and water doping level were calculated on the basis of thermogravimetric analyses. The values obtained are shown in Table 1.
The acid and water absorption values presented in Table 1 reveal that 2 wt.% of the filler into the polymer matrix was enough to retain higher amounts of acid and water than pure PBI when the membranes were immersed into the same acid bath. Higher amounts of the filler into the membrane did not appear helpful in terms of acid and water retention. As it could be checked in the SEM micrographs, the titanium dioxide was well distributed into the polymer matrix for the composite membrane with 2 wt.% of the filler. In the case of the composite membranes with higher amounts of TiO2 than 2 wt.%, the filler could not be well distributed inside the membrane and agglomerates of it could be formed. As can be found in the literature, inorganic oxides tend toward agglomeration in the polymer solution and, after solvent evaporation in the membrane, reduces the active surface for acid and water adsorption.13,31–32
3.5 Leaching test
Once the acid and water absorption capability of the composite membranes was known, acid leaching tests for all the membranes were carried out in order to determine the acid retention capability of the membranes, which is considered one of the main degradation factors of this sort of membranes in the fuel cell,1,33–34Fig. 5 shows the results obtained from the leaching tests.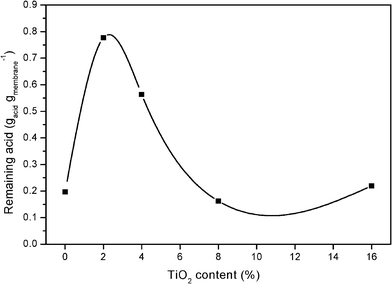 | ||
| Fig. 5 Phosphoric acid retained by the membranes after leaching test. | ||
It can be observed from Fig. 5 that the membranes with 2 and 4 wt.% of the filler retain higher amounts of the acid than the standard one and the other composite membranes retain the same quantity than the standard one. As it has been said in previous sections, only a small amount of the filler is enough to improve the properties of the membrane, in this case, the improved property is the capability of the membrane to retain acid after being washed with hot water. The formed agglomerates for composite membranes with a quantity much than 2% of TiO2 could cause the no positive effect in retaining acid capability. In contrast, Mustarelli et al. found a positive effect on acid retention for amounts of silica up to 50 wt.% and 5 wt.% of the filler did reduce the acid leaching from the membrane by more than a factor of two,16 From our results, 2 and 4 wt.% of titania do reduce the acid leaching by a factor of four and three, respectively.
3.6 Mechanical strength
Fig. 6 shows maximum stress and elongation of the as prepared membranes after they were immersed into the phosphoric acid bath and at 125 °C in order to simulate the fuel cell operation temperature.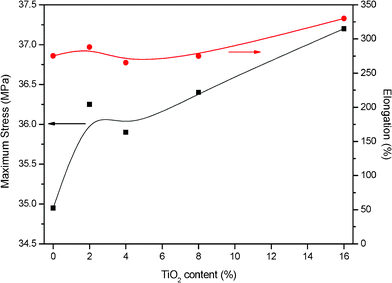 | ||
| Fig. 6 Maximum stress and elongation for the TiO2 composite PBI-based membrane and standard one doped into a 75% wt. acid bath. T = 125 °C. | ||
In previous works,35 we measured the maximum stress and elongation of PBI without phosphoric acid at the same procedure conditions. We found values of 446 MPa for the maximum stress and an elongation of 40%. When PBI is impregnated with phosphoric acid, it undergoes a significant deterioration of its mechanical properties while elongations at maximum stress increases.8,10,15 The doped membrane is more plastized than the pristine one, the toughness of the film decreases and the polymer chains are more flexible to rearrange under load.
The higher the titanium dioxide content, the higher the maximum stress and elongation. The introduction of the filler supplies the composite PBI based membranes with a higher mechanical resistance and the negative effect on it which appeared when membranes were doped seems to become weak. The positive effect on mechanical properties has been also reported by other authors34,36 for organic–inorganic composite membranes.
3.7 Ionic conductivity measurements. Four probe test
The ionic conductivity variations for the prepared doped membranes at different temperatures and the same measurement conditions are shown in Fig. 7.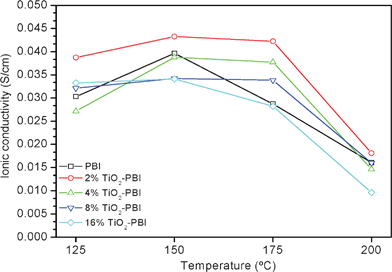 | ||
| Fig. 7 Ionic conductivity values of the TiO2 composite membranes and the standard one at different temperatures. Acid bath = 75% wt. | ||
Taking into account the results shown in Table 1, the membranes which absorb high amounts of acid and water present high conductivities. Ma et al.30 reported the following proton transfer pathways: H3PO4 to H2O > H3PO4 to H2PO4− > N–H+ to H2PO4− > N–H+ to H2O > N–H+ to N–H. Therefore, our results agree with this proton transfer pathway. The conductivity is directly correlated with the number of proton carriers and their mobility. Both parameters are function of temperature.15,37 Bearing in mind that the nature of the surface functional groups is the same because the inorganic filler is the same in all the membranes, the variation in the conductivity could be mainly due to the different particle size, and thus to the different specific surface areas. A powder with a large specific surface area is characterised by a large number of absorbing sites. According to this, the membrane with 2% of TiO2 would have the highest specific surface area because it was the sample where a lower amount of agglomerates were formed and a high dispersion of particles was obtained as it can be seen in Fig. 3 and from the mean crystallite size values from XRD analyses. Hence, a significant number of water and phosphoric acid molecules will be coordinated by the OH groups present on the surface of TiO2 particles promoting the proton transport through the 2% TiO2 composite PBI membrane at high temperature.38 This would also explain the values shown in Table 1.
It can be also seen in Fig. 7 that the conductivity of the membranes increases with temperature, although for most of the membrane samples the conductivity increased up to 150 °C. For example, at 150 °C, standard PBI conductivity is 0.039 S cm−1, whereas at 175 °C the conductivity decreases down to 0.029 S cm−1. The reason for this fashion is the self-dehydration of H3PO4 which occurs when the temperature exceeds 150 °C, generating less conductive pyrophosphoric acid as reported for the thermogravimetric analyses of the present work. It has to be taken into account that measurements were performed under fairly “dry” conditions, in other words, the membranes were equilibrated with the room environment which favours that process. Water plays an important role in improving the proton transfer mechanism.18,30,37 For all of the composite membranes, the conductivity drop was less marked probably due to the dehydration mechanism being slowed down by the presence of the filler. The composite membrane with 2% titanium dioxide reached the maximum conductivity at 150 °C with a value of 0.043 S cm−1.
3.8 Fuel cell performance
The 2% TiO2–PBI composite membrane was chosen in order to evaluate its performance in a cell and the results were compared with the standard one. The reason why the 2% TiO2 composite membrane was chosen was because it had a higher acid and water absorption and retention capability than the other composites with high amount of titanium dioxide and also due to the highest out-of-cell ionic conductivity reached. Fig. 8 presents fuel cell performance at different tested temperatures when using a composite membrane and a standard one doped with phosphoric acid as the electrolyte.![Polarization curves for standard PBI and the composite membranes containing 2 wt.% of TiO2; (a) T = 125 °C; (b) T = 150 °C; (c) T = 175 °C. Fuel: H2; Carburant: O2; Pressure = 1 atm for both gases. [Pt] cathode = [Pt] anode = 40%; ratio C/PBI = 20 for both electrodes. Membranes doped into a 75% wt H3PO4 solution; Pt load = 0.5 mg cm−2.](/image/article/2012/RA/c1ra01084k/c1ra01084k-f8.gif) | ||
| Fig. 8 Polarization curves for standard PBI and the composite membranes containing 2 wt.% of TiO2; (a) T = 125 °C; (b) T = 150 °C; (c) T = 175 °C. Fuel: H2; Carburant: O2; Pressure = 1 atm for both gases. [Pt] cathode = [Pt] anode = 40%; ratio C/PBI = 20 for both electrodes. Membranes doped into a 75% wt H3PO4 solution; Pt load = 0.5 mg cm−2. | ||
As was expected, the performance of both fuel cells in Fig. 8 was improved with temperature due to the enhancement of the kinetic and diffusion processes.10,35,39 It is well known that a polarization curve of a PEMFC could be divided into three regions.2,3 The first region appears at low current densities which is governed by the reactions that occur in the cell. For these kinds of fuel cells, the controlling electrode is the cathode due to it slower reaction rate than the anode.40–42 An increase on temperature provides a higher oxygen reduction reaction (ORR) rate; this means a marked improvement in this region of the polarisation curve which is dominated by activation losses. The second region of the polarization curve occurs at intermediate current densities, this region is governed by the ohmic drop, which is responsible for the proton mobility. It can be observed a decrease of the polarization curve slope in this region when temperature increases. Table 2 shows the proton conductivity values of both fuel cells at different temperatures calculated from the ohmic resistance values obtained from the IES. The equivalent circuit used to calculate the ohmic resistance is described elsewhere9,12,23 and it is composed of an ohmic resistance in series with parallel circuit containing a resistance and a constant phase element and finally, another parallel circuit containing a new resistance and a constant phase element also in series.
The results from Table 2 confirm the enhancement on proton mobility in both fuel cells when operation temperature was increased as discussed above. The third and last region of a polarization curve take place at high current densities and it is governed by mass transfer processes. In this region, the voltage goes down dramatically when current density increases. The region governed by mass transfer did not appear in any fuel cell test of the present work, as shown in Fig. 8, probably due to the flow rates used for oxygen and hydrogen being too high. Although, an improvement in the ultimate current density, which is the current density at the lowest cell voltage, was also observed when temperature increased. This phenomenon is also attributed to the enhancement of both kinetic and diffusion mechanism.19,42
The composite fuel cell shows higher fuel cell performance and also a larger performance increase when temperature was raised than the standard PBI fuel cell. At 125 °C the composite fuel cell achieved a maximum power density of 328.3 mW cm−2 and 266.2 mW cm−2 for the standard fuel cell. For the highest fuel cell temperature, the composite fuel cell reached 438 mW cm−2 of maximum power density and the standard one reached 344 mW cm−2. Increasing operation temperature meant an increase on power density of 25% and 22% for the composite and the standard fuel cells, respectively. Therefore, the high performance achieved by the TiO2 composite fuel cell could be due to the higher proton conductivity reached than the standard one, as shown in Table 2. This high performance for the composite fuel cell and also proton conductivity was because of the high acid doping level of this fuel cell (see Table 1).
Liu et al.43 published in 2006 their works with Nafion-TiO2 composite membranes for direct methanol fuel cells; they obtained an increase on power density of 16% on the composite one operating at 80 °C. In our case, the difference on power density between both fuel cells was 21.5% at 175 °C. This fact demonstrates that the positive effect on fuel cell performance operating with inorganic composite electrolytes is higher, and the higher the operation temperature is due to the adsorption capability of the inorganic phase that helps retaining water and acid in the membrane at high temperatures.
3.9 Stability test
The MEA performance stability test was carried out on the different PBI-based membrane fuel cells; an operation temperature of 175 °C was selected in order to accelerate the degradation processes. The cell voltage record during time is represented in Fig. 9.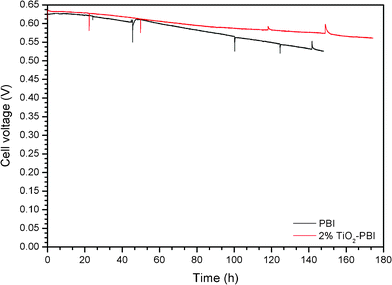 | ||
| Fig. 9 Stability test for the fuel cells operating with the different membranes. Voltage degradationversus time at 0.2 A cm−2 and T = 175 °C. Acid bath = 75% wt. H3PO4. | ||
A slight drop of the voltage throughout the long term test can be appreciated for all the cells. Both fuel cells had similar voltage decay up to 50 h of operation, even though the standard PBI showed the highest decay from this operation time to the limit of the test. The titanium-based composite membrane showed the best performance as was expected taking into account the polarization curves. Moreover, this membrane showed the best stability. The slope of the different cell voltage variations was calculated in order to estimate the voltage drop with time (approx. 145 h), obtaining the following values: −0.20 μV s−1 and −0.12 μV s−1 for the standard PBI and the titanium composite membrane, respectively. It is clear that the standard one was far from the titanium composite membrane’s stability.
To get a better understanding of the fuel cell’s behaviour with time, impedance analyses were also carried out at different operation times. The ohmic (RΩ) and the charge transfer polarization (Rpol, ct) resistances were plotted with time in Fig. 10. On the one hand, the ohmic resistance is directly correlated with the proton mobility through the membrane and the ohmic drop generated by contacts and wires. These last two ohmic drops are constant with time for all the assays.9,19,23 On the other hand, the polarization resistance is not related to the Faradaic process, this resistance stems from the distributed resistance effects in the electrolyte within the catalyst.19,40,44–45
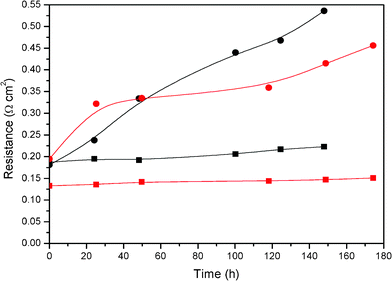 | ||
| Fig. 10 Ohmic (squares) and charge transfer polarization (circles) resistances degradation rate for the different membranes during stability test. Black: PBI; Red: 2% TiO2-PBI. Acid bath = 75% wt. H3PO4. | ||
Fig. 10 shows a trend on increasing resistance when time went on due to the degradation processes that occur in the fuel cell. The degradation rate of the polarisation resistance was higher than the ohmic one which means that the processes that occur into the electrode were more severe than the processes that occur in the membrane. Therefore, deactivation processes of the platinum based catalyst were higher than proton electrolyte membrane degradation for both fuel cells.19,35,46 In contrast to the results found in the bibliography that attributed membrane degradation to be one of the main degradation factors in a PBI based fuel cell,1,33–34,47 we found that electrode degradation was ten times higher than membrane degradation. In previous works, our group found that no more than 2 wt.% of the total amount of acid contained in the PBI membrane was leached out of the cell.42 Taking into account the measurements of the leaching tests, it is known that the acid leaches from the membrane. Therefore, the acid could be retained in the electrodes when it is leached from membrane and hence, the electrodes could operate at very acidic conditions. From these results, a few catalyst degradation mechanisms could be proposed. These are the loss of catalyst active surface area by dissolution, due to the presence of phosphoric acid,48 the sintering of the catalyst,49 thermal stress in different parts of the single cell, thermal degradation of the carbon support and corrosion of the carbon support due to the presence of the electrolyte.50 The carbon corrosion produces electrical isolation between the catalytic particles and the carbon of the support, this support ensures the electrical contact between the bipolar plates. The electrical insulation decreases the electrochemical surface area available and produces a performance loss in the fuel cell.51,52
Other mechanisms were proposed by LaConti et al.,53 where the oxygen molecules permeate through the membrane from the cathode side and are reduced at the anode platinum catalyst to form hydrogen peroxide. H2O2 formation in oxygen reduction on carbon supported platinum catalysts is greatly enhanced in the anode, where atomic hydrogen is adsorbed on Pt.
It is a fact that platinum particles move from the cathode to the anode, in acid media, viaOstwald ripening of Pt particles on the carbon and/or via diffusion of soluble, oxidized platinum species (Pt+2) in the ionomer and most of them are deposited on the membrane.54
The values of the resistances from Fig. 10 were fitted in order to estimate the degradation rates of electrodes and membranes for both fuel cells. On the one hand, the rates for the ohmic resistances were 0.23 mΩ cm2 h−1 and 0.09 mΩ cm2 h−1 for the standard fuel cell and composite fuel cell, respectively. Accordingly, the composite membrane seems to be more stable when it was operated in a fuel cell. On the other hand, the rates fitted for the polarization resistance were 2.34 mΩ cm2 h−1 and 1.17 mΩ cm2 h−1 for the standard and composite ones, respectively. In this case, the composite fuel cell electrodes were two times more stable than those for the standard fuel cell. This fact could be due to the composite membrane leaching less acid than the standard one, the presence of this material at the membrane–electrode interface, which provides the maximum contribution to the catalytic activity39 may have a similar effect to ZrO2, as reported by Liu et al.55 and hence, the above proposed electrode degradation mechanisms could occur to a lower extent. Moreover, the presence of titanium particles on the membrane surface could contribute to a lower adsorption of the phosphate ions on platinum because less acid leaches and does not “attack” the Pt sites. Thus, more surface sites for the oxygen reduction adsorption are available. In the same way as our results, Santiago et al.56 found in their studies that with TiO2 composite Nafion membranes, the oxide gave more stability to the cell by operating at harsh conditions. In order to clarify all this, Fig. 11 illustrates the positive effect of the titanium composite PBI membrane and shows how the phosphoric acid remains in the composite membrane and the different degradation mechanisms of platinum particles take place to a lesser extent which could explain the lower polarisation resistance shown by the electrodes of the MEAs prepared with the composite membrane.
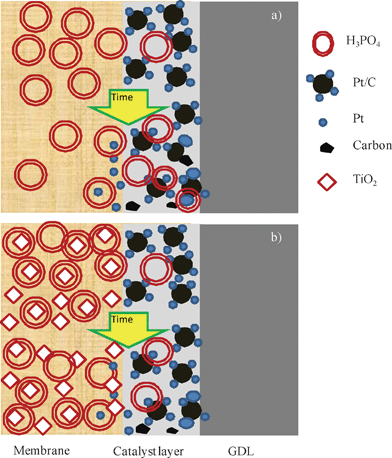 | ||
| Fig. 11 Schematic representing electrode degradation with (a) PBI membrane and (b) titanium composite PBI membrane. | ||
Conclusions
In the present work, the influence of the TiO2 content as filler in a PBI based membrane for its use as electrolyte in a high temperature PEM fuel cell has been studied. Within the TiO2 range studied under our operating conditions. It can be said that the membrane with the smallest quantity of TiO2 presented the best properties for its use as electrolyte in high temperature PEM fuel cells due to the good acid and water absorption and retention capability and also due to the highest out cell ionic conductivity reached.The composite membrane with 2% TiO2 showed the highest cell performance at all operation temperatures, better proton conductivity stability and also electrode stability over 150 h under our operating conditions.
It has been demonstrated that reducing the acid leaching from the membranes by using inorganic fillers as micro-sized TiO2, the degradation rate in the electrodes decreased.
Taking into account all these points, it could be said that a phosphoric acid doped 2% TiO2 composite PBI based membrane is a good candidate to operate as electrolyte in high temperature polymer fuel cells.
Acknowledgements
This work was supported by the Project CTM CTM2010-18833 from the Spanish Government.References
- R. Devanathan, Energy Environ. Sci., 2008, 1, 101 RSC.
- F. Barbir, PEM Fuel Cells: Theory and Practice, editor R. C. Dorf, Elsevier Academic Press, London, 2005 Search PubMed.
- S. M. J. Zaidi and M. A. Rauf, Polymer Membranes for Fuel Cells: Chapter 1 Fuel Cell Fundamentals, editors S. M. J. Zaidi, T. Matsuura, Springer Science + Business Media, LLC, New York, 2009 Search PubMed.
- Q. Li, R. He, J. O. Jensen and N. J. Bjerrum, Chem. Mater., 2003, 15, 4896 CrossRef CAS.
- R. K. Ahluwalia and X. Wang, J. Power Sources, 2008, 180, 122 Search PubMed.
- G. Alberti, M. Casciola, L. Massinelli and B. Bauer, J. Membr. Sci., 2001, 185, 73 CrossRef CAS.
- C. Yang, P. Costamagna, S. Srinivasan, J. Benziger and A. B. Bocarsly, J. Power Sources, 2001, 103, 1 CrossRef CAS.
- Q. Li, J. O. Jensen, R. F. Savinell and N. J. Bjerrum, Prog. Polym. Sci., 2009, 34, 449 CrossRef CAS.
- J. Lobato, P. Cañizares, M. A. Rodrigo, J. J. Linares, D. Úbeda and F. J. Pinar, Fuel Cells, 2010, 10, 312 Search PubMed.
- J. S. Wainright, J. T. Wang, R. F. Savinell and M. H. Litt, J. Electrochem. Soc., 1995, 142, L121.
- J. Mader, L. Xiao, T. J. Schmidt and B. C. Benicewicz, Adv. Polym. Sci., 2008, 216, 63 CAS.
- J. Lobato, P. Cañizares, M. A. Rodrigo and J. J. Linares, Electrochim. Acta, 2007, 52, 3910 CrossRef CAS.
- J. A. Kerres, Fuel Cells, 2005, 5, 230 CrossRef CAS.
- O. Savadogo, J. Power Sources, 2004, 127, 135 CrossRef.
- J. Lobato, P. Cañizares, M. A. Rodrigo, J. J. Linares and J. A. Aguilar, J. Membr. Sci., 2007, 306, 47 CrossRef CAS.
- P. Mustarelli, E. Quartarone, S. Grandi, A. Carollo and A. Magistris, Adv. Mater., 2008, 20, 1339 CrossRef CAS.
- A. A. Lysova, I. I. Ponomarev and A. B. Yaroslavtsev, Solid State Ionics, 2011, 188, 132 Search PubMed.
- J. Lobato, P. Cañizares, M. A. Rodrigo, D. Ubeda and F. Javier Pinar, J. Membr. Sci., 2011, 369, 105 Search PubMed.
- J. Lobato, P. Cañizares, M. A. Rodrigo, D. Úbeda and F. Javier Pinar, J. Power Sources, 2011, 196, 8265 Search PubMed.
- J. Lobato, P. Cañizares, M. A. Rodrigo, J. J. Linares and G. Manjavacas, J. Membr. Sci., 2006, 280, 351 CrossRef CAS.
- J. Lobato, P. Cañizares, M. A. Rodrigo, C. Ruiz-Lopez and J. J. Linares, J. Appl. Electrochem., 2008, 38, 793 CrossRef CAS.
- J. Lobato, P. Cañizares, M. A. Rodrigo, D. Ubeda, F. J. Pinar and J. J. Linares, Fuel Cells, 2010, 10, 770 Search PubMed.
- J. Lobato, P. Cañizares, M. A. Rodrigo, J. J. Linares and F. J. Pinar, Int. J. Hydrogen Energy, 2010, 35, 1347 CrossRef CAS.
- J. Bermudez-Polonio, X-ray Diffraction Methods: Principles and Applications, Pirámide, Madrid, 1981 Search PubMed.
- S. Matsuda and A. Kato, Appl. Catal., 1983, 8, 149 Search PubMed.
- Q. Li, R. He, R. W. Berg, H. A. Hjuler and N. J. Bjerrum, Solid State Ionics, 2004, 168, 177 CrossRef CAS.
- M. Sadeghi, M. A. Semsarzadeh and H. Moadel, J. Membr. Sci., 2009, 331, 21 CrossRef CAS.
- S. R. Samms, S. Wasmus and R. F. Savinell, J. Electrochem. Soc., 1996, 143, 1225 CAS.
- Q. F. Li, H. C. Rudbeck, A. Chromik, J. O. Jensen, C. Pan, T. Steenberg, M. Calverley, N. J. Bjerrum and J. Kerres, J. Membr. Sci., 2010, 347, 260 CrossRef CAS.
- Y.-L. Ma, J. S.Wainright, M. H. Litt and R. F. Savinell, J. Electrochem. Soc., 2004, 151, A8 CrossRef CAS.
- L. Tchicaya-Bouckary, D. J. Jones and J. Rozière, Fuel Cells, 2002, 2, 40 CrossRef CAS.
- G. Alberti and M. Casciola, Annu. Rev. Mater. Res., 2003, 33, 129 CrossRef CAS.
- R. Borup, J. Meyers, B. Pivovar, Y. S. Kim, R. Mukundan, N. Garland, D. Myers, M. Wilson, F. Garzon, D. Wood, P. Zelenay, K. More, K. Stroh, T. Zawodzinski, J. Boncella, J. E. McGrath, M. Inaba, K. Miyatake, M. Hori, K. Ota, Z. Ogumi, S. Miyata, A. Nishikata, Z. Siroma, Y. Uchimoto, K. Yasuda, K. Kimijima and N. Iwashita, Chem. Rev., 2007, 107, 3904 CrossRef CAS.
- X. Zhu, Y. Liu and L. Zhu, Polymer membranes for fuel cells: Chapter 7: Polymer Composites for High-Temperature Proton-Exchange Membrane Fuel Cells, editors S. M. J. Zaidi, T. Matsuura, Springer Science + Business Media, LLC, New York, 2009 Search PubMed.
- J. Lobato, P. Cañizares, M. A. Rodrigo, D. Úbeda and F. J. Pinar, ChemSusChem, 2011, 4, 1489 Search PubMed.
- P. N. Pintauro and R. Wycisk, Advanced membrane technology and applications: Chapter 29: Fuel cell membranes, editors N. N. Li, A. G. Fane, W. S. W. Ho, T. Matsuura, Published by John Wiley & Sons, Inc., Hoboken, New Jersey, 2008 Search PubMed.
- H. Pu, W. H. Meyer and G. Wegner, J. Polym. Sci., Part B: Polym. Phys., 2002, 40, 663 CrossRef CAS.
- V. Baglio, A. S. Aricó, A. Diblasi, V. Antonucci, P. L. Antonucci, S. Licoccia and E. Traversa, F. Serraino Fiory. Electrochim. Acta, 2005, 50, 1241 Search PubMed.
- F. Seland, T. Berning, B. Børrensen and R. Tunold, J. Power Sources, 2006, 160, 27 CrossRef CAS.
- N. H. Jalani, M. Ramani, K. Ohlsson, S. Buelte, G. Pacifco, R. Pollard, R. Staudt and R. Datta, J. Power Sources, 2006, 160, 1096 CrossRef CAS.
- J. Wu, X. Z. Yuan, H. Wang, M. Blanco, J. J. Martin and J. Zhang, Int. J. Hydrogen Energy, 2008, 33, 1735 Search PubMed.
- F. J. Pinar, P. Cañizares, M. A. Rodrigo, D. Úbeda and J. Lobato, J. Power Sources, 2011, 196, 4306 Search PubMed.
- Z. Liu, B. Guo, J. Huang, L. Hong, M. Han and L. M. Gan, J. Power Sources, 2006, 157, 207 Search PubMed.
- T. E. Springer, T. A. Zawodzinski, M. S. Wilson and S. Gottesfeld, J. Electrochem. Soc., 1996, 143, 587 CrossRef CAS.
- V. A. Paganin, C. L. F. Oliveira, E. A. Ticianelli, T. E. Springer and E. R. Gonzalez, Electrochim. Acta, 1998, 43, 3761 CrossRef CAS.
- F. J. Pinar, P. Cañizares, M. A. Rodrigo, D. Úbeda and J. Lobato, Proceedings of the 15th European Fuel Cell Forum, Editors: A. Friedrich, W. G. Bessler, G. Schiller, N. Wagner, Chapter 8, Sessison A10, 2011, 34 Search PubMed.
- S. Yu, L. Xiao and B. C. Benicewicz, Fuel Cells, 2008, 8, 165 CrossRef CAS.
- Y. Zhai, H. Zhang, G. Liu, J. Hu and B. Yi, J. Electrochem. Soc., 2007, 154, B72 CrossRef CAS.
- J. Hu, H. Zhang, Y. Zhai, G. Liu, J. Hu and B. Yi, Electrochim. Acta, 2006, 52, 394 CrossRef CAS.
- D. A. Stevens and J. R. Dahn, Carbon, 2005, 43, 179 CrossRef CAS.
- L. M. Roen, C. H. Paik and T. D. Jarvi, Electrochem. Solid-State Lett., 2004, 7, A19 CrossRef CAS.
- K. H. Kangasniemi, D. A. Condit and T. D. Jarvi, J. Electrochem. Soc., 2004, 151, E125 CrossRef CAS.
- A. B. LaConti, M. Hamdan, and R. C. McDonald, Handbook of fuel cells-fundamental, techology and applications, editors: W. Vielstich, H. A. Gasteiger, John Wiley & Sons: New York, 2003, vol. 3 Search PubMed.
- P. J. Ferreira, G. J. la Ó, Y. Shao-Horn, D. Morgan, R. Makharia, S. Kocha and H. A. Gasteiger, J. Electrochem. Soc., 2005, 152, A2256 CrossRef.
- G. Liu, H. Zhang, Y. Zhai, Y. Zhang, D. Xu and Z.-G. Shao, Electrochem. Commun., 2007, 9, 135 CrossRef CAS.
- E. I. Santiago, R. A. Isidoro, M. A. Dresch, M. Linardi and F. C. Fonseca, Electrochim. Acta, 2009, 54, 4111 CrossRef CAS.
| This journal is © The Royal Society of Chemistry 2012 |
