Silica stabilized iron particles toward anti-corrosion magnetic polyurethane nanocomposites
Jiahua
Zhu
a,
Suying
Wei
b,
Ian Y.
Lee
c,
Sung
Park
c,
John
Willis
c,
Neel
Haldolaarachchige
d,
David P.
Young
d,
Zhiping
Luo
e and
Zhanhu
Guo
*a
aIntegrated Composites Laboratory (ICL), Dan F. Smith Department of Chemical Engineering, Lamar University, Beaumont, TX 77710, USA. E-mail: zhanhu.guo@lamar.edu; Tel: (409) 880-7654
bDepartment of Chemistry and Biochemistry, Lamar University, Beaumont, TX 77710, USA
cAerospace Research Labs, Northrop Grumman Systems Corporation, Redondo Beach, CA 90278, USA
dDepartment of Physics and Astronomy, Louisiana State University, Baton Rouge, LA 70803, USA
eMicroscopy and Imaging Center, Texas A&M University, College Station, TX 77843, USA
First published on 12th December 2011
Abstract
A sol–gel method is used to introduce fluorescent silica shells with tunable thickness on the spherical carbonyl iron particles (CIP) by a combined hydrolysis and condensation of tetraethyl orthosilicate (TEOS). Both gelatin B and 3-aminopropyltriethoxysilane (APTES) are used as primers to render the metal particle surface compatible with TEOS. The silica shell is formed through the hydrolysis and condensation of TEOS on the primer-treated CIP and the shell thickness can be controlled by varying the ratio of chemicals, such as TEOS and ammonia. The silica shell on the particle surface is confirmed by Fourier transform infrared spectroscopy (FT-IR), thermogravimetric analysis (TGA) and transmission electron microscopy (TEM). The magnetic and anti-corrosive properties of the CIP and CIP-silica particles have been evaluated. A conformal coating shell is confirmed surrounding the CIP against their etching/dissolution by protons. Polyurethane composites filled with CIP and CIP-silica particles are fabricated with a surface initiated polymerization (SIP) method. A salt fog industrial-level test indicates an improved anti-corrosive behavior of the CIP-silica/PU composites than that of the CIP/PU composites. Both CIP-silica particles and CIP-silica/PU composites exhibit better thermal stability and antioxidation capability than their CIP and CIP/PU counterparts, respectively due to the stronger barrier effect of the noble silica shell. The insulating silica shell decreases the efficiency of the electron transportation among the particles and thus leads to a higher resistivity in the composites.
1. Introduction
Surface coating of magnetic particles with various materials to form core-shell structures results in the new hybrid materials, which can be used as magnetic resonance imaging (MRI) contrast agents,1 and in the fields of magnetically guided site specific drug delivery,2,3magnetic separation of cells and biocomponents4,5 and environmental remediation.6,7 Numerous technical applications require magnetic particles embedded in a nonmagnetic matrix or coated with a uniform nonmagnetic layer.8–12 Encapsulating magnetic particles with silica is a promising and important approach in the development of magnetic materials for biomedical applications.13,14 For magnetoelectronic applications, silica-coated particles could be used to form ordered arrays with a controlled interparticle magnetic coupling through tuning the silica shell thickness.15The reported silica coating techniques mainly rely on the well-known Stöber process, in which silica is formed in situ through the hydrolysis and condensation of a sol–gel precursor.16 It was firstly applied to rod-like magnetic γ-Fe2O3 nanoparticles (NPs),17 and then to micrometre-sized hematite (Fe2O3) colloids18 and other NPs such as gold19 and silver.20 The silica coating technologies surrounding the particles can be divided into two categories according to whether a primer is introduced or not before adding the silica precursor. Wang et al.21 have demonstrated that silica will not adhere to the metal particles if the silica sol is prepared in the presence of the metal particles alone. However, silica was successfully coated on the iron surface if gelatin was used as a priming agent to modify the iron particle (∼1 μm) surface. Fu et al.22 introduced 3-mercaptopropyltrimethoxysilane as a surface primer to functionalize cobalt NPs, and then used the Stöber process to obtain silica coatings with different thicknesses. Xia et al.23 reported that γ-Fe2O3 and Fe3O4 could be directly coated with amorphous silica because the iron oxide surface has a strong affinity toward silica, no primer is required to promote the deposition and adhesion of silica.
Polymer nanocomposites (PNCs), combining the characteristics of parent constituents into a single specimen, have wide and promising applications arising from their tunable unique mechanical, magnetic and electrical properties,24–26 cost-effective processability and light weight. Elastomeric polyurethane with unique properties has received wide attention for their various applications.27–29 Particularly, polyurethane nanocomposites with enhanced thermal stability and improved mechanical and electrical properties have demonstrated excellence as structural and functional materials.30–32 For polymer composites filled with metallic fillers, corrosion is the major concern especially when exposed to harsh environments, such as high temperature, humidity and even in corrosive sodium chloride solution.33,34 To maintain the physical properties of these composites, a stable coating material is needed to protect the metal fillers against oxidation/dissolution. Silica is preferred against the other coating materials due to its chemical inertness, optical transparency and easily tunable surface functionalities due to the terminated silanol group, which can react with various coupling agents.35–37
In this paper, carbonyl iron particles (CIP) were coated with silica by using both gelatin and 3-aminopropyltriethoxysilane (APTES) as primers to promote the deposition and adhesion of silica on the CIP surface. The silica shell thickness is controlled through adjusting the concentrations of tetraethyl orthosilicate (TEOS) and ammonia. Polyurethane nanocomposites filled with either bare magnetic CIP or silica coated CIP are fabricated with a surface initiated polymerization (SIP) method, the anti-corrosive behaviors, thermal stability, electrical conductivity and magnetic properties are investigated and are compared between these two nanocomposite systems.
2. Experimental
Materials
Carbonyl iron particles (CIP, BASF Group, 99.5 wt% Fe) have a size range of 2–5 μm. 3-aminopropyltriethoxysilane (APTES) with a purity of 99% and gelatin (type B) are purchased from Sigma-Aldrich, which are used as primers to promote the deposition and adhesion of silica on CIP. The chemical structures of APTES and gelatin are shown in Scheme 1. Tetraethyl orthosilicate (TEOS) with a purity of 99+% is commercially obtained from Alfa Aesar. Ammonia (28%, lab grade), ethanol (99%) and tetrahydrofuran (THF, 99%) are purchased from Fisher scientific. All the chemicals are used as-received without any further treatment. | ||
| Scheme 1 Chemical structure of (a) APTES, (b) gelatin and (c) TEOS. | ||
The monomers for the polyurethane are supplied by PRC-Desoto international, Inc, which contains three parts. Part A and C are accelerators and part B is the base compound. The chemical reaction to form the polyurethane is shown in Scheme 2.
 | ||
| Scheme 2 Synthesis of polyurethane. | ||
Preparation of core-shell particles
In a typical silica coating process, CIP (3.0 g) was dispersed in ethanol (120 mL) containing APTES (0.4 mL) at room temperature. After 30 min sonication, the obtained suspension was allowed to age for 1 h to ensure a complete complexation reaction between the amine groups of APTES and CIP surface. To investigate the primer effect on the final shell morphology, gelatin B (1 wt%, 20 mL aqueous solution) was also used to functionalize the CIP surface. The CIP were coated with a uniform layer of silica by a modified Stöber process.16 Briefly, the suspension was vigorously mechanically stirred (500 rpm). Different amounts of TEOS (1.8 or 5 mL) and ammonia (12 or 16 mL) were used in the reaction system to control the silica shell thickness. TEOS was rapidly injected into the suspension and followed by a dropwise addition of ammonia (about 5 min). The reaction was continued for 5 h and then the powders were separated from the mother liquid using a magnet. The powders were washed with ethanol and DI water several times and then dried in a vacuum oven overnight at room temperature to obtain the core-shell CIP-silica particles (called CIP-silica). The final annealing of CIP-silica is at 650 °C for 2 h under H2/Ar atmosphere (hydrogen ratio: 5%), with an aim to complete the reaction from TEOS to silica and reduce the iron oxides. The coating process is schematically shown in Fig. 1.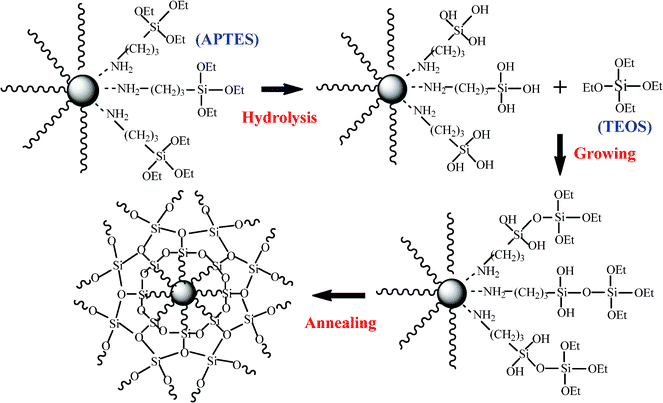 | ||
| Fig. 1 Scheme of the silica coating growth on the particle surface. | ||
Preparation of polymer nanocomposites
The CIP (7.0 g) were initially mixed with a diluted mixture solution containing accelerator part A (0.36 g), catalyst part C (0.40 g) and THF (20.0 mL), following by 1-hour sonication at room temperature to allow the adsorption of accelerator part A and catalyst part C on the CIP surface. And then monomer part B (2.24 g) was added to the suspension and mechanically stirred together at 200 rpm in an ultrasonic bath for one hour. The ultrasonic bath was controlled at 50 °C. The suspension was observed to become more viscous as the reaction proceeded. Finally, the viscous suspension was transferred into a mold and maintained at room temperature for an additional 7 days to ensure a complete reaction and solvent evaporation. Composites with the same loading of CIP-silica (shell thickness: 55 nm) were fabricated following the same procedures. A CIP-silica/PU composite thin film (thickness: ∼10 μm) on glass slide was also prepared from the THF diluted composite solution by using the drop casting method.Characterization
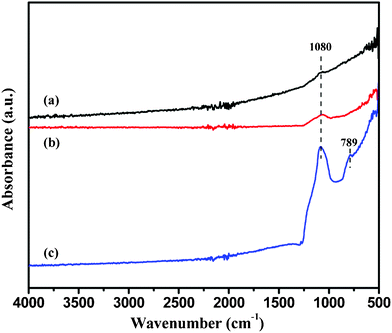
Fourier transform infrared spectroscopy (FT-IR, Bruker Inc. Vector 22, coupled with an ATR accessory) was used to characterize the bare and silica coated CIP in the range of 500 to 4000 cm−1 at a resolution of 4 cm−1.The core-shell structure of the CIP-silica was examined by a transmission electron microscopy (TEM, FEI Tecnai G2 F20) with a field emission gun at a working voltage of 200 kV. The samples were prepared by drying a drop of particles suspended ethanol solution on the carbon-coated copper TEM grids. All images were recorded as zero-loss images by excluding the contributions of the inelastically scattered electrons using a Gatan Image Filter.
The fluorescence images were obtained using Olympus DP72 camera accompanied with Olympus CellSens software. The samples were prepared by immobilizing the particles on a glass slide to form thin film ready for observation. A cover glass is placed on the slide with a drop of water and sealed. The slides were visualized under different objectives of an Olympus BX51 fluorescence microscope.
The thermal stability of the CIP, CIP-silica and their corresponding polyurethane composites was studied with a thermogravimetric analysis (TGA, TA Instruments Q-500). TGA was conducted on these samples from 25 to 800 °C with an air flow rate of 60 mL min−1 and a heating rate of 10 °C min−1.
The anti-corrosion behavior of the CIP and CIP-silica was initially studied by immersing these particles in 1.0 M HCl to compare the durability. Additional stability measurements on the PU composites were carried out according to ASTM B117. Briefly, the specimens were supported between 15 and 30° from vertical and preferably parallel to the principle direction of the fog flow in the chamber, based upon the dominant surface being tested. The fog was such that for each 80 cm2 of the horizontal collecting area, there would be 1.0 to 2.0 mL collected solution per hour. The salt fog was continuously supplied and the exposure period was one week. The salt solution was prepared by dissolving 5 ± 1 parts by mass of sodium chloride in 95 parts of Type IV water, as required by the standard ASTM B117. The pH of the collected solution was from 6.5 to 7.2. The exposure zone of the salt spray chamber was maintained at 35 ± 2 °C.
A high resistance meter (Agilent 4339B) equipped with a resistivity cell (Agilent, 16008B) was used to measure the volume resistivity after inputting the sample thickness. This equipment allows resistivity measurement up to 1016 Ω. The source voltage was set at 0.1 V for all the samples. The reported results represent the mean value of eight measurements with a deviation less than 10%.
The magnetic properties of the particles and composites were carried out in a 9 T physical properties measurement system (PPMS) by Quantum Design at room temperature.
3. Results and discussion
3.1 FT-IR analysis
Fig. 2 shows the FT-IR spectra of the (a) as-received CIP, (b) as-prepared CIP-silica and (c) CIP-silica after annealing at 650 °C for 2 h under H2/Ar atmosphere. The intensified band strength at 1080 cm−1 in spectra (b) and (c) as compared to (a) originates from the asymmetric stretching of Si–O–Si bond of silica.38,39 And the new peak at 789 cm−1 on curve (c) is attributed to the symmetric stretching of Si–O–Si bond after annealing.40 This results indicate that SiO2 is immobilized on the CIP surface.3.2 TEM microstructures of the core-shell particles
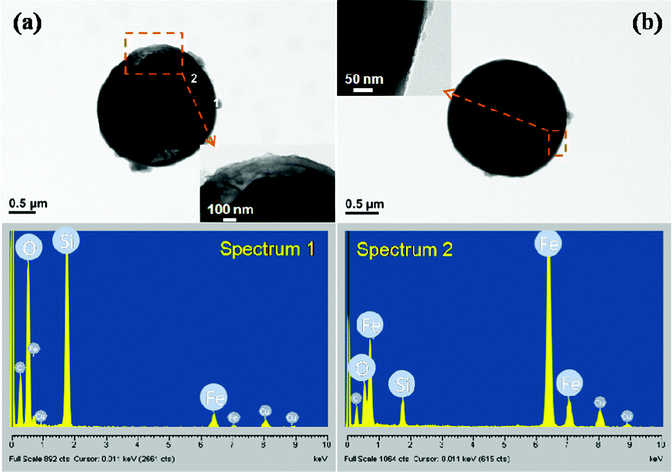 | ||
| Fig. 3 TEM images and EDAX of the core-shell structured particles with a (a) non-sphere core and (b) sphere core CIP particle. | ||
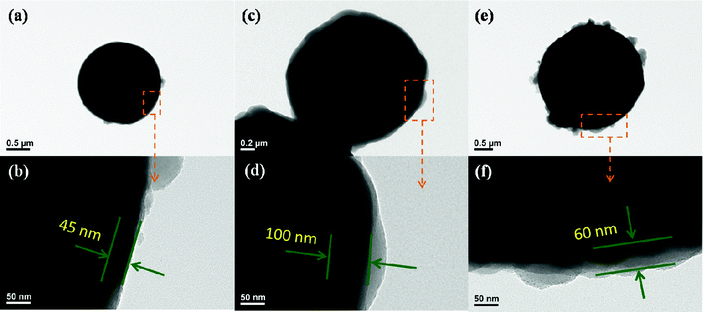 | ||
| Fig. 4 The CIP-silica with different shell thickness and morphology. | ||
The fluorescence images of the particles and composite thin films, taken in both bright field and dark field, are compared, Fig. 5. Fig. 5(a–c) show the CIP, CIP-silica and CIP-silica/PU thin film in bright field, and the particles are aggregated, especially after coating with a silica layer. In the dark field, the CIP did not show any emission signal, Fig. 5(d), indicating that bare CIP are not fluorescent active as expected. After coating a silica layer on the CIP surface, red emission is observed from the CIP-silica, Fig. 5(e). Embedding the CIP-silica in the PU thin film, the red emission signal is still observed in the composites thin film, Fig. 5(f), which indicates that the processing condition would not affect the optical properties of the particles.
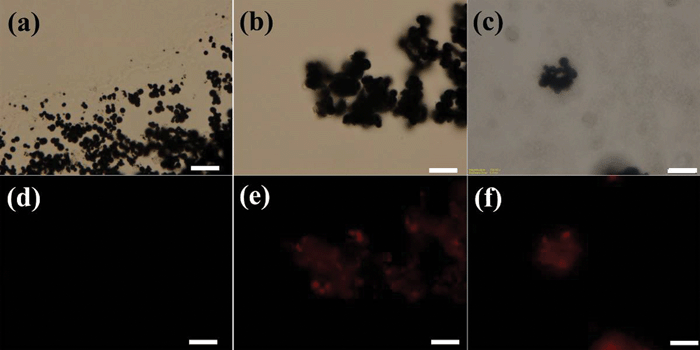 | ||
| Fig. 5 Bright field fluorescence microscopy images of (a)CIP, (b) CIP-silica and (c) CIP-silica/PU film. (d)–(f) Correspond to (a)–(c) in dark field (the scale bar is 10 μm). | ||
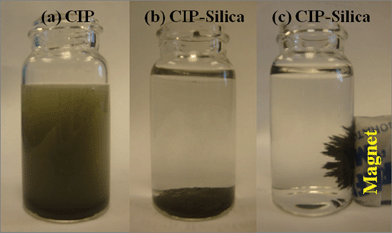 | ||
| Fig. 6 The corrosion test of (a)CIP and (b) CIP-silica in 1 M HCl and (c) the CIP-silica attracted by a magnet after a 4 h test. | ||
Fig. 7 shows the CIP and CIP-silica reinforced polyurethane composites after corrosion test with spraying salt fog. A1 and A2 show the two sides of the polyurethane composites filled with CIP. After exposing the sample to the salt fog for 48 h, rust is evident in B1 and B2, especially on the B2 side. The rust is more pronounced after one week exposure. C2 shows serious corrosion with large area of rust. The observed anti-corrosive difference between the two sides of a test sample probably arises from the precipitation of CIP during the curing process. The anti-corrosive performance of the CIP-silica/PU composites has been significantly improved, in D to F. After a 48-hour exposure to the salt fog, no obvious difference is observed between the CIP-silica/PU composites and the original sample, E1 and E2. After one week, only slight amount of rust is observed on one side (F1), and the other side (F2) seems not affected including at the edge. This observation further confirms the protection of the silica shell against corrosion.
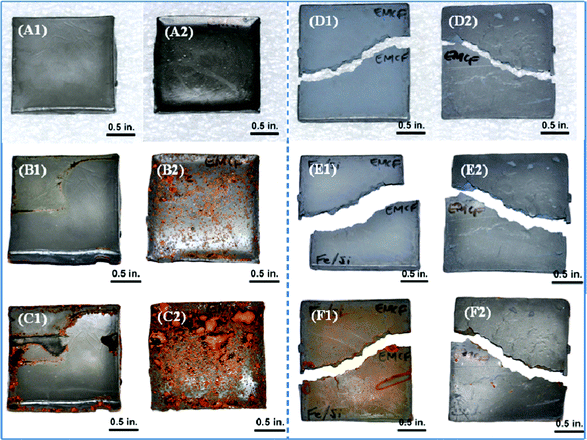 | ||
| Fig. 7 Salt fog exposure tests on the 88 wt% CIP/PU and 88 wt% CIP-silica/PU composites. A, B and C represent the CIP/PU composites under the condition of pre-salt fog exposure, 48 h exposure and one week exposure, respectively. D, E and F stand for the CIP-silica/PU composites tested under the same conditions of pre-salt fog exposure, 48 h and one week exposure, respectively. 1 and 2 stand for the two sides of the sample. | ||
3.3 TGA analysis
The thermal stability of pure PU, CIP and CIP-silica as well as their polyurethane composites is shown in Fig. 8. The cured pure PU begins to decompose at around 250 °C and burns out at 550 °C. All the particles exhibit a significant weight increase in the final stage owing to the oxidation in air at elevated temperatures. The CIP begin to increase the weight at around 200 °C. After coating with a silica shell, the CIP are protected and the oxidation process starts at about 360 °C, which is higher than that of the bare CIP and the complete oxidation is delayed to 650 °C. The final weight of CIP and CIP-silica is ∼1.4 times larger than that of the original weight, which indicates a transition from pure Fe to Fe2O3. After introducing CIP into the PU matrix, the thermal stability of the composites is enhanced in different scales. Generally, composites filled with CIP and CIP-silica show higher thermal stability than that of pure PU as evidenced by the onset degradation temperature (PU: 270.6 °C, CIP/PU: 316.3 °C, and CIP-silica/PU: 294.4 °C). The similar weight increase induced by iron oxidation is also observed in all the composites. As compared with the decomposition of PU, the curve is more complicated within the temperature range of 300–500 °C. It is interesting to observe that the weight increase is higher for the CIP-silica/PU composites than that of CIP/PU composites, which is due to the slight oxidation of CIP during the composite fabrication.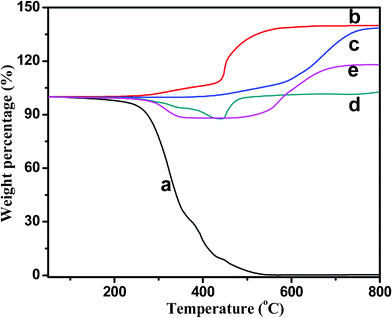 | ||
| Fig. 8 TGA curve of (a) pure PU, (b)CIP, (c) CIP-silica, (d) 88 wt% CIP/PU composites, and (e) 88 wt% CIP-silica/PU composites. | ||
3.4 Electrical conductivity
Fig. 9 shows the volume resistivity of pure PU and the composites filled with 88 wt% CIP and CIP-silica, respectively. Pure PU shows a volume resistivity around 1011 ohm cm, which is in good agreement with the other reported value.42 It is interesting to observe that the composites filled with 88 wt% (∼50 vol%) CIP still behave like an insulator despite a reduction in resistivity of around 70%. Comparing with the prominent geometrical models created by Kirkpatrick43 and Zallen,44 the required minimum touching spherical particles is 16 vol%. This value is in approximate agreement with most experimental observations that the critical volume fraction is between 5 and 20 vol% for polymer composites filled with powdery materials.25 However, the insulating property of these composites may ascribe to the uniform polymer coating on CIP surface from a surface initiated polymerization method, which prevents the direct contact among the CIP. After coating the CIP with a silica shell (55 nm), the corresponding composites exhibit higher volume resistance than that of the bare CIP, which is due to the insulating effect of the silica coating on the CIP surface.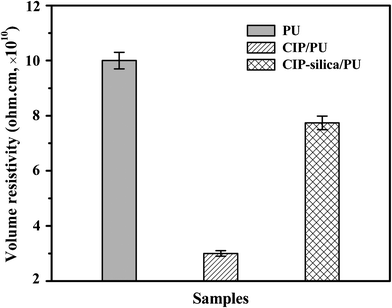 | ||
| Fig. 9 Volume resistivity of (a) pure PU, and 88 wt% (b)CIP and (c)CIP-silica polyurethane composites. | ||
3.5 Magnetic property
Fig. 10 shows the room-temperature magnetic hysteresis loops of the as-received CIP and CIP-silica with different shell thickness. The saturation magnetization (Ms) is evaluated at the state when an increase in the magnetic field can not increase the magnetization of the material further. The CIP show a Ms of 125 emu/g, while an increased or decreased Ms is observed in the CIP-silica coated with different silica layer thickness. The increased Ms is observed with a silica layer thickness from 45 to 60 nm, which is primarily due to the annealing process under H2 environment, under which iron oxide is converted to magnetically stronger iron. The particles with a silica shell thickness of 45 nm reach a Ms value of about 200 emu/g. With a thicker silica layer of 55-60 nm, Ms is decreased to ∼170 emu/g, which is still higher than that of the as-received CIP (125 emu/g). With further increase of the shell thickness to 100 nm, a lower Ms of 100 emu/g is observed. Apparently, larger silica shell thickness leads to a lower Ms of the core-shell particles, which is due to the lower weight fraction of the magnetic part in the core-shell particles. The shell weight ratio in the core-shell particles with different thickness is calculated and listed in Table 1. From the table, the weight ratio of the silica shell increased from 4.5% to 9.9% with increasing shell thickness from 45 nm to 100 nm. Theoretically, the maximum reduction in Ms is 9.9% from CIP to CIP-silica (100 nm) excluding any other possibilities affecting the Ms. However, the magnetization is reduced 20% (from 125 to 100 emu/g), which is consistent with the formed nonmagnetic Fe2SiO4 and antiferromagnetic oxide layers surrounding the Fe metallic core.41 During the coating process, the thick silica shell could serve as a barrier that prevents hydrogen from reducing the iron oxides on CIP surface. It is interesting to observe that CIP-silica (60 nm) could exhibit higher Ms than that of CIP-silica (55 nm). We suggest it could be due to the rougher shell structure (using gelatin as primer), which favors the H2 diffusion. The coercivity (Hc, Oe) is the applied external magnetic field that is required to return the material to a zero magnetization. The remnant magnetization (Mr) is the residual magnetization after the applied field is reduced to zero. Both values are negligible in all the samples, which indicate a superparamagnetic state of each sample.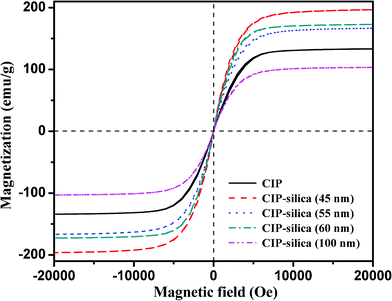 | ||
| Fig. 10 Magnetic hysteresis loops of CIP and silica coated CIP at room temperature. | ||
| No. | Rcore/μm | Rshell/μm | Vcore/μm3 | Vshell/μm3 | Vshell/Vcore-shell | Wshell/Wcore-shell |
|---|---|---|---|---|---|---|
| a Density data used for calculation: ρcore = 7.87 g cm−3, ρshell = 2.63 g cm−3. | ||||||
| 1 | 1 | 0.045 | 4.19 | 0.59 | 0.12 | 0.045 |
| 2 | 1 | 0.055 | 4.19 | 0.73 | 0.15 | 0.055 |
| 3 | 1 | 0.060 | 4.19 | 0.80 | 0.16 | 0.060 |
| 4 | 1 | 0.100 | 4.19 | 0.39 | 0.25 | 0.099 |
Fig. 11 shows the magnetic hysteresis loops of the PU composites filled with 88 wt% CIP-silica. The composites exhibit an Ms of 156 emu/g. Like the CIP and CIP-silica, the sample exhibits negligible coercivity and remnant magnetization, which correspond to a superparamagnetic behavior.
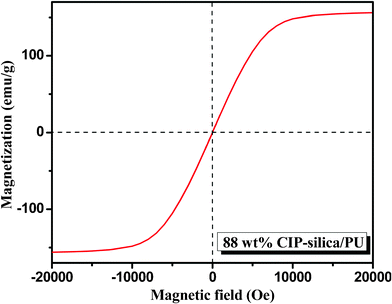 | ||
| Fig. 11 Hysteresis loops of the PNCs filled CIP-silica (silica shell thickness 55 nm). | ||
4. Conclusion
Fluorescent CIP-silica particles were prepared using a modified Stöber process. The silica shell thickness is controlled by the ratio of TEOS and ammonia, which can be adjusted from 45 nm to 100 nm. The silica coated CIP are more thermally and chemically stable based on the results from TGA and acid corrosive test. The Ms of the CIP-silica is higher than that of CIP, which is due to the reduction of iron oxide to iron under a hydrogen atmosphere. Polyurethane composites filled with CIP and CIP-silica using the SIP method exhibit a strong interfacial interaction between the two phases as evidenced by the enhanced thermal stability over that of pure PU. The CIP-silica/PU composites show much higher corrosion resistivity than CIP/PU after one week salt fog test. The insulating silica layer on the magnetic particle surface improves the resistivity of the polymer composites and introduces the unique fluorescence to these hybrid magnetic core particles.Acknowledgements
This project is supported by Northrop Grumman Corporation and National Science Foundation - Chemical and Biological Separations (CBET: 11-37441) managed by Dr Rosemarie D. Wesson. We also appreciate the support from Nanoscale Interdisciplinary Research Team and Materials Processing and Manufacturing (CMMI 10-30755) to purchase TGA and DSC. D. P. Young acknowledges support from the NSF under Grant No. DMR 04-49022.References
- L. Babes, B. Denizot, G. Tanguy, J. J. Le Jeune and P. Jallet, J. Colloid Interface Sci., 1999, 212, 474 CrossRef CAS.
- A. Truchaud, B. Capolaghi, J. P. Yvert, Y. Gourmelin, G. Glikmanas and M. Bogard, Pure Appl. Chem., 1991, 63, 1123 Search PubMed.
- Z. Lu, M. D. Prouty, Z. Guo, V. O. Golub, C. S. S. R. Kumar and Y. M. Lvov, Langmuir, 2005, 21, 2042 CrossRef CAS.
- K. E. McCloskey, J. J. Chalmers and M. Zborowski, Anal. Chem., 2003, 75, 6868 CrossRef CAS.
- S. Miltenyi, W. Müller, W. Weichel and A. Radbruch, Cytometry, 1990, 11, 231 CrossRef CAS.
- D. Zhang, S. Wei, C. Kaila, X. Su, J. Wu, A. B. Karki, D. P. Young and Z. Guo, Nanoscale, 2010, 2, 917 RSC.
- S. Wei, Q. Wang, J. Zhu, L. Sun, H. Lin and Z. Guo, Nanoscale, 2011, 3, 4474 RSC.
- X.-C. Sun and N. Nava, Nano Lett., 2002, 2, 765 CrossRef CAS.
- J. Zhu, S. Wei, Y. Li, S. Pallavkar, H. Lin, N. Haldolaarachchige, Z. Luo, D. P. Young and Z. Guo, J. Mater. Chem., 2011, 21, 16239 RSC.
- Z. Guo, M. Moldovan, D. P. Young, L. L. Henry and E. J. Podlaha, Electrochem. Solid-State Lett., 2007, 10, E31 CrossRef CAS.
- D. Zhang, R. Chung, A. B. Karki, F. Li, D. P. Young and Z. Guo, J. Phys. Chem. C, 2009, 114, 212.
- J. Zhu, S. Wei, N. Haldolaarachchige, D. P. Young and Z. Guo, J. Phys. Chem. C, 2011, 115, 15304 CrossRef CAS.
- J. Guo, W. Yang, C. Wang, J. He and J. Chen, Chem. Mater., 2006, 18, 5554 CrossRef CAS.
- J. Kim, H. S. Kim, N. Lee, T. Kim, H. Kim, T. Yu, I. C. Song, W. K. Moon and T. Hyeon, Angew. Chem., 2008, 120, 8566 CrossRef.
- P. R. Krauss and S. Y. Chou, Appl. Phys. Lett., 1997, 71, 3174 Search PubMed.
- W. Stöber, A. Fink and E. Bohn, J. Colloid Interface Sci., 1968, 26, 62 CrossRef.
- A. M. Homola and S. L. Rice, US Patent No. 4 280, 1981, 918 Search PubMed.
- M. Ohmori and E. Matijevic, J. Colloid Interface Sci., 1992, 150, 594 CrossRef CAS.
- R. I. Nooney, D. Thirunavukkarasu, Y. Chen, R. Josephs and A. E. Ostafin, Langmuir, 2003, 19, 7628 CrossRef CAS.
- Y. Yin, Y. Lu, Y. Sun and Y. Xia, Nano Lett., 2002, 2, 427 CrossRef CAS.
- G. Wang and A. Harrison, J. Colloid Interface Sci., 1999, 217, 203 CrossRef.
- W. Fu, H. Yang, B. Hari, S. Liu, M. Li and G. Zou, Mater. Chem. Phys., 2006, 100, 246 Search PubMed.
- Y. Lu, Y. Yin, B. T. Mayers and Y. Xia, Nano Lett., 2002, 2, 183 CrossRef CAS.
- J. Zhu, S. Wei, J. Ryu, M. Budhathoki, G. Liang and Z. Guo, J. Mater. Chem., 2010, 20, 4937 RSC.
- J. Zhu, S. Wei, J. Ryu, L. Sun, Z. Luo and Z. Guo, ACS Appl. Mater. Interfaces, 2010, 2, 2100 CrossRef CAS.
- J. Zhu, S. Wei, M. Alexander, Jr., T. D. Dang, T. C. Ho and Z. Guo, Adv. Funct. Mater., 2010, 20, 3076 CrossRef CAS.
- Z. Guo, S. E. Lee, H. Kim, S. Park, H. T. Hahn, A. B. Karki and D. P. Young, Acta Mater., 2009, 57, 267 CrossRef CAS.
- J. Klánová, P. Èupr, J. Kohoutek and T. Harner, Environ. Sci. Technol., 2007, 42, 550.
- W. M. Huang, B. Yang, Y. Zhao and Z. Ding, J. Mater. Chem., 2010, 20, 3367 RSC.
- Z. Guo, T. Y. Kim, K. Lei, T. Pereira, J. G. Sugar and H. T. Hahn, Compos. Sci. Technol., 2008, 68, 164 CrossRef CAS.
- Z. Guo, S. Park, H. T. Hahn, S. Wei, M. Moldovan, A. B. Karki and D. P. Young, Appl. Phys. Lett., 2007, 90, 053111 CrossRef.
- Z. Guo, S. Park, H. T. Hahn, S. Wei, M. Moldovan, A. B. Karki and D. P. Young, J. Appl. Phys., 2007, 10, 09M511 Search PubMed.
- J.-M. Hu, J.-T. Zhang, J.-Q. Zhang and C.-N. Cao, Corros. Sci., 2005, 47, 2607 Search PubMed.
- G. Paliwoda-Porebska, M. Stratmann, M. Rohwerder, K. Potje-Kamloth, Y. Lu, A. Z. Pich and H. J. Adler, Corros. Sci., 2005, 47, 3216 Search PubMed.
- I. Pastoriza-Santos, J. Pérez-Juste and L. M. Liz-Marzán, Chem. Mater., 2006, 18, 2465 CrossRef CAS.
- F. G. Aliev, M. A. Correa-Duarte, A. Mamedov, J. W. Ostrander, M. Giersig, L. M. Liz-Marzán and N. A. Kotov, Adv. Mater., 1999, 11, 1006 CrossRef CAS.
- V. Yong and H. T. Hahn, J. Mater. Res., 2009, 24, 1553 Search PubMed.
- H. Hu, Z. Wang, L. Pan, S. Zhao and S. Zhu, J. Phys. Chem. C, 2010, 114, 7738 CrossRef CAS.
- Y. Chen and J. O. Iroh, Chem. Mater., 1999, 11, 1218 CrossRef CAS.
- D. Y. kong, M. Yu, C. K. Lin, X. M. Liu, J. lin and J. Fang, J. Electrochem. Soc., 2005, 152, H146 Search PubMed.
- P. Tartaj and C. J. Serna, J. Am. Chem. Soc., 2003, 125, 15754 CrossRef CAS.
- H. Kim, Y. Miura and C. W. Macosko, Chem. Mater., 2010, 22, 3441 CrossRef CAS.
- S. Kirkpatrick, Rev. Mod. Phys., 1973, 45, 574 CrossRef.
- R. Zallen, The Physics of Amorphous Solids, 1983, New York: Wiley Search PubMed.
| This journal is © The Royal Society of Chemistry 2012 |

