Synthesis, properties and highly selective mitochondria staining with novel, stable and superior benzothiadiazole fluorescent probes†
Brenno A. D.
Neto
*a,
Pedro H. P. R.
Carvalho
a,
Diego C. B. D.
Santos
a,
Claudia C.
Gatto
a,
Luciana M.
Ramos
ab,
Nathalia M. de
Vasconcelos
a,
José R.
Corrêa
a,
Maísa B.
Costa
b,
Heibbe C. B.
de Oliveira
a and
Rafael G.
Silva
c
aLaboratory of Medicinal and Technological Chemistry, University of Brasília (IQ-UnB). Campus Universitário Darcy Ribeiro, CEP 70904970, P.O.Box 4478, Brasília-DF, Brazil. E-mail: brenno.ipi@gmail.com
bLaboratorio de Química Orgânica, IQ, UEG: UnUCET, Anápolis-Go, Brasil
cDepartment of Biochemistry, Albert Einstein College of Medicine of Yeshiva University, Bronx-NY, USA
First published on 20th December 2011
Abstract
The present manuscript describes the synthesis of two novel 2,1,3-benzothiadiazole (BTD) derivatives containing an excited state intramolecular proton transfer (ESIPT) site. Photophysical properties, X-ray analysis, ESIPT and intramolecular charge-transfer (ICT) of these novel fluorescent monosubstituted BTD derivatives were investigated. It is also shown that ESIPT and ICT can take place concomitantly. Theoretical calculations (ab initio and DFT) corroborate the high stability of these derivatives in the excited state due to efficient ESIPT and ICT processes. Also, the optimized calculated geometries of these new structures allowed a better understanding of the different behaviour of the dyes in a wide pH range (1–13). Finally, the new compounds exhibit impressive cellular selectivity and stain only mitochondria in different cell lines and are far better than the commercially available MitoTracker-red.
Introduction
Mitochondria play an essential role in the energy metabolism of eukaryotic cells.1 Since mitochondria are primary producers of ATP, regulators of ion homeostasis and free radicals,2 they are considered to be extremely important organelles. Mitochondria dysfunction is directly related to a large number of diseases. Moreover, they are directly involved in the intrinsic apoptotic pathways. It is also well known that mitochondria morphology depends on the nature of the cells and their activity, showing these organelles can be found in dynamic networks.1 In this sense, it is imperative the development of new, efficient and selective fluorescent dyes in order to have a proper cellular mitochondria staining to study their processes.3 Small molecule fluorescent probes help assess cellular status and components, serving as a powerful tool in biomedical research.4 It is possible to find many different strategies and molecular architectures to improve the efficiency and selectivity of a small molecule fluorescent probe for cellular organelles.52,1,3-Benzothiadiazole (BTD) derivatives are an attractive class of fluorophores used in a wide range of (bio)technological light applications. For instance, BTD (Fig. 1) fluorescent derivatives have been used as chemical dosimeters for mercury detection,6protein detection and quantification,7 photo-voltaic devices8 and many others.9 Its derivatives normally possess several desirable characteristics: (i) this heterocyclic is a strong electron withdrawing core and compounds bearing this unit are possible candidates for electron carriers; (ii) BTD-containing compounds are expected to form well-ordered crystal structures due to the highly polarized properties leading to intermolecular interactions such as heteroatom contacts or π–π interactions; (iii) such derivatives can be used as units of electron acceptors for conducting materials. Such characteristics are essential for organic light technology. Recently, we have demonstrated the potential of BTD-containing fluorophores as live cell-imaging probes,10dyes for real-time PCR,11 and dsDNA selective detection and quantification.12
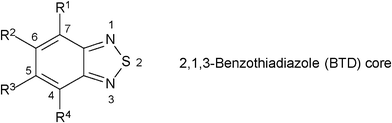 | ||
| Fig. 1 The benzothiadiazole core. | ||
Excited state intramolecular proton transfer (ESIPT) is an important reaction process of stabilization of many fluorophores (Scheme 1).13
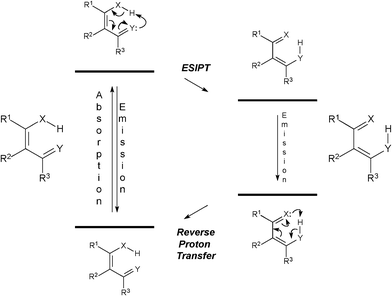 | ||
| Scheme 1 General ESIPT process. X and Y represent general atoms (typically nitrogen and oxygen). | ||
This process is an ultrafast reaction in the excite state which lowers the energy of the structure, thus stabilizing the molecule. ESIPT strongly depends on the conformation adopted by the structure, the nature of the solvent and its ability to form hydrogen bonds with the dye, and on the pH range.14 In addition, charge-transfer processes associated with ESIPT-prone fluorophores are commonly observed, where deactivation processes can take place concomitantly with ESIPT reaction.15Dyes with sites which participate in the process of ESIPT have already been successfully tested to stain Fonsecaea pedrosoi16 and Candida albicans17 fungi.
In this context, it is reasonable to envisage the synthesis of new small molecules (fluorescent probes) combining the desirable characteristics of BTD derivatives and the possibility of ESIPT and intramolecular charge-transfer (ICT) processes of stabilization in the excited state. Herein we describe the synthesis and photophysical properties of two novel BTD derivatives with a site potentially capable of participating in ESIPT, thus rendering the new structures desirable features to biotechnological applications. Moreover, we describe the application of these new BTD derivatives as small fluorescent probes to stain mitochondria in a plethora of cancer cell line in cell-imaging experiments.
Results and discussion
Synthesis and designed molecular architecture of the new BTD derivatives
Two new BTD derivatives, namely BTD–Br and BTD–H, were synthesized as shown in Scheme 2 (see ESI for experimental details and spectral data)†.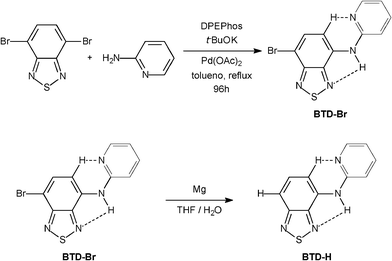 | ||
| Scheme 2 Synthesis of new BTD fluorescent probes. | ||
The fluorophore BTD–Br was obtained from 4,7-dibromo-2,1,3-benzothiadiazole18–20 by a direct Buchwald–Hartwig amination, and the product was isolated in 47% yield after chromatographic purification. BTD–H was synthesized from BTD–Br in 23% yield after purification. The molecular architecture was designed to bear some desirable characteristics for efficient ESIPT (and ICT): (i) good planarity, (ii) possibility of intramolecular hydrogen bond (H–bond), and (iii) rigid conformation. Hence, the presence of a basic nitrogen in the pyridine moiety is crucial envisaging a second intramolecular H–bond, consequently increasing the rigidness and planarity of these dyes. To test this hypothesis, X-ray analyses of the molecules were carried out.
X-ray analysis
The molecular structures as deduced from X-ray diffraction (from single crystals) are presented in Fig. 2. Selected bonds, angles and distances, are summarized in Tables S1–S3 in the ESI.† Crystal and structure refinement data are summarized in Table 1.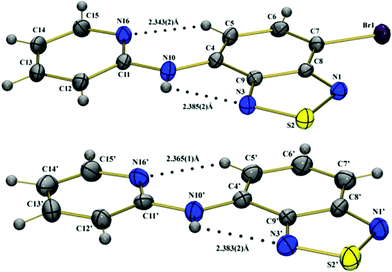 | ||
| Fig. 2 Molecular structures of the BTD–Br (top) and BTD–H (bottom) showing crystallographic labeling. The dotted lines denote H–bonds. | ||
| BTD–Br | BTD–H | |
|---|---|---|
| a R1 = │Fo - Fc│/│Fo│; wR2 = [w(Fo2 - Fc2)2/(wFo2)] −1/2. | ||
| Chemical formula | C11H7N4SBr | C11H8N4S |
| M/g mol−1 | 307.18 | 228.27 |
| Crystal system | Monoclinic | Monoclinic |
| Space group | P21/c | P2/n |
| Unit cell | ||
| a/Å | 4.385(3) | 22.929(8) |
| b/Å | 23.419(2) | 3.824(2) |
| c/Å | 11.243(1) | 23.213(8) |
| β (°) | 100.743(6) | 93.832(2) |
| V/Å3 | 1134.30(2) | 2030.89(2) |
| Z | 4 | 8 |
| Linear absorption coefficient (mm−1) | 3.789 | 0.292 |
| Measured reflections | 10![[thin space (1/6-em)]](https://www.rsc.org/images/entities/char_2009.gif) 203 203 |
24791 |
| Independent reflections/Rint | 2607/0.0595 | 4259/0.1326 |
| Refined parameters | 183 | 330 |
| Absorption correction | Semi-empirical from equivalents | Semi-empirical from equivalents |
| Tmin/Tmax | 0.60/0.72 | 0.89/0.98 |
| Refinement method | Least-squares on F2 | Least-squares on F2 |
| F(000) | 608 | 944 |
| Theta range for data collection (°) | 1.74–27.51 | 1.76—26.67 |
| Limiting indices | −5 ≤ h ≤ 5 | −28 ≤ h ≤ 28 |
| −27 ≤ k ≤ 30 | −4 ≤ k ≤ 4 | |
| −14 ≤ l ≤ 10 | −29 ≤ l ≤ 29 | |
| Goodness-of-fit (F2) | 0.998 | 0.930 |
| R 1 (F)/wR2 (F2) (I > 2σ (I))a | 0.0399/0.0644 | 0.0622/0.1270 |
| Extinction coefficient | 0.0026(6) | 0.0075(9) |
| Largest diff. peak and hole/e Å−3 | 0.310 and −0.296 | 0.309 and −0.388 |
In BTD–H there are two crystallographically independent molecules (denoted by X and X') and the substitution of the H atom by Br (BTD–Br) favors the modification in the crystal packing of the molecules in each case, and the monoclinic crystal system was observed (Figures S1 and S2 in the ESI)†. The compounds BTD–Br and BTD–H have basic similarities of molecular geometry, morphological accordance, and intermolecular interaction in their crystal structures.
In the solid state, BTD–Br and BTD–H clearly displayed rigid conformations and high planarity. The torsion angle of the ring N(1)–S(2)–N(3)–C(9) is 0.2(2)° in BTD–Br, −0.1(4)° and 0.2(4)° in BTD–H. The torsion angle of N(16)–C(11)–N(10)–C(4) is −6.2(5)° in BTD–Br, 12.3(8)° and 1.4(9)° in BTD–H. It is noteworthy that these are desirable features to efficient ESIPT reaction.
Spectroscopic studies and the crystal structure of BTD–Br and BTD–H indicate that one proton can be transferred through an H–bond in N(10)–H(10)⋯N(3). An intramolecular H–bond with H(10)⋯N(3) distance of 2.38(2) Å is seen for both dyes. Interestingly, a second intramolecular H–bond was observed in both structures. C(5)–H(5)⋯N(16) distances are 2.34(2) and 2.37(2) Å, respectively. The second hydrogen bond helps to stabilize the molecular structure (see Table S3 in the ESI)†, strongly contributing to its rigidity. Intermolecular H–bonds are also observed in the crystal structure of the compound BTD–H N(10)–H(10)⋯N(1′)i with H(10)⋯N(1′) distance 2.35(5) Å (symmetry operation i x, y, z-1).
Spectrophotometric and spectrofluorometric analyses
In order to investigate the ESIPT and ICT contributions of these new compounds, solvatochromic effects (by spectrophotometric and spectrofluorometric analyses) were carried out, and the results are summarized in Table 2. UV-VIS spectra are shown in the ESI (Figure S3)†.| Dye | Solvent | λ max (abs) (nm) | log ε | λ max (em) (nm) | Stokes shift (nm) |
|---|---|---|---|---|---|
| a Φ f = 0.15. b Φ f = 0.31. Where Φf denotes the quantum yield of fluorescence. | |||||
| BTD – Br | Ethyl acetate | 442 | 4.17 | 504 | 62 |
| Acetonitrile a | 438 | 4.15 | 512 | 74 | |
| Dichloromethane | 441 | 4.09 | 510 | 69 | |
| Hexane | 437 | 3.94 | 489 | 52 | |
| Toluene | 442 | 4.08 | 504 | 62 | |
| Ethanol | 443 | 4.06 | 519 | 76 | |
| BTD–H | Ethyl acetate | 423 | 4.13 | 534 | 111 |
| Acetonitrile b | 417 | 3.91 | 550 | 133 | |
| Dichloromethane | 422 | 3.96 | 547 | 125 | |
| Hexane | 417 | 3.70 | 514 | 97 | |
| Toluene | 421 | 3.92 | 536 | 115 | |
| Ethanol | 421 | 3.93 | 560 | 139 |
It is clear from Table 2 that both dyes exhibit large Stokes shifts, especially for BTD–H derivative with values ranging from 97–139 nm, commonly observed for fluorophores that undergo ESIPT. Moreover, independently of the solvent, the lowest energy absorption bands are assigned to π–π* transitions by virtue of their large molar extinction coefficients (log ε values in the range of 3.94–4.17 mM−1 cm−1 for BTD–Br and 3.70–4.13 mM−1 cm−1 for BTD–H), which is a spectroscopic signature of ESIPT process.21 Furthermore, large Stokes shifts suggest a significant structural change in the excited state compared with the ground state.22 Such structural change agrees with the ultrafast ESIPT from the Franck–Condon state.23
The molecular architectures of both structures, as discussed before, have a rigid conformation in solution due to the possibility of two intramolecular hydrogen bonds. This is corroborated by the observation that, regardless of the solvent, maximal absorption wavelengths are similar.
Spectrofluorometric analysis (Fig. 3) shows an interesting and comprehensive feature.
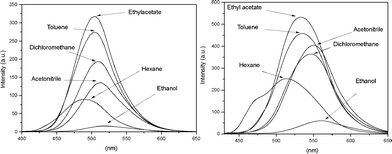 | ||
| Fig. 3 Fluorescence spectra of BTD–Br (left) and BTD–H (right) in different solvents (concentration 1.00 × 10⁻⁵ M). | ||
In the presence of a polar and protic solvent (i.e.ethanol), the fluorescence emission decreases significantly when compared with the other solvents, in agreement with the expected intermolecular H-bond interactions between the solvent (ethanol) and the dyes, as shown in Scheme 3, distorting the substituent at position 4- of the BTD ring. Thus, ESIPT is drastically compromised.24 The more acidic hydrogen (N–H) may also interact with the oxygen electron pairs of the solvent. The net result of all solvent–solute interactions is a distortion of the two parts of the structure, therefore resulting in a drastic decrease of the fluorescence and, once more, indicating that in a proper solvent (e.g.ethyl acetate or acetonitrile) the efficiency of ESIPT (and ICT) of the designed structures is increased.
 | ||
| Scheme 3 Possibilities of hydrogen bonds with protic solvents (e.g.ethanol). Note that H–bonds are the cause of a rotation between the BTD and the substituent. | ||
With the data obtained (Stokes shift) with the six different solvents (with different polarities) from spectrophotometric and spectrofluorometric analyses, it was possible to evaluate the ICT process in the first excited state using the classical Lippert-Mataga plot (Fig. 4) with the ETN solvent parameter given by Reichardt.25
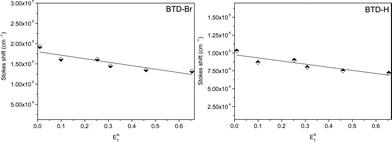 | ||
| Fig. 4 Stokes shift (cm−1) of both dyesvs.ETN values for the six tested solvents. | ||
To be sure about the contribution of ICT, pH variation experiments were also conducted. Since it is well known that pH is a crucial parameter to probe ESIPT and ICT, we decided to investigate the absorption and emission of both dyes in pH values ranging from 1–13. Results are depicted in Fig. 5 (see Figure S4 in the supplementary information material for UV-VIS spectra of both dyes)†.
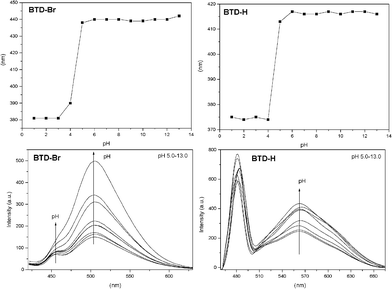 | ||
| Fig. 5 UV-VIS absorption wavelength (top) and fluorescence emission intensity (bottom) as a function of pH (5–13). | ||
It is noteworthy the similar UV-VIS spectra of the tested dyes (Fig. 5, top, and Table 3) and the different fluorescent spectra (Fig. 5, bottom, and Table 3). In the UV-VIS analyses at low pH values (1–4), bands at ≈380 nm (BTD–Br) and at ≈369 nm (BTD–H) are noticed. Upon increase of the pH, red-shifted low energy bands appear at ≈440 nm (BTD–Br) and at ≈415 nm (BTD–H). Both dyes showed a similar behaviour. The observed values of log ε are assigned to π–π* transitions and are comparable in the pH range (1–13), varying in the range of 3.74–4.06 (BTD–Br) and 3.68–4.06 (BTD–H).
| Dye | pH | λ max (abs) (nm) | log ε | λ max (em) (nm) | Stokes shift (nm) |
|---|---|---|---|---|---|
| BTD– Br | 1 | 381 | 3.74 | 435 | 54 |
| 2 | 381 | 3.68 | 435 | 54 | |
| 3 | 381 | 3.83 | 436 | 55 | |
| 4 | 390 | 3.84 | 446 | 56 | |
| 5 | 438 | 3.73 | 455 and 506 | 17 and 68 | |
| 6 | 440 | 3.78 | 458 and 506 | 18 and 66 | |
| 7 | 440 | 3.84 | 458 and 507 | 18 and 67 | |
| 8 | 439 | 3.90 | 457 and 506 | 18 and 67 | |
| 9 | 439 | 3.97 | 458 and 506 | 19 and 67 | |
| 10 | 439 | 3.99 | 458 and 507 | 19 and 68 | |
| 11 | 440 | 4.01 | 458 and 507 | 18 and 67 | |
| 12 | 440 | 4.03 | 457 and 506 | 17 and 66 | |
| 13 | 442 | 4.06 | 457 and 506 | 15 and 64 | |
| BTD–H | 1 | 369 | 3.84 | 420 | 51 |
| 2 | 369 | 3.90 | 420 | 51 | |
| 3 | 369 | 3.88 | 420 | 51 | |
| 4 | 373 | 3.87 | 421 | 48 | |
| 5 | 414 | 3.68 | 478 and 562 | 64 and 148 | |
| 6 | 415 | 3.71 | 479 and 563 | 64 and 148 | |
| 7 | 417 | 3.77 | 482 and 566 | 65 and 149 | |
| 8 | 415 | 3.79 | 480 and 564 | 65 and 149 | |
| 9 | 418 | 3.84 | 483 and 567 | 65 and 149 | |
| 10 | 417 | 3.87 | 484 and 565 | 67 and 148 | |
| 11 | 417 | 3.90 | 483 and 567 | 66 and 150 | |
| 12 | 416 | 3.92 | 481 and 566 | 65 and 150 | |
| 13 | 418 | 4.06 | 481 and 565 | 63 and 147 |
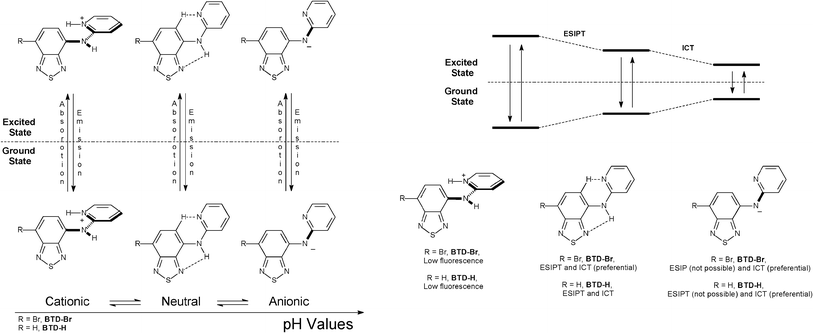
For fluorescence experiments, the pH profile helps understand the deactivation mechanism of these dyes, as expected. In more acidic pH values (pH = 1–4) it is observed a band at ≈435 nm (BTD–Br) and at ≈420 nm (BTD–H), related to the cationic (protonated) form of the studied dyes. Upon increasing the pH (from 5 to 13), red-shifted bands appear at ≈457 nm (BTD–Br) and ≈480 nm (BTD–H). At high pH (i.e. pH = 9–13), dye molecules are likely to be found in their anionic form; thus an ICT effectively takes place, likely an ICT signalling process, as recently published.26 For instance, at pH = 13, a competition between ESIPT and ICT is expected, since a large concentration of anionic species (ICT only) it is likely to be found, allowing an unambiguous assignment of the ICT band. As a consequence, it is more than reasonable to establish that the low energy bands at ≈505 nm (BTD–Br) and ≈565 nm (BTD–H) are due to ICT in both neutral and anionic forms. It is worth noting that it has already been established that ICT happens easily with the increase of the solvent polarity (aqueous media in the current case) due to the stabilization of a more polar charge-transfer state, which decreases the intrinsic activation energy, as previously described.15 N–H bonds in BTD–Br are clearly more acidic than the corresponding N–H bonds in BTD–H. Thus it is observed a more intense band at ≈505 nm. Then, the band at ≈457 nm can be attributed to the ESIPT process. Since the N–H bonds are less acidic in BTD–H, the ESIPT band is also very intense (≈480 nm); thus the charged and the neutral species tend to be in equilibrium in aqueous solution, with a low energy emission band at ≈565 nm. Similar phenomenon has been previously described for different ESIPT sites-containing dyes;27,28 also in zwitterionic forms.29Scheme 4 shows a rationale of the pH effect in the fluorescence emission and dissipation mechanisms from the cationic, neutral and anionic derivatives of BTD–Br and BTD–H.
 | ||
| Scheme 4 Effect of pH in the fluorescence emission and dissipation processes of BTD–Br and BTD–Hdyes. Note that in acidic pH (1–4), the dyes can be protonated in other basic site (not shown for clarity). | ||
The adopted conformation of the structures is also based in ab initio and Density Functional Theory (DFT) calculations, as will be discussed below. The observed equilibrium of the species (under different pH values) has already been described.30 A previous work has been published demonstrating that in aqueous solutions, at near neutral pH, species have a tendency to be predominantly neutral, whereas at lower and higher pH values they tend to be cationic and anionic, respectively.31
Theoretical calculations
All theoretical calculations were carried out using the Gaussian 09 suite of programs. Optimizations for ground state (S0) were performed using the ab initio Hartree–Fock (HF) and DFT methods, while the configuration interaction with single excitation (CIS) method was employed to optimize the geometries for first excited state (S1). All calculations were performed using the 6-311+G(2d,p)/LANL2DZ basis set (i.e.LANL2DZ pseudo potential for bromine and the 6-311+G(2d,p) split-valence basis set for all other atoms). See the supplementary material for all calculation details.Fig. 6 shows the optimized geometries of anionic, neutral, and acidic species of BTD–Br and BTD–H. The optimized geometries of neutral species are in accordance with X-ray diffraction patterns of these compounds. Selected geometric and electronic data are summarized in Table 4. See Table S4† to access the complete electronic properties of the optimized structures.
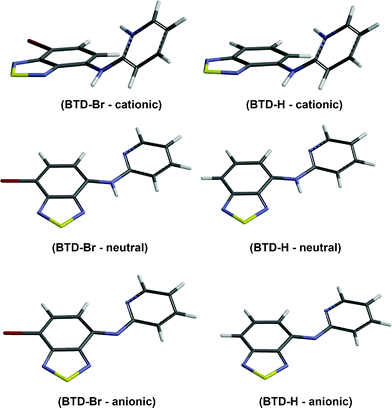 | ||
| Fig. 6 Optimized geometries of cationic, neutral and anionic species of BTD–Br and BTD–H obtained from B3LYP/6-311+G(2d,p)/LANL2DZ level. Note the absence of N–H bonds in anionic forms. | ||
| Structure form | d (Å) N–H⋯N(BTD) | d (Å) C–H(BTD)⋯N(Py) | Band gap energy (eV)a |
|---|---|---|---|
| a Difference of HOMO and LUMO energies. b Torsion angle (BTD and pyridine moieties) of 124.89°. c Torsion angle (BTD and pyridine moieties) of 124.77°. d Deprotonated form—no possible ESIPT reactions. | |||
| BTD–Br (cationic) | 2.585 | Not importantb | 3.479275 |
| BTD–Br (neutral) | 2.307 | 2.300 | 3.323900 |
| BTD–Br (anionic) | —d | 2.231 | 2.417206 |
| BTD–H (cationic) | 2.551 | Not importantc | 3.773977 |
| BTD–H (neutral) | 2.304 | 2.308 | 3.483630 |
| BTD–H (anionic) | —d | 2.237 | 2.468908 |
Under acidic conditions, it is possible to find protonated species of both dyes. The effect is the loss of conjugation due to a pronounced torsion between the BTD ring and the pyridine ring (see Fig. 6 and values in Table 4). As a consequence, higher values of band gap (HOMO and LUMO energy difference) are found, thus the absorption band is blue-shifted comparing with those of neutral and anionic forms (see Fig. 5, top, for maximal absorption wavelengths).
Interestingly, the anionic species sustain their planarity (for BTD–Br and BTD–H). Furthermore, the distance between the pyridine nitrogen and the C–H of the BTD ring (Py–N⋯H–C–BTD) becomes slightly shorter than those noted in the neutral forms (see Table 4). It is believed that these intramolecular hydrogen interactions are responsible for the planarity in basic pH and also allow a proper geometry for efficient ICT, resulting in intense emission bands above 500 nm. It should be pointed out that in basic pH is possible to find an equilibrium between anionic and neutral species. The adopted conformations favour efficient ESIPT and ICT processes. Scheme 5 shows the proposed mechanism for ESIPT.
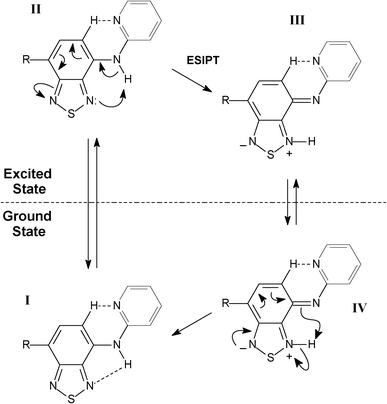 | ||
| Scheme 5 Proposed mechanism for ESIPT in BTD–Br and BTD–Hdyes. | ||
Molecule I is excited upon irradiation absorption leading to II, which undergoes the proton transfer (ESIPT) forming a zwitterionic molecule (III). Compound III emits fluorescence leading to IV, when a reverse proton transfer occurs restoring the original molecule I. HOMO and LUMO orbitals (electronic map distribution) were also calculated and are shown in Fig. 7. See supplementary material (Figures S5–S8)† to access the calculated orbitals (electronic map) of anionic and cationic derivatives of BTD–Br and BTD–H.
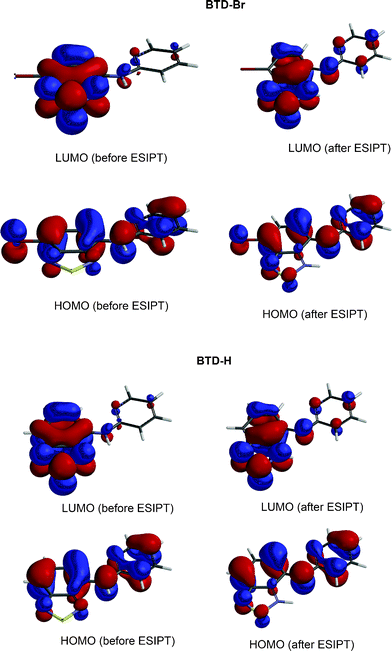 | ||
| Fig. 7 Molecular orbitals (HOMO and LUMO) as obtained in B3LYP/6-311+G(2d,p)/LANL2DZ level of calculation. | ||
As depicted in Fig. 7, both HOMO and LUMO are of π type. However, their phases are not equal for the molecules before and after the reaction. In the electronic map (Fig. 7), a similar distribution before and after the reaction in the excited state for BTD–Br and BTD–Hdyes is shown. Equally, an enrichment of the electronic density projection in the HOMO over the bridge-nitrogen (N between BTD and pyridine moieties) is observed, which is interesting considering the reverse process. The LUMO, however, showed a drastic change on the electronic map, displaying a distribution less concentrated over the BTD ring after the process. Before the ESIPT reaction, LUMO has an anti-bonding character largely across the BTD ring, accounting for the new conformation and orbital distribution after the process. Thus, the C![[double bond, length as m-dash]](https://www.rsc.org/images/entities/char_e001.gif) C bond migration is expected to happen as shown in Scheme 5, leading to a new stabilization through electronic redistribution. These observations indicate that molecular orbital analysis can effectively dictate the efficiency of ESIPT and the inoperativeness of the reverse process in the excited state during the dissipation mechanism in the studied molecular systems. These findings are in agreement with previous theoretical analyses of molecular orbitals in ESIPT site-containing molecules.32,33
C bond migration is expected to happen as shown in Scheme 5, leading to a new stabilization through electronic redistribution. These observations indicate that molecular orbital analysis can effectively dictate the efficiency of ESIPT and the inoperativeness of the reverse process in the excited state during the dissipation mechanism in the studied molecular systems. These findings are in agreement with previous theoretical analyses of molecular orbitals in ESIPT site-containing molecules.32,33
Cell-imaging experiments
Finally, we tested both fluorescent compounds (BTD–Br and BTD–H) in cell-imaging experiments against MCF-7 cancer cell line (breast cancer cells). The cell images (Fig. 8, 9A–D and 10A–D) showed intense staining, promoted by both markers, distributed in the cytoplasm. The staining was very selective for mitochondria and almost no background fluorescence could be observed.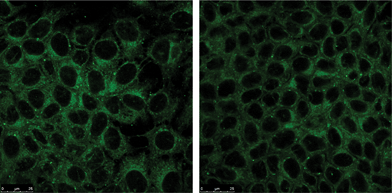 | ||
| Fig. 8 MCF-7 cancer cell mitochondria selectively stained with BTD–Br (left) and BTD–H (right). | ||
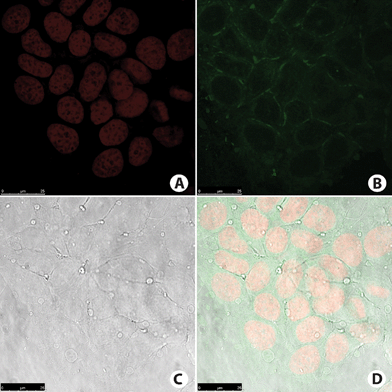 | ||
| Fig. 9 MCF-7 cancer cell staining. (A) Cell nucleus stained with TO-PRO-3 (red). (B) Fluorescence signal from cells incubated with compound BTD–Br (green). Note that no nucleus was stained. (C) Phase contrast image of the cells. (D) Overlay of all fluorescence signals plus phase contrast image of the cells. | ||
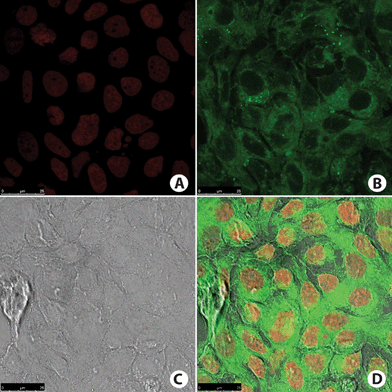 | ||
| Fig. 10 MCF-7 cancer cells. (A) Cell nucleus stained with TO-PRO-3 (red). (B) Fluorescence signal from cell incubated with BTD–H (green). Note that no nucleus was stained. (C) Phase contrast image of the cells. (D) Overlay of all fluorescence signals plus phase contrast image of the cells. | ||
No fluorescence signal was observed on negative control cells (Fig. 11). Interestingly, no fluorescence signal could be observed for the cell nuclei, which were further stained with commercial TO-PRO-3 (a red staining—Fig. 11).
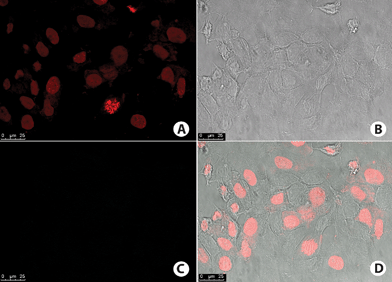 | ||
| Fig. 11 MCF-7 cells negative control. (A) Cell nucleus stained with TO-PRO-3 (red). (B) Phase contrast image of the cells. (C) No fluorescence signal obtained on the wavelength used for detection of BTD–Br or BTD–H. (D) Overlay of fluorescence signal and phase contrast image of the cells. | ||
The pattern of fluorescence signal is typical of selective mitochondrial staining. The nucleus peripheral staining and the cytoplasm staining distribution (Fig. 9B and 10B) are also typical of those observed in mitochondrial staining, as shown by using the commercially available MitoTracker-red (Invitrogen), which is a mitochondrion-specific marker widely used in mitochondrial selective staining.34,35 The fluorescence intensity was higher in MCF-7 cancer cell samples incubated with BTD–H as shown in Fig. 10B. All of these observations can be made by naked-eye analyses of the images. It is then obvious (especially for BTD–H) the potential of these compounds as superior alternatives to mitochondria markers on fixed mammal (cancer) cells due to their high specificity, negligible background fluorescence signal, ease of handling, and solution stability. It is reminded that, according to the manufacturer (Invitrogen), the commercially available mitochondria marker (MitoTracker-red) must be stored at −20 °C until use, and freezing and thawing must be avoided due to its instability. The new dyes (BTD–Br and BTD–H) do not require freezing, can be stored at room temperature (as solutions or solids), and can be used together with TO-PRO-3 to stain the mitochondria and nuclei at the same time. Moreover, many limitations of MitoTracker-red are well known, such as: (i) this dye must be avoided under conditions of alterations in mitochondrial membrane potential and increased oxidant burden,36 (ii) at least under reduced form MitoTracker-red may be strongly influenced by the presence of reactive oxygen species,37 (iii) MitoTracker-red is highly unstable and cannot be stored in solution or room temperature, (iv) this dye is not used for the occasion of loss of plasma membrane integrity.38 The novel dyes (BTD–Br and BTD–H), however, are mitochondria specific, air and temperature stable, and can be used in adhered cells.
In order to prove the generality of BTD–Br and BTD–H as selective mitochondrial markers and their stability during time, we have stained different cell lines (Caco-2 cancer cell lines and normal fibroblasts cells) and used months old solutions (Fig. 12).
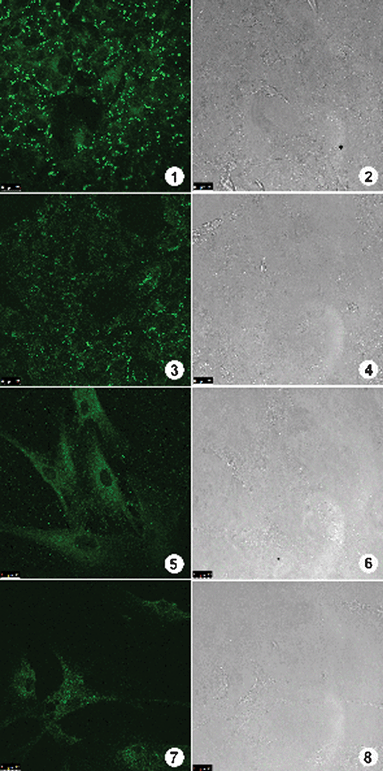 | ||
| Fig. 12 Staining assays using BTD–Br and BTD–H with cancer cells Caco-2 and normal fibroblasts cells. Fluorescent signal can be observed on the left column and cell image by phase contrast on the right column. (1) and (3) show the fluorescence profile obtained on Caco-2 cancer cells stained by BTD–Br and BTD–H respectively. (5) and (7) show the fluorescence profile on normal fibroblast cells stained by BTD–Br and BTD–H respectively. (2), (4), (6) and (8) show cells morphology by phase contrast microscopy. | ||
The cellular fluorescent profile observed on the tested cell types (Fig. 12) showed a highly reproducible staining, just as those already observed on MCF-7 cancer cells. Only when fibroblast cells were used, the staining pattern was slightly diffuse as compared with all other cell types. Nevertheless, the fluorescence signal intensity and major distribution were conserved on all experiments regardless of the tested cell line. The obtained results through assays of different cell types demonstrate that BTD–Br and BTD–H can be used as universal mitochondria markers. It is worth to highlight several advantages by using these new dyes to stain mitochondria on mammal cells: (i) these compounds are highly stable at room temperature, (ii) ease of handling and storage, (iii) even in those experiments with cells submitted to fixatives agents (i.e.paraformaldehyde), the markers sustained their fluorescent intensity and selectivity towards mitochondria and, finally, it can be used with staining protocols with fixed cells, which are much less time consuming and contribute to improved morphological analyses.
Conclusions
We have synthesized and characterized new fluorescent 2,1,3-benzothiadiazole derivatives (BTD–Br and BTD–H) with impressive cellular selectivity for staining of mitochondria. Both markers perform efficient ESIPT and ICT, and are stable in the excited state. X-ray analyses confirmed the planar geometry of both dyes and the rigidity of these systems. Both compounds displayed two intramolecular hydrogen bonds conferring an appropriate geometry for ESIPT. Theoretical calculations were in accordance with the observed results and allowed a better understanding of the origin and efficiency of the stabilizing processes in the excited state. Cell-imaging experiments showed the potential of the two compounds, mainly BTD–H, as a substitute for the commercially available and widely used MitoTracker-red. Moreover, the developed markers have many advantages over the widely used MitoTracker-red, such as ease of handling, selectivity, and storage.Experimental section
See supplementary material for detailed experimental procedures, spectral data and analyses. CCDC (Cambridge Crystallographic Data Centre) 842632 (BTD–Br) and 842633 (BTD–H) contain the supplementary crystallographic data for this paper and the cif files can be obtained from the corresponding author.Acknowledgements
This work was partially supported by CNPq, CAPES, FAPDF, INCT-Catalysis, Finatec and DPP-UnB.References
- C. Cottet-Rousselle, X. Ronot, X. Leverve and J. F. Mayol, Cytometry, Part A, 2011, 79A, 405–425 Search PubMed.
- G. Masanta, C. S. Lim, H. J. Kim, J. H. Han, H. M. Kim and B. R. Cho, J. Am. Chem. Soc., 2011, 133, 5698–5700 CrossRef CAS.
- B. C. Dickinson, D. Srikun and C. J. Chang, Curr. Opin. Chem. Biol., 2010, 14, 50–56 CrossRef CAS.
- Y. Kawazoe, H. Shimogawa, A. Sato and M. Uesugi, Angew. Chem., Int. Ed., 2011, 50, 5478–5481 Search PubMed.
- Y. Liu, Y. Yu, J. W. Y. Lam, Y. N. Hong, M. Faisal, W. Z. Yuan and B. Z. Tang, Chem.–Eur. J., 2010, 16, 8433–8438 CrossRef CAS.
- Q. Zou and H. Tian, Sens. Actuators, B, 2010, 149, 20–27 CrossRef.
- K. Y. Pu and B. Liu, J. Phys. Chem. B, 2010, 114, 3077–3084 CrossRef CAS.
- M. Haussler, S. P. King, M. P. Eng, S. A. Haque, A. Bilic, S. E. Watkins, G. J. Wilson, M. Chen and A. D. Scully, J. Photochem. Photobiol., A, 2011, 220, 102–112 Search PubMed.
- M. Watanabe, K. Goto, M. Shibahara and T. Shinmyozu, J. Org. Chem., 2010, 75, 6104–6114 Search PubMed.
- F. F. D. Oliveira, D. Santos, A. A. M. Lapis, J. R. Correa, A. F. Gomes, F. C. Gozzo, P. F. Moreira, V. C. de Oliveira, F. H. Quina and B. A. D. Neto, Bioorg. Med. Chem. Lett., 2010, 20, 6001–6007 CrossRef CAS.
- B. A. D. Neto, A. A. M. Lapis, F. S. Mancilha, E. L. Batista, P. A. Netz, F. Rominger, L. A. Basso, D. S. Santos and J. Dupont, Mol. BioSyst., 2010, 6, 967–975 RSC.
- B. A. D. Neto, A. A. M. Lapis, F. S. Mancilha, I. B. Vasconcelos, C. Thum, L. A. Basso, D. S. Santos and J. Dupont, Org. Lett., 2007, 9, 4001–4004 CrossRef CAS.
- W. H. Sun, S. Y. Li, R. Hu, Y. Qian, S. Q. Wang and G. Q. Yang, J. Phys. Chem. A, 2009, 113, 5888–5895 CrossRef CAS.
- H. S. Hoffmann, V. Stefani, E. V. Benvenutti, T. M. H. Costa and M. R. Gallas, Mater. Chem. Phys., 2011, 126, 97–101 Search PubMed.
- S. R. Vazquez, M. C. R. Rodriguez, M. Mosquera and F. Rodriguez-Prieto, J. Phys. Chem. A, 2008, 112, 376–387 CrossRef CAS.
- V. A. Corbellini, M. L. Scroferneker, M. Carissimi, F. S. Rodembusch and V. Stefani, J. Photochem. Photobiol., B, 2010, 99, 126–132 Search PubMed.
- R. C. dos Santos, N. V. D. Faleiro, L. F. Campo, M. L. Scroferneker, V. A. Corbellini, F. S. Rodembusch and V. Stefani, Tetrahedron Lett., 2011, 52, 3048–3053 Search PubMed.
- B. A. D. Neto, A. S. A. Lopes, G. Ebeling, R. S. Goncalves, V. E. U. Costa, F. H. Quina and J. Dupont, Tetrahedron, 2005, 61, 10975–10982 CrossRef.
- F. S. Mancilha, B. A. D. Neto, A. S. Lopes, P. F. Moreira, F. H. Quina, R. S. Goncalves and J. Dupont, Eur. J. Org. Chem., 2006, 4924–4933 CrossRef CAS.
- B. A. D. Neto, A. S. Lopes, M. Wust, V. E. U. Costa, G. Ebeling and J. Dupont, Tetrahedron Lett., 2005, 46, 6843–6846 CrossRef.
- B. K. Paul, A. Samanta and N. Guchhait, J. Fluoresc., 2011, 21, 1265–1279 Search PubMed.
- G. Ulrich, F. Nastasi, P. Retailleau, F. Puntoriero, R. Ziessel and S. Campagna, Chem.–Eur. J., 2008, 14, 4381–4392 Search PubMed.
- A. U. Khan and M. Kasha, Proc. Natl. Acad. Sci. U. S. A., 1983, 80, 1767–1770 CAS.
- J. Jayabharathi, V. Thanikachalam, N. Srinivasan and K. Saravanan, J. Fluoresc., 2010, 21, 595–606 Search PubMed.
- C. Reichardt, Chem. Rev., 1994, 94, 2319–2358 CrossRef CAS.
- S. H. Mashraqui, R. Betkar, M. Chandiramani, D. Quinonero and A. Frontera, Tetrahedron Lett., 2010, 51, 596–599 CrossRef CAS.
- C. K. Lim, J. Seo, S. Kim, I. C. Kwon, C. H. Ahn and S. Y. Park, Dyes Pigm., 2011, 90, 284–289 Search PubMed.
- S. Tommasini, M. L. Calabro, P. Donato, D. Raneri, G. Guglielmo, P. Ficarra and R. Ficarra, J. Pharm. Biomed. Anal., 2004, 35, 389–397 CrossRef CAS.
- M. Gauden, A. Pezzella, L. Panzella, M. T. Neves-Petersen, E. Skovsen, S. B. Petersen, K. M. Mullen, A. Napolitano, M. d'Ischia and V. Sundstrom, J. Am. Chem. Soc., 2008, 130, 17038–17043 CrossRef CAS.
- M. Brauer, M. Mosquera, J. L. Perez-Lustres and F. Rodriguez-Prieto, J. Phys. Chem. A, 1998, 102, 10736–10745 CrossRef.
- D. LeGourrierec, V. A. Kharlanov, R. G. Brown and W. Rettig, J. Photochem. Photobiol., A, 2000, 130, 101–111 CrossRef CAS.
- B. K. Paul and N. Guchhait, J. Lumin., 2011, 131, 1918–1926 Search PubMed.
- S. Mahanta, B. K. Paul, R. B. Singh and N. Guchhait, J. Comput. Chem., 2011, 32, 1–14 Search PubMed.
- E. Abarca-Rojano, S. Muniz-Hernandez, M. M. B. Moreno-Altamirano, R. Mondragon-Flores, F. Enriquez-Rincon and F. J. Sanchez-Garcia, Immunol. Lett., 2009, 122, 18–25 Search PubMed.
- R. K. Dagda, S. J. Cherra, S. M. Kulich, A. Tandon, D. Park and C. T. Chu, J. Biol. Chem., 2009, 284, 13843–13855 Search PubMed.
- J. F. Buckman, H. Hernandez, G. J. Kress, T. V. Votyakova, S. Pal and I. J. Reynolds, J. Neurosci. Methods, 2001, 104, 165–176 Search PubMed.
- M. Poot and R. H. Pierce, Cytometry, 1999, 35, 311–317 Search PubMed.
- A. Mendes-Ferreira, B. Sampaio-Marques, C. Barbosa, F. Rodrigues, V. Costa, A. Mendes-Faia, P. Ludovico and C. Leao, Appl. Environ. Microbiol., 2010, 76, 7918–7924 Search PubMed.
Footnote |
| † Electronic supplementary information (ESI) available: Experimental detalis and spectroscopic data are available. CCDC reference numbers 842632 and 842633. For ESI and crystallographic data in CIF or other electronic format see DOI: 10.1039/c1ra00701g |
| This journal is © The Royal Society of Chemistry 2012 |