Visible light activity of Ag-loaded and guanidine nitrate-doped nano-TiO2: degradation of dichlorophenol and antibacterial properties
Jurate
Virkutyte
*a and
Rajender S.
Varma
*b
aPegasus Technical Services Inc., 46 E. Hollister Street, Cincinnati, OH 45221, USA. E-mail: virkutyte.jurate@epa.gov; Tel: +513569 7964
bSustainable Technology Division, National Risk Management Research Laboratory, U.S. Environmental Protection Agency, MS 443, 26 West M. L. K. Drive, Cincinnati Ohio, 45268, USA. E-mail: varma.rajender@epa.gov; Fax: 513 5697677; Tel: 513487 2701
First published on 20th December 2011
Abstract
To utilize visible light, Ag loaded and C, N-doped nano-TiO2 was prepared using a “one pot” synthesis utilizing mild reaction conditions and benign precursors. The synthesis was optimized using appropriate experiment design that took the silver content and calcination temperature into account. The optimized nanocatalyst was characterized by XRD, BET, TEM, TGA, XPS as well as UV-DRS. Nanocatalysts were predominantly anatase as confirmed by XRD, thermally stable up to 1100 °C, as revealed by TGA studies and exhibited absorption in the visible light region as verified by UV-DRS analysis. Moreover, XPS results proved that Ag was dispersed on the surface of the TiO2 nanoparticles and nitrogen, as well as carbon from guanidine nitrate was interlaced into the matrix of TiO2. Co-doping of TiO2 suppressed charge recombination and improved the visible light photo-activity up to the complete degradation of dichlorophenol (DCP) in 4 h of the reaction. Degradation followed first order reaction kinetics with kapp ranging from 1.1 to as high as 15.1 × 10⁻³ min−1 depending on the silver content and calcination temperature. Demineralization of the solution in terms of TOC was up to 92%. A complete elimination of Vibrio fischeri was accomplished with 1 mg L−1 of the nanocatalyst regardless of the Ag content.
Introduction
Recently, nanomaterials have drawn much attention in the scientific community due to their unique properties, which include quantum confinement and increased reactivity associated with changes in their molecular electronic structure and increase in surface-to-volume ratio.1In the past 20 years, anatase nano-titanium dioxide (nTiO2) became a major semiconductor material that is attractive from environmental and biomedical point of view.2–4. It is non toxic, inexpensive, presents photo-corrosion resistance, exhibits oxidative properties and shows a significant UV light absorption and is utilized in a wide array of applications including solar cells and photocatalysis.3,5–13 However, its use in the visible light range is limited by the large band gap of 3.2 eV and charge recombination, which reduce the amount of electrons and holes available for catalytic reactions.2 To avoid recombination by increasing the lifetime of e−/h+ pairs and to lower the band gap, doping with metals7,14–19, non-metals1,5,10,12,20,21 or a combination of both7,18 is usually performed. Importantly, noble metals loaded or doped with nTiO2 have high Schottky barriers among the metals and can therefore act as electron traps, facilitating electron-hole separation and promoting the interfacial electron transfer processes.19
In particular, loading with silver and simultaneous doping with non-metal ions is gaining increased attention due to the antimicrobial properties, low cost and easy preparation.17,22 In addition, loading with silver is also attractive for various medical applications, where silver coated sanitary wares and medical devices are being manufactured because silver can trap the excited electrons from nTiO2 and leave the holes for the desired applications.23 Also, loading with silver increases the ability of nTiO2 to absorb visible light, due to localized surface plasmon resonance.19
This work is significantly extended and a more fundamental as well as systematic study of our previous work on a silver and guanidine co-doped nano-TiO2 nanocatalyst that is active in the visible light region.18 The benign synthesis protocol and use of “green” precursors take into account a detailed investigation of as-prepared catalysts, in addition the photoactivity of the nanocatalyst in terms of dichlorophenol (DCP) degradation as well as the elimination of microbial activity are also presented and discussed in the current study. Furthermore, the experiments were designed to optimize the synthesis of the co-doped nanocatalysts. Detailed investigation of the surface composition, morphology and speciation of the nanocatalyst were performed through BET surface area measurements, transmission electron microscopy (TEM), X-ray photoelectron spectroscopy (XPS), thermogravimetric analysis (TGA) and X-ray diffraction analysis and light harvesting was examined using UV diffuse reflectance spectroscopy (DRS). To investigate the antibacterial properties of the co-doped nanocatalyst, the gram-negative bacterium Vibrio fischeri from marine water was treated with various nanocatalyst concentrations. Novel aspects of the current study include, compared to18,21: i) simultaneous doping of TiO2 with Ag+ and guanidine nitrate resulted in the formation of an Ag, C and N co-doped nanocatalyst (confirmed by XPS analysis) instead of Ag and N as hypothesized in the earlier work. Significantly, the treatment of TiO2 with inorganic salts and organic compounds resulted in the formation of a metal ion, nitrogen and, importantly, carbon doped nanomaterial; ii) the synthesis was optimized and the photocatalytic activity was found to be highest with 7 mol% of Ag, which was contrary to our assumption that 5 mol% Ag exhibited the highest activity towards the degradation of target contaminants. However, additional cost-benefit analysis must be performed to assess whether doping with 7 mol% of Ag is required, for e.g. the simultaneous photocatalytic and antibacterial treatment of water; iii) the as-prepared nanocatalyst exhibited not only excellent photo-activity in the visible light range but also was extremely effective in destroying microbial contamination, which was not assessed in the previous work.
Materials and methods
Materials
TiCl4 (50% in HCl), guanidine nitrate, AgNO3, NH4OH and dichlorophenol (DCP) were obtained from Fischer scientific (USA) and used as received without further purification. Deionized water was used in all the experiments.Synthesis of the nanocatalyst
Visible light activated co-doped nano-TiO2 were prepared as described in detail in ref. 18. In brief, 20 g of TiCl4 was dissolved to 50% in HCl and dispersed in 1000 mL of deionized water. 20 g of guanidine nitrate and 2, 5 and 7 mol% of AgNO3 were added to the solution and the content was magnetically stirred for 30 min. An ammonium hydroxide (NH4OH, 33 wt%) solution was added to bring the pH to 9 and the reaction mixture was stirred at room temperature for 24 h. Then the reaction products was vacuum filtered, dried at 60 °C overnight and calcined at 350, 450 and 700 °C in air.Characterization of the nanocatalyst
X-ray patterns were determined on X'Pert Pro MPD X-ray diffractometer and a Cu-Kα source with a diffraction angle range of 2θ = 10 to 70°. TEM micrographs were recorded on a FEI CM20 TEM microscope at an operating voltage of 200 kV. The thermogravimetric analysis (TGA) was executed with TGA Q5000 (TA instruments, USA) analyzer with a heating range of 5° min−1 in an air flow adopting a ramp method with an increase in temperature from 100 to 1200 °C. The Surface Area measurements were carried out in a Micromeritics single point BET instrument (Micromeritics Instruments, Norcross, GA, USA). X-ray photoelectron spectroscopy (XPS) was performed using Surface Science Labs SSX-100 XPS. For the XPS analysis, the samples were fixed on a copper plate under a portable anaerobic chamber before being placed in the analytical chamber (10−9 mbar vacuum). All spectra were recorded at a 90° takeoff angle. The nominal X-ray beam diameter was 600 μm. Since all the samples were non-conductive, the charge neutralization system, which caused peaks to shift by ∼5 eV was adopted. Therefore, data presented in Figures differ by ca. 5 eV from the explanation of the results. The typical error bar associated to the binding energies was ± 0.3 eV.Photocatalytic activity
The photocatalytic activity was evaluated by degrading a model compound—dichlorophenol (DCP) in the presence of visible light irradiation. Thus, for the experiments, unless specified otherwise, 20 mL (100 ppm) of DCP aqueous solution was placed in a 25 mL glass reactor equipped with a magnetic stirrer. 1 and 3 g L−1 of freshly prepared catalyst was dispersed into the solution. The glass reactor was immersed into a water circulating jacket to cut infrared radiation and continuously flushed with O2. The reaction mixture was initially stirred in the dark for 1 h to ensure an adsorption/desorption equilibrium between DCP and the nanocatalyst. The photoreactor was irradiated using a 300 W medium pressure metal halogen lamp. DCP degradation was monitored by collecting aliquots at regular time intervals (1 h, unless indicated otherwise).18 The aliquots were centrifuged and absorption spectra recorded using a Hewlett Packard 845X UV-vis instrument. At this point, we did not attempt to identify the reaction by-products or the formation of intermediates, just the disappearance of DCP and total mineralization of the solution. Changes in TOC were monitored on Shimadzu TOC V CPH for Non-Purgeable Organic Carbon analyzer.Vibrio fischeri bioluminescence inhibition test
Inhibition of the bacterial growth was measured with a Microtox toxicity test (EBPI, Canada) according to ISO standard.25 In brief, freeze-dried photobacteria, Vibrio fischeri (NRRL B-11177), were rehydrated and stabilized at 4 °C for 1 h and then stabilized at 15 °C for 30 min prior the measurements. Suspensions containing various concentrations of co-doped nanocatalyst (0.5–2000 mg L−1) were subjected to 30 min ultrasonication and then subsequently stabilized at 15 °C prior to the toxicity measurements. As color and turbidity may reduce the light output recorded by the luminometer similar to toxicity, the bacteria was separated by centrifuging from the sample matrix prior to the final luminescence measurements. To evaluate the inhibition of the bacterial growth in the presence of nanocatalyst, the light output was recorded at t0 and t30. To avoid errors, all the samples were assayed in duplicates. The control test was carried out by recording the light output of the unstressed bacteria after otherwise identical experimental conditions. The light inhibition percentage (INH%) was calculated according to the standard and kinetic methods: | (1) |
 | (2) |
Results and discussion
Optimization of nanocatalyst synthesis and photocatalytic activity
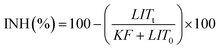
In our earlier research attempt, we used non-optimized Ag loaded (5 mol%), guanidine doped TiO2 nanocatalyst calcined at 450 °C to degrade methyl orange under the visible light irradiation.18 As many of the research questions were left open, we decided to expand the study further. The photocatalytic activity of Ag-loaded and C, N co-doped nano-TiO2 was researched by examining the reaction of dichlorophenol (DCP) and TOC degradation. Nearly 10 ± 2% of DCP was degraded in the absence of a visible light irradiation indicating that a negligible adsorption onto the nano-TiO2 surface may have taken place. Also, the control test in the absence of the photocatalyst under visible light irradiation showed no phenol degradation. Visible light induced degradation of DCP over pure TiO2 (Degussa P 25) and Ag, guanidine co-doped nano-TiO2 is shown in Fig. 1a–c for comparison. Clearly, degradation of DCP was always the most effective in the presence of 5 and 7 mol% Ag, guanidine co-doped nano-TiO2 regardless the calcination temperatures employed.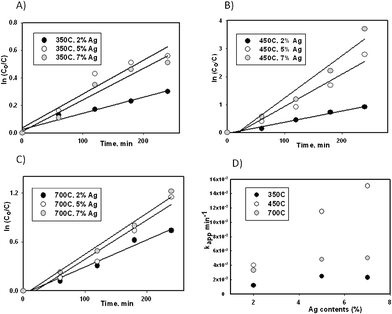 | ||
| Fig. 1 Visible light induced degradation of DCP over Ag, guanidine co-doped TiO2 nanocatalyst vs. time at calcinations temperature of a) 350 °C, b) 450 °C, c) 700 °C and d) the relationship between kapp (min−1) and Ag contents (mol%) at various calcinations temperatures. As the synthesis of the nanocatalyst was optimized, other Ag mol% and calcination temperatures were presented for comparison. | ||
Apparent photocatalytic reaction rate constant (kapp) was calculated according to the following first order reaction equation:11 ln (C0/C) = kappt, where C0 was the initial concentration of DCP, Ct was the concentration of DCP after 240 min of irradiation and t was the irradiation time. The values of kapp were 1.1, 2.5 and 2.3 × 10⁻³ min−1 for loaded and co-doped catalyst calcined at 350 °C, then 4, 11.5 and 15.1 × 10⁻³ min−1 for loaded and co-doped catalyst at 450 °C and finally 3.3, 4.8, 5 × 10⁻³ min−1 calcined at 700 °C with 2, 5 and 7 mol% Ag content, respectively. For comparison, kapp for only guanidine (C, N)-doped nano-TiO2 calcined at 350, 450 and 700 °C were 1, 3.2 and 2.7 × 10⁻³ min−1, respectively. In addition, kapp for pure TiO2 (Degussa P 25) was 1.1 × 10⁻³ min−1.15 Thus, results indicated that photocatalytic degradation of DCP occurred nearly 3 to 5 times faster with the addition of Ag and when the calcination temperature was 450 °C. Evidently, surface modification with Ag and guanidine significantly improved the photocatalytic activity, which could be attributed to an increase in the visible light absorptivity and enhancement of charge separation (e−1/h+) by trapping photoelectrons on silver particles due to formation of Shottky barrier.15,19 During calcination, some amount of silver as Ag+ ions may have migrated from the volume of TiO2 to the surface by enhancing their crystallinity, resulting in silver deposition on the surface. Also, there might be residual Ag+ ions within the material acting as effective electron traps, which also contributed to the increased photocatalytic activity.23
To further explore the effect of Ag content on the photocatalytic activity, kapp was plotted as a function of Ag content (mol%) as could be seen in Fig. 2d. kapp was observed to increase with Ag addition up to the highest kapp at an Ag content of 5 mol% which decreased at an Ag content of 7 mol%. According to Chen and co-workers,6 the Fermi level of the Ag cluster (Agn) depended on the particle size of Ag cluster and varied from −1.303 eV (Ag1) to −4.640 eV (Agbulk), whereas the conduction band of TiO2 was −4.4 eV. Thus, electrons were able to transfer from TiO2 to Ag only if the Ag cluster was of a suitable size. Therefore, it was assumed that when the Ag content exceeded ∼5 mol%, the particle size of the Ag cluster became too large, therefore decreasing the Fermi layer.
 | ||
| Fig. 2 Optimized nanocatalyst synthesis: 3D graph on the effect of Ag content (mol%) and calcination temperature24 on DCP degradation effectiveness (%), in the presence of a) 3 g L−1 and b) 1 g L−1 catalyst concentration. | ||
Furthermore, to ensure the most effective degradation of DCP, the synthesis of co-doped TiO2 was optimized. However, we are well aware that other parameters such as the guanidine concentration, synthesis approach, etc can also influence the effectiveness of the synthesis and subsequently the quality of the final product, i.e. the nanocatalyst, and will continue presenting our findings, taking into account numerous other parameters in future publications. Thus, synthesis optimization presented in a current study took into account the most effective calcination temperature and Ag content (mol%). Fig. 2 shows 3D graphs of co-doped TiO2 synthesis optimization, where two different (3 g L−1 and 1 g L−1) catalyst concentrations are tested to ensure optimum performance degrading DCP. Also, Table 1 presents experimental matrix, which is used to evaluate interaction between two main factors, i.e. calcination temperature (x1) and Ag content (x2) on DCP degradation (Y).
| x 1 (Calcination T/°C) | x 2 (Ag%) | Y (DCP degradation,%) |
|---|---|---|
| 350 | 2 | 25 |
| 350 | 5 | 43 |
| 350 | 7 | 40 |
| 450 | 2 | 60 |
| 450 | 5 | 94 |
| 450 | 7 | 98 |
| 700 | 2 | 52 |
| 700 | 5 | 68 |
| 700 | 7 | 71 |
According to Table 1, an increase in Ag (mol%) from 5 to 7% did not present a significant increase (decrease from 43 to 40%, slight increase from 94 to 98% and from 68 to 71% in the presence of 5 and 7 mol% Ag content, respectively) in the DCP degradation efficiency. According to the aforementioned discussion and additional findings of Zielinska and colleagues,19 the optimum Ag content for each catalyst existed, above which the photocatalytic activity did not even increase and might even decrease. In addition to that, if the concentration of silver was too high, these particles could act as recombination centers26 and silver particle aggregation might occur,16 which impaired the photocatalytic activity.
Calcination temperature also plays an important role in the preparation of the most effective catalyst that is active in the visible light range. It is generally accepted that anatase (ca. 400–650 °C calcination temperature) is the most efficient polymorph for photocatalytic transformations.7 Thus, the catalyst calcined at 350 °C was nearly amorphous, whereas that calcined at 700 °C started to transform to rutile polymorph,9 which was not effective in photocatalytic degradation of DCP. Similar results were obtained by Chen et al.,6 who researched the photocatalytic activity of co-doped TiO2 at different calcination temperatures.
In addition, two different catalyst doses (3 g L−1 and 1 g L−1) were used to explain the dynamics of the DCP degradation process (Fig. 2). Obviously, the degradation process followed the same pattern (i.e. the highest DCP degradation efficiency was achieved with the catalyst calcined at 450 °C with 5 and 7 mol% of silver), regardless the amount of the catalyst added to the system. However, the efficiencies of using 1 g L−1 of the catalyst were significantly lower, which could be attributed to the lack of active sites due to the lower catalyst concentration.
Moreover, demineralization of the solution in terms of TOC degradation of 15, 23, 38%, and 59, 88, 92% as well as 34, 45, 59% was achieved in the presence of 2, 5 and 7 mol% Ag-loaded, guanidine co-doped nano-TiO2 calcined at 350, 450 and 700 °C, respectively, which indicated the effective utilization of optimized synthesis precursors and reaction conditions.
Crystal structure, morphology and BET specific surface area of co-doped nano-TiO2
Previously we found that Ag and guanidine co-doped nano-TiO2 nanocatalyst had an average crystallite size of 29.3 nm for the TiO2 phase and 28.4 nm for the Ag phase. Also, the strong peaks of metallic Ag were observed at 38° (111), 44.6° (200) and 65.7° (220), whereas TiO2 (anatase) had peaks at 25, 37.8 and 48°.18Moreover, the diffraction peak at 28.3° was attributed to the deposited Ag particles.
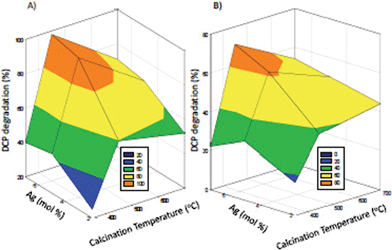
TiO2 particles were nearly spherical (lighter), whereas the Ag particles were nearly rhombohedral (darker) as evidenced in TEM images of the optimized Ag-loaded (7 mol%), guanidine co-doped TiO2 nanocatalyst (Fig. 3). As the density of silver particles was higher than TiO2, images of Ag particles were darker.6,15,18 From the TEM analysis it was found that the crystalline size of the synthesis optimized nanocatalyst was ca. 28 nm, which was consistent with the XRD results. More details on the surface morphology can be found in Virkutyte and Varma (2010).18
The specific surface areas of Degussa P25, Ag (7 mol%)-TiO2 and guanidine-doped TiO2 were 59 m2 g−1 (ca. 20 nm), 42 m2 g−1 (ca. 28 nm) and 90 m2 g−1 (ca. 15 nm), which was fairly consistent to BET surface areas observed by other researchers8,10,14,19,27 The surface area of optimized Ag-loaded (7 mol%), guanidine co-doped nano-TiO2 calcined at 450 °C was 30.5 m2 g−1 (ca. 30 nm), which was considerably smaller than BETs of aforementioned nanocatalysts. It had been reported that a decrease in the crystalline size resulted in an increase in the specific surface area.14,19 Indeed, as the crystalline size of the optimized Ag-loaded (7 mol%), guanidine co-doped TiO2 was the highest (ca. 30 nm), the surface area of that nanocatalyst was, therefore, the lowest.
Furthermore, it was revealed that other parameters, e.g. silver presence, rather than BET surface area, caused the enhancement in photoactivity of as-prepared nanocatalysts, because the surface area and particle size were not crucial as the size of a noble metal.27 Indeed, the optimal nanocatalyst synthesis conditions (Fig. 1) taking into account silver content, demonstrated the highest photoactivity towards the destruction of DCP.
Light harvesting of co-doped nano-TiO2
Fig. 4 shows the UV DR spectra of Degussa P25 for comparison and Ag-loaded (mol%) and guanidine co-doped TiO2 nanoparticles calcined at 450 °C. Degussa P25 demonstrated a broad and intense absorption in the UV region below 400 nm. According to Ko and co-workers15 and Chen and co-workers,6 this is a typical absorption by TiO2, which is necessary to initiate charge transfer from the valence band (mainly formed by 2p orbits of the oxide cations) to the conduction band (mainly formed by 3 d t2g orbits of the Ti4+ cations) on the surface of the catalyst. The band gap energy was estimated for the absorption edge using generally acceptable equation: E = 1240/λ28,29,13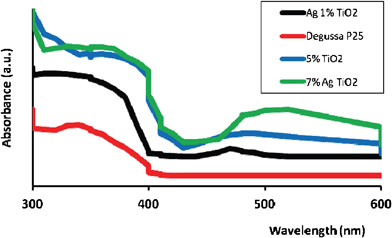 | ||
| Fig. 4 UV DRS spectra of Ag (mol%) and guanidine co-doped TiO2 nanocatalysts and Degussa P 25 calcined at 450 °C. | ||
Thus, upon the introduction of Ag and guanidine, the absorption spectrum of nano-TiO2 demonstrated absorption peaks around 430 nm (band gap of 2.9 eV), 470 nm (2.6 eV) and 485 nm (2.5 eV) for 1%, 5% and 7% Ag-loaded, guanidine co-doped nano-TiO2, respectively, indicating potential activation within the visible light range. In comparison, the band gap energy for Degussa P25 was very large, 3.2 eV, and therefore the catalyst was not active upon irradiation with the visible light.21 It is important to note that loading or doping with only Ag or guanidine (data not shown), showed absorption peaks at 450 nm (2.8 eV) and 460 nm (2.7 eV), respectively, which also indicated significant though lower visible light activity in comparison to the co-doped nanocatalysts. The reason why the co-doped nano-TiO2 demonstrated absorption in the visible light range may be due to the fact that Ag particles were dispersed on the TiO2 surface (as was later confirmed by XPS), as the Ag+ ion (∼126 pm) is much larger than Ti4+ (∼68 pm) and therefore the Ag ions could not enter into the lattice but were deposited onto the surface.6 This subsequently increased the interaction between the Ag and TiO2 particles that eventually led to a broadening of the surface plasmon absorption8,15 Also, Ag clusters could give rise to localized energy levels in the band gap of TiO2 into which valence band electrons of TiO2 were excited at wavelengths longer than 400 nm.6
In addition, it is reported that the typical SPA of Ag nanoparticles is ca. 400–550 nm, indicating the deposition of Ag nanoparticles on the surface,30 which was 460 nm, 480 nm and 510 nm for 1 mol%, 5 mol% and 7 mol% Ag, guanidine doped TiO2, respectively. According to He and co-workers,31 surface plasmon resonance strongly depends on the size and uniformity of the nanoparticles, which shifts to longer wavelengths when the particle size distribution becomes broad. Thus, aggregation increased upon larger Ag-loading (mol%) onto the surface, which resulted in a decrease in the pore volume from 0.37 cm3 g−1 to 0.16 cm3 g−1.
Furthermore, during our previous studies we found that such band narrowing in N-doped TiO2 in particular, may also be assigned to the newly formed N 2p band and, thus, gap narrowing may be attributed to the doping of interstitial N species.21 Similar results were obtained by Senthilnathan and Philip,13 who researched N-doped TiO2 for catalytic degradation of organic pollutants in the visible light range. Moreover, these authors found that the decrease in the band gap enhanced the transfer of electron from valence band to conduction band under visible light. Evidently, the increasing amounts of Ag (mol%) resulted in higher visible absorbance capability (Fig. 4). Similar results were obtained by numerous authors who researched the visible light activated silver and other metals and/or non-metals doped TiO2.6,19,23
Thermogravimetric analysis of optimized co-doped nano-TiO2
The thermogravimetric (TG) profile of the synthesis-optimized Ag-loaded (7 mol%), guanidine co-doped nano-TiO2 was carried out at the temperature range of 100 to 1000 °C and nearly 40% weight loss was observed at the end of the analysis. The TG thermogram of the optimized nanocatalyst exhibited three distinct regions of weight loss (Fig. 5). The first region (100–235 °C) was associated with the loss of the residual water and organics in the sample,6 the second region (230–300 °C) was attributed to the decomposition of free and non-complexed guanidine and the elimination of hydroxyl groups,6,21 whereas the last region (650–1000 °C) occurred due to the decomposition of residuals, which were formed during the oxidation of guanidine and further dehydration from the sample.12,13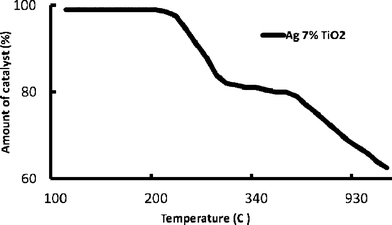
X-ray photoelectron spectroscopy
XPS analysis provides important information about the chemical composition and electronic structures of elements present on the surface and in depth.13 Thus, to analyze the chemical structure of loaded and co-doped TiO2 nanocatalyst samples, we examined five areas of the XPS spectrum (note, results are presented in Fig. 6 without ca. 5 eV for charge correction): the C 1s region near 289 eV, O 1s region near 530 eV, Ti 2p region near 400 eV, Ag 3d region near 365 eV and N 1s region near 400 eV (Fig. 6a–e). Fig. 6a shows high resolution XPS and curve fitting spectrum of C 1s. After carbon correction, the peak at ∼284 eV was assigned to adventitious carbon.32 Furthermore, the main peak at 289 eV indicated that carbon existed in the form of O–Ti–C,33 whereas a small but broad peak at ∼285 eV was assigned to a defect-containing sp2-hybridized carbon.32 The O 1s peak at ∼528 eV (Fig. 6b) was associated with the oxygen anions found in the lattice,32 while the region near 530 eV could be attributed to either Ti–OH and/or C![[double bond, length as m-dash]](https://www.rsc.org/images/entities/char_e001.gif) O, C–O and O–CO surface species.20 In Fig. 6c, two Ti 2p peaks (Ti 2p3/2 and Ti 2p1/2) at ∼458 eV and ∼464 eV were ascribed to pure-phase TiO2.1
O, C–O and O–CO surface species.20 In Fig. 6c, two Ti 2p peaks (Ti 2p3/2 and Ti 2p1/2) at ∼458 eV and ∼464 eV were ascribed to pure-phase TiO2.1
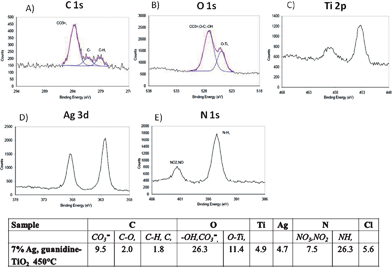 | ||
| Fig. 6 X-ray high resolution photoelectron spectra of a) C 1s, b) O 1s, c) Ti 2p, d) Ag 3d and e) N 1s. Table shows approximate atom% surface compositions of 7 mol% Ag and guanidine co-doped TiO2 calcined at 450 °C. | ||
It was reported that P 25 Degussa exhibited a Ti 2p3/2 peak close to 459.7 eV,20 which was located at a considerably higher binding energy than Ag-loaded and guanidine doped nano-TiO2 analyzed in the current study (Fig. 6c). Such a shift in the XPS signals confirmed a successful incorporation of nitrogen into the TiO2 lattice.20 In addition, Ag 3d peaks at 367 eV (Ag 3d5/2) and 373 eV (Ag 3d3/2) (Fig. 6d) showed a presence of Ag(I), suggesting that some Ag remained as ions and some as metallic silver onto the TiO2 surface and inside the lattice.28,34,35 The binding energy peaks of N 1s were centered ca. ∼398 eV and 406 eV (Fig. 6e). The peak at ∼398 eV was assigned to an atomic β-N in O-Ti-N and 406 eV was attributed to molecularly chemisorbed γ-N2.5,33 Both energy peaks extended beyond the generally accepted peak of 397.2 eV in TiN.36 As explained by Chen and Burda,20 such a shift in energy was due to that N 1s electron binding energy was higher when the formal charge of N was more positive (408 eV in NaNO3) compared to zero or negative formal charge (398.8 eV in NH3). Thus, when nitrogen substituted for the oxygen in O–Ti–O structure (as in TiO2), the electron density around N was reduced, compared to that in TiN crystal. As a result, the N 1s binding energy in O–Ti–N was higher than in N–Ti–N, where N atom replaced the O atom.
Furthermore, atom% surface compositions for the optimized loaded and doped nano-TiO2 were presented as an inset in Fig. 6. Co-doped TiO2 contained 13.3% of carbon, 37.7% of oxygen, 4.9% of titanium, 4.7% of silver, 33.8% of nitrogen and 5.6% of chlorine, the latter was attributed to the synthesis precursors. Evidently, nanocatalyst surface had Ag, N and C, verifying the effective doping process with selected species.
Toxicity measurements of the nanocatalyst
The results indicated that visible light activated loaded and doped nano-TiO2 significantly inhibited the luminescent activity of Vibrio fischeri in comparison to Degussa P 25 (Fig. 7). For instance, Degussa P25 was not detrimental to bacterial growth up to 20 mg L−1, which was consistent with findings of Heinlaan and colleagues,22 who researched the toxicity of nanosized and bulk TiO2 to Vibrio fischeri. Furthermore, the inhibition of bacterial growth was reduced (58%) at the 0.5 mg L−1 catalyst concentration when the Ag content was the lowest (2% mol%). However, the inhibition increased from 58% to nearly 100% with an increase in catalyst concentration and increase in Ag content. Such an increase was associated with Ag, which was considered as a very effective bactericide and fungicide.17 Moreover, the photocatalytic shell of titania was responsible for the anti-microbial activity against microorganisms (e.g. E. coli, V. fischeri, B. subtilis, S. aureus) and was related to the inhibition of electron–hole recombination and the decrease in the band gap energy of titania.30,35,37–41 In addition, TiO2 nanoparticles induced oxidative stress leading to genotoxicity and cytotoxicity in microbial organisms as similarly observed by Kumar and co-workers.42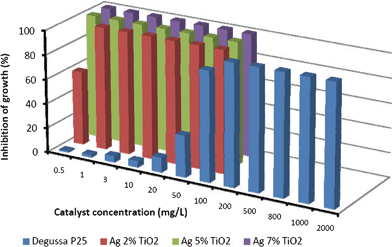 | ||
| Fig. 7 Inhibition (%) of the luminescence of V. fischeri as a function of exposure to various concentrations of Degussa P 25 and Ag (mol%), guanidine co-doped TiO2 nanocatalyst. | ||
Conclusions
Ag-loaded and guanidine nitrate doped TiO2 nanocatalyst was prepared utilizing a “one pot” synthesis using mild reaction conditions and benign precursors. Clearly, introduction of Ag, C and N into the lattice and/or onto the TiO2 surface promoted the visible light activity by reducing a band gap from 3.2 eV to as low as 2.5 eV. Furthermore, Ag loading reduced charge recombination and increased the photocatalytic degradation of DCP up to nearly complete disappearance in 4 h. Also, 92% demineralization of the solution was achieved with an optimized nanocatalyst synthesis. Introduction of metal ions and organic molecule (C and N source) present a unique advantage as the transition metal alone (though being effective antimicrobial agent), is not effective in suppressing charge recombination, thus metal (e.g. Ag) doped TiO2 would rapidly lose visible light activity.43 Therefore, to avoid charge recombination and extend the photocatalytic lifetime of the nanomaterial, it is important to co-dope it with benign but effective organic molecules such as abundant guanidine. The optimized synthesis of nanocatalyst in terms of DCP degradation was 7 mol% of Ag and calcinations temperature of 450 °C. However, we faced a controversy of whether to use 5 or 7 mol% of Ag loading, as both nanocatalysts exhibited an outstanding photoactivity. Thus, additional cost benefit analysis taking into account more parameters is highly warranted and therefore under way in our research group. In addition, a complete elimination of bacterial contamination (Vibrio fischeri) was already accomplished with 1 mg L−1 of nanocatalyst regardless the Ag content in the sample.Acknowledgements
This research was performed at the National Risk Management Research Laboratory of U.S. Environmental Protection Agency (EPA), Cincinnati, Ohio, while J.V. held a National Research Council Research Associateship Award. This paper has not been subjected to internal policy review of the U.S. EPA. Therefore, the research results do not necessarily reflect the views of the agency or its policy. Mention of trade names and commercial products does not constitute endorsement or recommendation for use.References
- X. Chen, Y. B. Lou, A. C. S. Samia, C. Burda and J. L. Gole, Adv. Funct. Mater., 2005, 15, 41–49 CrossRef CAS.
- B. Braconnier, C. A. Páez, S. Lambert, C. Alié, C. Henrist, D. Poelman, J.-P. Pirard, R. Cloots and B. Heinrichs, Microporous Mesoporous Mater., 2009, 122, 247–254 CrossRef CAS.
- M. Popa, D. Macovei, E. Indrea, I. Mercioniu, I. C. Popescu and V. Danciu, Microporous Mesoporous Mater., 2010, 132, 80–86 Search PubMed.
- N. Sobana, M. Muruganadham and M. Swaminathan, J. Mol. Catal. A: Chem., 2006, 258, 124–132 CrossRef CAS.
- R. Asahi, T. Morikawa, T. Ohwaki, K. Aoki and Y. Taga, Science, 2001, 293, 269–271 CrossRef CAS.
- Q. Chen, W. Shi, Y. Xu, D. Wu and Y. Sun, Mater. Chem. Phys., 2011, 125, 825–832 Search PubMed.
- X. Chen and S. S. Mao, Chem. Rev., 2007, 107, 2891–2959 CrossRef CAS.
- V. Gombac, L. De Rogatis, A. Gasparotto, G. Vicario, T. Montini, D. Barreca, G. Balducci, P. Fornasiero, E. Tondello and M. Graziani, Chem. Phys., 2007, 339, 111–123 CrossRef CAS.
- D. J. Kim, S. H. Hahn, S. H. Oh and E. J. Kim, Mater. Lett., 2002, 57, 355–360 CrossRef.
- D. Li, H. Haneda, S. Hishita and N. Ohashi, Mater. Sci. Eng., B, 2005, 117, 67–75 CrossRef.
- C. Sahoo, A. K. Gupta and A. Pal, Desalination, 2005, 181, 91–100 Search PubMed.
- M. Sathish, B. Viswanathan and R. P. Viswanath, Appl. Catal., B, 2007, 74, 307–312 CrossRef CAS.
- J. Senthilnathan and L. Philip, Chem. Eng. J., 2010, 161, 83–92 CrossRef CAS.
- H. E. Chao, Y. U. Yun, H. U. Xingfang and A. Larbot, J. Eur. Ceram. Soc., 2003, 23, 1457–1464 CrossRef CAS.
- S. Ko, C. K. Banerjee and J. Sankar, Composites, Part B, 2011, 42, 579–583 Search PubMed.
- T. Sano, N. Negishi, D. Mas and K. Takeuchi, J. Catal., 2000, 194, 71–79 CrossRef CAS.
- W. Su, S. S. Wei, S. Q. Hu and J. X. Tang, J. Hazard. Mater., 2009, 172, 716–720 CrossRef CAS.
- J. Virkutyte and R. Varma, New J. Chem., 2010, 34, 1094–1096 RSC.
- A. Zielinska, E. Kowalska, J. W. Sobczak, I. Lacka, M. Gazda, B. Ohtani, J. Hupka and A. Zaleska, Sep. Purif. Technol., 2010, 72, 309–318 Search PubMed.
- X. Chen and C. Burda, J. Phys. Chem. B, 2004, 108, 15446–15449 CrossRef CAS.
- J. Virkutyte, B. Baruwati and R. Varma, Nanoscale, 2010, 2, 1109–1111 RSC.
- M. Heinlaan, A. Ivask, I. Blinova, H.-C. Dubourguier and A. Kahru, Chemosphere, 2008, 71, 1308–1316 CrossRef CAS.
- M. K. Seery, R. George, P. Floris and S. C. Pillai, J. Photochem. Photobiol., A, 2007, 189, 258–263 CrossRef CAS.
- M. N. Nadagouda, A. B. Castle, R. C. Murdock, S. M. Hussain and R. S. Varma, Green Chem., 2010, 12, 114–122 RSC.
- J. Lappalainen, R. Juvonen, J. Nurmi and M. Karp, Chemosphere, 2001, 45, 635–641 CrossRef CAS.
- A. Sclafani, M.-N. Mozzanega and P. Pichat, J. Photochem. Photobiol., A, 1991, 59, 181–189 CrossRef CAS.
- E. Kowalska, R. Abe and B. Ohtani, Chem. Commun., 2009, 241–243 RSC.
- N. T. Nolan, M. K. Seery, S. J. Hinder, L. F. Healy and S. C. Pillai, J. Phys. Chem. C, 2010, 114, 13026–13034 Search PubMed.
- C. Cai, J. Zhang, F. Pan, W. Zhang, H. Zhu and T. Wang, Catal. Lett., 2008, 123, 51–55 Search PubMed.
- Z. Xiong, J. Ma, W. J. Ng, T. D. Waite and X. S. Zhao, Water Res., 2011, 45, 2095–2103 Search PubMed.
- J. He, I. Ichinose, T. Kunitake and A. Nakao, Langmuir, 2002, 18, 10005–10010 CrossRef CAS.
- B. Liu and H. C. Zeng, Chem. Mater., 2008, 20, 2711–2718 CrossRef CAS.
- S. Liu, L. Yang, S. Xu, S. Luo and Q. Cai, Electrochem. Commun., 2009, 11, 1748–1751 CrossRef CAS.
- J. Zhou, Y. Zhang, X. S. Zhao and A. K. Ray, Ind. Eng. Chem. Res., 2006, 45, 3503–3511 CrossRef CAS.
- Q. Zhang, C. Sun, Y. Zhao, S. Zhou, X. Hu and P. Chen, Environ. Sci. Technol., 2010, 44, 8270–8275 Search PubMed.
- N. C. Saha and H. G. Tompkins, J. Appl. Phys., 1992, 72, 3072–3079 CrossRef CAS.
- S. Rana, J. Rawat, M. M. Sorensson and R. D. K. Misra, Acta Biomater., 2006, 2, 421–432 CrossRef CAS.
- J. Rawat, S. Rana, R. Srivastava and R. D. K. Misra, Mater. Sci. Eng., C, 2007, 27, 540–545 Search PubMed.
- B. K. Sunkara and R. D. K. Misra, Acta Biomater., 2008, 4, 273–283 CrossRef CAS.
- T. Bala, G. Armstrong, F. Laffir and R. Thornton, J. Colloid Interface Sci., 2011, 356, 395–403 Search PubMed.
- Y. Yuan, J. Ding, J. Xu, J. Deng and J. Guo, J. Nanosci. Nanotechnol., 2010, 10, 4868–4874 Search PubMed.
- A. Kumar, A. K. Pandey, S. S. Singh, R. Shanker and A. Dhawan, Free Radical Biol. Med., 2011, 51, 1872–1881 Search PubMed.
- J. Zhao, C. Chen and W. Ma, Top. Catal., 2005, 35, 269–278 CrossRef CAS.
| This journal is © The Royal Society of Chemistry 2012 |