Color tunable YF3: Ce3+/Ln3+ (Ln3+: Eu3+, Tb3+, Dy3+, Sm3+) luminescent system: role of sensitizer and energy transfer study†
Farheen N.
Sayed
a,
V.
Grover
*a,
S. V.
Godbole
b and
A. K.
Tyagi
*a
aChemistry Division, Bhabha Atomic Research Centre, Mumbai, India 400085. E-mail: aktyagi@barc.gov.in; vinita@barc.gov.in; Fax: 0091-22-25505151 (Tyagi); Fax: 0091-22-2550 5151/2551 9613 (Grover); Tel: 0091-22-22592328 (Tyagi) Tel: 0091-22-25592308 (Grover)
bRadiochemistry Division, Bhabha Atomic Research Centre, Mumbai, India 400085
First published on 12th December 2011
Abstract
Nano-fluorides with attractive optical properties have been proposed as potential phosphors for solid state lighting and bio-applications. In the present work, redispersible YF3: Ln3+ and YF3: Ce3+/Ln3+ nanocrystals were obtained by a simple one step ethylene glycol mediated soft chemical synthesis. Uniformly distributed nanoparticles with a leaf-like morphology and particle size of 10–15 nm were observed. X-ray diffraction (XRD), transmission electron microscopy (TEM), Fourier transformed infrared spectroscopy (FT-IR), photoluminescence (PL) and decay studies were employed to characterize the samples. The highly intense emissions of various activators (Dy3+, Tb3+, Eu3+ and Sm3+) in the presence of Ce3+, their long lifetimes (∼ms) and significant reduction in the lifetime of Ce3+ proved an efficient energy transfer operating in the nanocrystals. The time resolved emission studies indicated towards the presence of two different sites for the activator ions. Under ultraviolet irradiation, the emission color of YF3: Ce3+/Ln3+ nanophosphors can be easily tuned by changing the Ln3+ ions. Bright blue (Dy3+), green (Tb3+), red (Eu3+) and purple (Sm3+) emissions were observed from corresponding YF3: Ce3+, Ln3+ nanocrystals under ultraviolet light.
1. Introduction
Research on fluorescent nanomaterials continues to be a key area of research in the recent years. In particular, controllable energy transfer in the nanomaterials has been the focus of great interest because it leads to luminescence signals of outstanding selectivity and high sensitivity, which are important factors for optoelectronics, optical sensors and bio-applications. The need to develop future generation mercury-free lamps for solid state lighting is dependent on discovering new and efficient phosphors that are capable of transforming UV light into visible one. The conditions that ought to be satisfied by these novel phosphors are efficient transformation of vacuum UV radiation into visible light as well as a high radiation resistance against vacuum UV irradiation and particle bombardment during operation in the dielectric barrier discharge lamp.In this context, fluoride nanoparticles doped with rare-earth ions have attracted tremendous interest over last few years because of their unique luminescence properties with useful applications in optical telecommunication, lasers, diagnostics and biological labels.1,2,3 The fluoride lattice enables the high coordination numbers for guest rare-earth ions and the high ionicity of the rare-earth to fluorine bond results in a very wide band gap and low phonon energies. It is very well established that high phonon energies of the host lattices are primarily responsible for non-radiative relaxation in cases of rare-earth ions. The fluoride lattices are superior in comparison to oxygen-based systems as fluorides possess very low vibrational energies and therefore the quenching of the excited states of the rare earth ions is minimal.4 This leads to a low probability of non-radiative decay for rare-earth ions and consequently, the luminescence quantum yields are higher than in the oxides and most other inorganic matrices.5
Following this, studies have been done on yttrium trifluoride (YF3) as a host lattice for lanthanide-doped phosphors. YF3 doped with rare-earth ions is capable of producing efficient visible emission under vacuum UV irradiation6,7 and is therefore a good candidate for a potential phosphor in this region. This material provides the possibility for doping with rare earth ions due to its wide band gap ( > 10 eV) and suitable Y3+ sites where other trivalent rare-earth elements can be easily substituted without additional charge compensation. The potential applications for YF3 include new laser materials or an up-conversion biolabel.8,9,10 Lemyre et al.11 reported hexagonal and quadrilaterally-shaped YF3 nanoparticles. Li and co workers also prepared fullerene-like,12 and rice-like Ln3+-doped YF3 nanoparticles13,14 and investigated their fluorescence and up-conversion luminescence properties. The multicolor upconversion and photoluminescence has also been studied in detail in Yb3+/Tm3+, Yb3+/Ho3+ and Yb3+/Er3+ doped YF3 sub-microflowers when excited by a 980 nm laser diode by Wang et al.15 Recently, Tao et al.16 reported uniform and monodisperse YF3:Eu3+ nanosized and sub-microsized truncated octahedra and observed Eu2+ emission when excited at 393 nm. For certain applications such as multiplex labelling, which is of special interest presently in the biological field, nanocrystals of different emission colors should be readily available and the whole group of nanocrystals should be excited at a single wavelength. Although lanthanide-doped nanocrystals of different emission colours can be made by varying the dopants, it is usually difficult to excite all these nanocrystals by single wavelength irradiation since each lanthanide activator has a special set of energy levels. A possible way to circumvent this problem is to use a suitable sensitization, that is to say, codoping the same sensitizing ion for all the lanthanide activators. In this case, a single-wavelength irradiation can be used to excite the sensitizers, followed by energy transfer to and emission from the lanthanide activators. Moreover, for biological labelling and for ease of processing the nanocrystals for various applications, the nanocrystals should be water-dispersible/soluble. Conventionally, lanthanide-doped nanocrystals are made at high temperatures17,18 or in organic environments19,20 yielding products that are not soluble in aqueous media. In recent years, much effort has been made to prepare lanthanide-doped nanocrystals that are water-soluble and have functional chemical groupsvia post3 or in situ21,22 surface modifications of the nanocrystals. However, little research work dealing with multicolor lanthanide-doped nanocrystals has been done so far.23
In view of this, redispersible YF3 nanoparticles, both singly doped as well as co-doped with Ce3+ (YF3: Ce3+/Ln3+) and various activator ions, have been synthesized by a relatively low temperature polyol mediated synthesis using ethylene glycol as a solvent and stabilizing ligand. Ce3+ has been used as the sensitizer in combination with different activators (viz.Tb3+, Eu3+, Sm3+ and Dy3+). These nanocrystals have been studied for their room temperature luminescence behavior and the energy transfer mechanism is also discussed.
2 Experimental
2.1 Reagents
High purity (99.9%) yttrium oxide [Y2O3], europium nitrate [Eu(NO3)3·6H2O], terbium nitrate [Tb(NO3)3·4H2O], dysprosium nitrate, [Dy(NO3)3·5H2O] and sodium fluoride [NaF] were obtained from commercial sources (Aldrich). All chemicals were used as obtained, without further purification.2.2 Synthesis of doped yttrium fluoride nanoparticles; YF3: Ln3+ (Ln3+: Ce3+, Tb3+, Eu3+, Dy3+, Sm3+)
In a typical synthesis, a stoichiometric amount of Y2O3 was dissolved in a minimum amount of HNO3 to get Y(NO3)3. It was evaporated to almost dryness and was re-dissolved in 25 ml of ethylene glycol. The stoichiometric amounts of respective rare-earth nitrates were also added and the solution was heated to 100 °C. At this temperature, NaF dissolved in 25 ml of ethylene glycol and heated to 100 °C was added drop wise to the reaction mixture. The temperature was raised to 160 °C and refluxed for two hours. The resultant precipitate was washed several times with acetone and ethanol and dried under ambient conditions. The powder samples were found to be readily dispersible in solvents like methanol and water.2.3 Material characterization
The starting materials and all the nominal compositions were characterized by powder X-ray diffraction. X-Ray diffraction (XRD) measurements were carried out on a Philips instrument, operating with Cu-Kα radiation (λ = 1.5406 Å) with a scan rate of 0.02° s−1 in the scattering angular range (2θ) of 100 to 700. Silicon was used as an external standard for correction due to instrumental broadening. The XRD patterns were analyzed by comparing with the reported ones. The average crystallite size was calculated from the diffraction line width based on Scherrer's relation: d = 0.9λ/Bcosθ, wherein λ is the wavelength of X-rays and B is the corrected full width at half maxima (FWHM). High resolution TEM micrographs were recorded on a JEOL 2000FX. The samples were dispersed in methanol solution and then deposited on the carbon coated copper grids for TEM/SAED studies. Photoluminescence (PL) and lifetime investigations were carried out on an Edinburgh F-LSP920. A microsecond 100 W Xe flash lamp was used as the excitation source. The FTIR spectra of the solid samples were recorded in KBR using a Bomem MB102 FTIR (model 610) in the mid IR region (4000–400 cm−1) equipped with a DTGS detector having a resolution of 4 cm−1. For this purpose about 200 mg of dry KBr was mixed with 10 mg of the sample. It was ground and pressed into a transparent, thin pellet at 5 Tons cm−2. These pellets were used for IR spectral measurements.3. Results and discussion
As-prepared YF3 nanocrystals were characterized by detailed powder X-ray diffraction, high resolution transmission electron microscopy and infra-red spectroscopy. The corresponding results are discussed below.The XRD patterns for the characteristic as-prepared undoped as well as doped YF3 nanopowders are given in Fig. 1. YF3 is known to crystallize in an orthorhombic structure [space group: Pnma (62)]. As demonstrated in Fig. 1 all the diffraction peaks can be easily indexed to a pure orthorhombic structure of YF3 without the presence of any extra phase. The site symmetry of the Y3+ ion in YF3 lattice is CS.
 | ||
| Fig. 1 XRD pattern of the characteristic undoped, singly-doped and co-doped YF3 where (a) YF3, (b) YF3: 2.5 mol% Tb3+, (c) YF3: 2.5 mol% Ce3+, 2.5 mol% Tb3+. | ||
The lattice parameters have been refined and the lattice constants of pure YF3 were calculated to be, a = 6.352 Å, b = 6.850 Å, and c = 4.398 Å, which are in good agreement with those reported in the literature (JCPDS Card No. 74-0911). The powder patterns of rare-earth doped YF3 are similar to that for the undoped YF3 nanopowders, which indicate that the rare earth dopants are occupying the Y3+ site in the lattice and single-phasic products are obtained. Based on the peak width, the particle size was evaluated to be 12–15 nm from Scherrer's formula for different samples. Doubly-doped YF3 samples containing activator ions co-doped with Ce3+ were also synthesized and their XRD patterns were found to be similar to undoped and singly doped YF3 thus showing that the orthorhombic structure is retained in all the samples (Fig. 2c).
 | ||
| Fig. 2 FT-IR spectrum as recorded on as-prepared YF3: 2.5 mol% Tb3+ sample. | ||
To explore the surface of the nanoparticles, infrared spectroscopic (IR) studies were performed on the representative YF3 and doped YF3 nanopowders. FT-IR spectrum recorded on the as-prepared YF3: the 2.5 mol% Tb3+ sample is shown in Fig. 2. The prominent peaks were observed at 770, 1082, 1462, 1620 and 3360 cm−1. Peaks at 1662 cm−1 and 3360 cm−1 can be ascribed to the bending and stretching vibrations of the –OH group of ethylene glycol which is used as the solvent as well as capping agent in the polyol synthesis.
It is known that free –OH has a stretching frequency at ∼3650 cm−1 which is found to be absent. This indicates the presence of hydrogen bonds in ethylene glycol molecules. Careful examination of the IR spectra shows that on the broad hump (due to –OH stretching vibrations), a small shoulder at ∼2902 cm−1 is present which can be ascribed to stretching vibrations of a –CH2group of ethylene glycol molecules and its bending vibration is observed at 1462 cm−1. All these observations support the presence of ethylene glycol molecules on the surface of nanoparticles. The advantage of the ethylene glycol based method is that the nanoparticles get stabilized with ethylene glycol moieties which are easily dispersible in solvents like water and methanol. This facilitates the use of such nanoparticles for biomedical applications and imaging.
The structure and the morphology of the nanoparticles was further explored by the high resolution transmission electron microscopy (HR-TEM) studies. HR-TEM images and selected area electron diffraction image of the as-prepared doubly-doped YF3: 2.5 mol% Ce3+, 2.5 mol% Tb3+ sample are shown in Fig. 3. Uniformly distributed nanoparticles with particle size 10–15 nm could be observed (as measured by XRD line broadening also). The particles possess a very peculiar leaf-like morphology. The selected area electron diffraction (SAED) image of the sample shows highly crystalline nature of this nanopowder.
 | ||
| Fig. 3 High Resolution Transmission Electron Microscopy (HR-TEM) of YF3: 2.5 mol% Ce3+, 2.5 mol% Tb3+. | ||
Photoluminescence studies
The luminescence studies were performed on as-synthesized YF3 nanoparticles. The photoluminescence spectra of YF3: 2.5 mol% Ce3+ is given in Fig. S1, ESI.† The YF3:Ce3+ system shows a broad excitation hump peaking at 260 nm and the corresponding emission peak is observed at 313 nm which is the characteristic Ce3+ 5d→4f emission and is in agreement with that reported in literature. The emission spectrum of YF3: 2.5 mol% Tb3+ is dominated by peaks at 487 nm, 543 nm, 580 nm and 620 nm which are due to transitions from 5D4 to 7FJ energy states of Tb3+ (Fig. 4a). The excitation spectrum corresponding to the main emission at 543 nm (5D4→7F5) showed broad peaks at 285 nm and 313 nm (f-d transitions of Tb3+) (Inset, Fig. 4a). Whereas in the case of Eu3+ as the dopant, characteristic Eu3+ features at 590 nm (5D0→7F1) and at 613 nm (5D0→7F2) were observed (Fig. 4b). | ||
| Fig. 4 Emission spectra of (a) YF3: 2.5 mol% Tb3+ (λex = 318 nm), (b) YF3: 2.5 mol% Eu3+ (λex = 320 nm). Insets give the corresponding excitation spectra. Insets give the corresponding excitation spectra. | ||
The corresponding excitation spectrum is characterized by broad bands peaking at 280 nm and 320 nm and a sharp but a relatively smaller peak at 393 nm (which is the direct excitation for Eu3+) (Inset, Fig. 4b). Because of the presence of significant amount of Eu3+ on the surface, which is exposed to more non-centrosymmetric environment, the parity forbidden transition (5D0→7F2) at 613 nm has greater intensity in the steady state emission spectrum which is quite unlike the emission spectra observed for bulk/micron-sized YF3 powders. Interestingly, for emission spectra recorded at 280 nm and 320 nm, 613 nm peak (5D0→7F2) has higher intensity than 590 nm peak (5D0→7F1). Since, the 5D0→7F2 transition is electric dipole allowed, implies that Eu3+ ions occupy lower symmetry site. However, on exciting the samples at 393 nm, the 590 nm peak (5D0→7F1) was found to have higher intensity. This shows that there are two types of Ln3+ sites in the YF3 nanoparticles synthesized by this route. Since the orthorhombic space groupPnma to which YF3 belongs possesses only one Y3+ site which is symmetric, the other Eu3+ site could be the one present on nanoparticles surface which is exposed to the asymmetric environment. Also, the Y3+ site in YF3 is centrosymmetric so this also implies that the fraction of Eu3+ ions in bulk is more than that on the surface. Further, the transitions from 5D1 are also observed in addition to those normally observed from 5D0 and this can be attributed to the absence of self quenching and low phonon energies of the host YF3 lattice. YF3: 2.5 mol% Dy3+ shows traces of emission peaks at 470 nm (4F9/2→6H15/2) and 571 nm (4F9/2→6H13/2) which are characteristics of Dy3+ emission spectrum (Fig. 5a). Singly doped YF3: Dy3+ are weakly emitting nanopowders as is also visible from PL spectrum shown in (Fig. 5a). YF3: 2.5 mol% Sm3+ did not show any noticeable emissions (Fig. 5b).
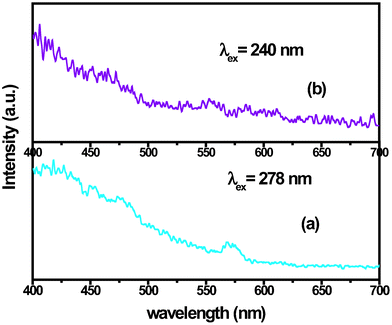 | ||
| Fig. 5 Emission spectra of (a) YF3: 2.5 mol% Dy3+ (λex = 288 nm), (b) YF3: 2.5 mol% Sm3+ (λex = 240 nm). Insets give the corresponding excitation spectra. | ||
In general, for singly-doped YF3 it can be inferred that except for Tb3+ and Eu3+, the rare earth ions show extremely weak emission spectra (e.g.Dy3+ and Sm3+ did not show any significant peak). This could be due to very weak (f–f) absorption coefficients of lanthanide ions.
One way to overcome this drawback for useful applications as visible emitters is by increasing the absorption by activator lanthanide ion through efficient energy transfer. For this purpose, doubly doped YF3 nanopowders were synthesized by co-doping Ce3+ along with activator ions (YF3: 2.5 mol% Ce3+, 2.5 mol% Ln3+). To study the influence of the sensitizer Ce3+ on the luminescence behavior of activators, detailed photoluminescence studies were carried out on doubly doped YF3 samples. A significant increase in the emission intensity of all the activators was observed as the consequence of using Ce3+ as sensitizer/codopant. Fig. 6(a–d) gives emission spectra for YF3 : 2.5 mol% Ce3+, 2.5 mol% Ln3+. The insets in Fig. 6(a–d) show the excitation spectra corresponding to the characteristic emissions of respective activators (the corresponding emission wavelengths are mentioned in the Figure). On exciting these nanopowders by UV radiation (250–256nm), different colors are emitted by these nanopowders depending on the activator present (Fig. 6(a–d)). Hence the color properties of these YF3: Ce3+/Ln3+ nanopowders can be tuned by choosing different Ln3+ and these nanoparticles could have potential applications in multiplex labelling.
 | ||
| Fig. 6 Emission spectra for YF3 : 2.5 mol% Ce3+, 2.5 mol% Ln3+ (a) YF3 : 2.5 mol% Ce3+, 2.5 mol% Tb3+ , (b) YF3 : 2.5 mol% Ce3+, 2.5 mol% Dy3+ , (c) YF3 : 2.5 mol% Ce3+, 2.5 mol% Sm3+ , (d) YF3 : 2.5 mol% Ce3+, 2.5 mol% Eu3+. | ||
In all the excitation spectra recorded at the emission wavelength of the respective activator, a broad peak at 240–260 nm was observed apart from other peaks. It is well documented that this peak at 240–260 nm corresponds to the transitions from the ground state 2F5/2 of Ce3+ to the different components of the excited Ce3+ 5d states split by the crystal field.24 Thus it exhibits an energy transfer operating from Ce3+ (which is acting as the sensitizer) to the activators.
In case of YF3: Ce3+, Tb3+, a closer look at the emission spectrum (Fig. 6a) shows that there are emission peaks from both 5D3 (385 nm, 415 nm) and 5D4 (489 nm, 543 nm, 586 nm, 619 nm) levels to 7FJ levels. However, the appearance of Ce3+ emission peak at ∼320 nm along with characteristic Tb3+ peaks indicates that the energy transfer from sensitizer to the luminescent centres is incomplete which is getting manifested as the emission from sensitizer Ce3+. In the case of the excitation spectrum of YF3: Ce3+, Dy3+, in addition to the a hump at 256 nm, also present in the Tb3+ doped sample, a smaller hump at 287 nm is also observed which can be attributed to the direct excitation of Dy3+ (Fig. 6b). It is noticeable that the emission spectrum of YF3: Ce3+, Dy3+, shows well defined peaks at 478 nm, 571 nm and 658 nm (due to transitions from 4F9/2 level) which otherwise had very weak intensities in the emission spectrum of singly doped sample, YF3 : Dy3+ (Fig. 5a). Similarly, as was mentioned earlier also, in the case of YF3 : Sm3+, very weak emission peaks were observed (Fig. 5b) whereas co-doping Ce3+ with Sm3+ causes a manifold increase in the emission intensity of Sm3+ (Fig. 6c). The maximum effect of codoping Ce3+ was observed on Dy3+ and Sm3+ emission spectra since in these two cases the characteristic emission peaks were so weak that they were almost hidden in the background in the singly doped samples. On the contrary, codoping Ce3+ with Eu3+ does not lead to any marked improvement in the emission characteristics of europium. It has been postulated that in the presence of Ce3+, quenching of the emission in Ce3+ and Eu3+ co-doped systems occur. The Ce3+ electron excited to the lowest 5d state can jump to Eu3+ when the unoccupied Eu2+ ground state is located at a lower energy than the occupied lowest Ce3+ 5d excited state. After the jump, Eu2+ and Ce4+ are formed. The Eu2+ electron can jump back to Ce4+ if the unoccupied Ce3+ ground state is located below the occupied Eu2+ ground state. The original situation is restored without emission of a photon.25
Based on the above discussion it can be inferred that there exists strong energy transfer between Ce3+ donor to acceptor ions (except in the case of Eu3+) and that is responsible for the bright luminescence from the nanoparticles on UV excitation.
To study the dynamics of energy transfer, lifetime measurements were done on all the singly and doubly doped YF3 systems. In all the samples doped with Eu3+, Dy3+ and Sm3+ and Tb3+ (singly or co-doped with Ce3+) for which life-time could be determined, it was observed that decay-curves could be fitted as bi-exponential decays with occupancy of ∼20% with a shorter life-time and rest with a longer life-time. The observation of two life-times indicates that these ions are occupying two sites with differences in local environment. However, XRD studies have revealed that rare earths are incorporated substitutionally at Y3+ site. Hence, in the host lattice, there is only one site with a centre of symmetry Cs for substitutional incorporation. It is probable that majority of ions are incorporated at substitutional Y3+ site while the ions at surface of the nanoparticles may be experiencing different local environment and hence shorter life-time due to presence of surface defects.
Table 1 and 2 enlist the lifetimes observed for various singly doped and doubly doped samples. Dy3+ and Sm3+ show extremely weak peaks in the absence of Ce3+ as the sensitizer and hence their lifetimes (in singly doped samples) are not reported. It can be seen that there is a marked increase in the lifetime of Tb3+ in presence of Ce3+. Similarly, Dy3+ and Sm3+ also show appreciable lifetimes. On the contrary, there were no significant changes in the lifetime of Eu3+ in the presence of sensitizer (Ce3+), as also evident from the Tables 1 and 2, which again indicates lack of energy transfer from Ce3+ to Eu3+. Furthermore, it is worth noting that the lifetime of Ce3+ in YF3, when singly doped, is ∼30 ns as reported in the literature.26 In almost all the co-doped samples, it has been reduced to 15 ns or less, thereby indicating that the lifetime for non-radiative processes undergone by Ce3+ reduces and the energy is being transferred to the activator ions. This is accompanied by a significant enhancement in the lifetime values of the activator ions in presence of the Ce3+. This supports the energy transfer operating from Ce3+ to activator (Ln3+) which leads to the reduction of Ce3+ lifetime. This is expected to have a positive bearing on the emission properties and quantum efficiency of the activators.
| Composition | τ 1(μsec) | τ 2(μsec) |
|---|---|---|
| YF3 : 2.5 mol% Ce3+ | 30 ns | — |
| YF3 : 2.5 mol% Tb3+ | 1500 | 5500 |
| YF3 : 2.5 mol% Eu3+ | 860 | 6290 |
| YF3 : 2.5 mol% Sm3+ | weak emission | weak emission |
| YF3 : 2.5 mol% Dy3+ | weak emission | weak emission |
| Composition | τ 1 (μsec) | τ 2 (μsec) | τ(Ce3+ lifetime) |
|---|---|---|---|
| YF3:2.5 mol% Ce3+,2.5 mol% Tb3 | 2880 | 5980 | 13.5 ns |
| YF3:2.5 mol% Ce3+,2.5 mol% Eu3+ | 1000 | 6600 | 15 ns |
| YF3:2.5 mol% Ce3+,2.5 mol% Sm3+ | 200 | 4000 | 15 ns |
| YF3:2.5 mol% Ce3+,2.5 mol% Dy3+ | 400 | 1400 | 14 ns |
In order to understand the local environment for the two sites, detailed investigations were carried out by recording time resolved emission spectra for YF3: Eu3+ and YF3:Ce3+, Eu3+ samples (Fig. 7). At smaller delay times, the intensity of 613 emission peak was found to be greater than 590 nm peak and vice versa was observed for larger delay times, i.e. at larger delay times, 590 nm emission is more intense than the 613 nm emission peak. Now at larger delay times the smaller lifetime component has already decayed and the emission profile is primarily due to larger lifetime component. Also, the 590 emission peak is magnetic dipole allowed which is not sensitive to the site symmetry. From these above-mentioned observations, it can be concluded that larger lifetime component is in a more symmetric environment compared to smaller lifetime component. These findings further support that the majority of ions are incorporated at substitutional sites with a symmetric environment, while the rest of ions at the surface are in an asymmetric environment.
 | ||
| Fig. 7 Time resolved emission spectra of (a) YF3: 2.5 mol% Eu3+ nanoparticles at the delay time of 0.65 ms and 7.25 ms; (b) YF3: 2.5 mol% Ce3+, 2.5 mol% Eu3+ nanoparticles at the delay time of 0.13 ms and 8.13 ms after the pulse. | ||
Owing to the strong absorption in the UV range (200–300 nm) due to the allowed transitions of Ce3+, followed by efficient energy transfer, intense emissions are observed corresponding to the respective activators. The Ce3+ to Ln3+ energy transfer efficiency can also be estimated based on the equation η = 1 − Id/Id0 = 1 − τd/τd0, where Id, Id0 and τd, τd0 are the intensity of the emission and excited state lifetimes of the donor in the presence and absence of the acceptor, respectively. In a powder pattern it is quite possible that the intensities of the peaks may not be true representations of the luminescence efficiency, hence the lifetime values are used for calculating the energy transfer efficiency. It is exemplified by calculating the energy transfer efficiency for Ce3+ to Sm3+. The lifetime of Ce3+ in the absence of any activator in YF3: 2.5 mol% Ce3+ was found to be 30 ns. In YF3: 2.5 mol% Ce3+, 2.5 mol% Sm3+, the lifetime of Ce3+ was found to be 15 ns. Hence, the energy transfer efficiency from Ce3+ to Sm3+ is 50%. However, in the case of YF3: Ce3+, Eu3+, a reduction in the lifetime of Ce3+ is also observed even though there is no increase in the luminescence properties on co-doping with Ce3+ which indicates that the non-radiative mechanisms are also operating in the lattice.
4. Conclusions
To conclude, redispersible YF3: Ln3+ (Ln3+: Eu3+, Tb3+, Dy3+, Sm3+) and YF3: Ce3+/Ln3+ nanoparticles could be obtained by a simple polyol route. Formation and stabilization of the nanoparticles by ethylene glycol (used as the solvent) could be confirmed by X-ray diffraction and FT-IR spectroscopy respectively. By introducing Ce3+ as a sensitizer in YF3: Ln3+, these nanopowders efficiently absorb UV-light (∼256 nm) due to Ce3+ absorption and produce various luminescent colors on single wavelength excitation. The time resolved studies and the change in luminescence behavior of Eu3+ doped samples on exciting at different wavelengths indicated the presence of two different sites for the rare earth ions in YF3 nanoparticles. Reduction in lifetime of Ce3+ emission when doped along with activators and increase in lifetimes of activators (except Eu3+), supported the energy transfer taking place. Thus these results suggest that these nanoparticles can be explored for their potential use as tags in multiplexing biological labelling as well as phosphors for solid state lighting.References
- M. Dejneka, E. R. Snitzer and E. Riman, J. Lumin., 1995, 65, 227–245 CrossRef CAS.
- S. Tanabe and T. Tamaoka, J. Non-Cryst Solids, 2003, 283, 326–327 Search PubMed.
- G. Yi, H. Lu, S. Zhao, G. Yue, W. Yang, D. Chen and L. H. Guo, Nano Lett., 2004, 4, 2191–2196 CrossRef CAS.
- C. M. Bender and J. M. Burlitch, Chem. Mater., 2000, 12, 1969–1976 CrossRef CAS.
- Z. L. Wang, H. L. W. Chan, H. L. Li and J. H. Hao, Appl. Phys. Lett., 2008, 93, 141106 CrossRef.
- P. S. Peijzel, R. T. Wegh, A. Meijerink, J. Holsa and R. J. Lamminmaki, Opt. Commun., 2002, 204, 195–202 Search PubMed.
- W. W. Piper, J. A. DeLuca and F. S. Ham, J. Lumin., 1974, 8, 344–348 CrossRef CAS.
- K. J. Guedes, K. Krambrock and J. Y. Gesland, J. Phys. Chem. Solids, 2001, 62, 485–489 CrossRef CAS.
- M. M. Lage, A. Righi, F. M. Matinaga, J. Y. Gesland and R. L. Moreira, J. Phys.: Condens. Matter, 2004, 16, 3207–3218 CrossRef CAS.
- Y. W. Zhang, X. Sun, R. Si, L. P. You and C. H. Yan, J. Am. Chem. Soc., 2005, 127, 3260–3261 CrossRef CAS.
- J. L. Lemyre and A. M. Ritcey, Chem. Mater., 2005, 17, 3040–3043 CrossRef CAS.
- R. X. Yan and Y. D. Li, Adv. Funct. Mater., 2005, 15, 763–770 CrossRef CAS.
- X. Wang and Y. D. Li, Angew. Chem., Int. Ed., 2003, 42, 3497–3500 CrossRef CAS.
- X. Wang, J. Zhuang, Q. Peng and Y. Li, Inorg. Chem., 2006, 45, 6661–6665 CrossRef CAS.
- S. Wang, S. Song, R. Deng, H. Guo, Y. Lei, F. Cao, X. Li, S. Su and H. Zhang, CrystEngComm, 2010, 12, 3537–3541 RSC.
- F. Tao, Z. J. Wang, L. Z. Yao, W. L. Cai and X. G. Li, J. Phys. Chem. C, 2007, 111, 3241–3245 CrossRef CAS.
- L. H. Slooff, M. J. A. de Dood, A. Van Blaaderen and A. Polman, Appl. Phys. Lett., 2000, 76, 3682–3684 CrossRef CAS.
- St J. John, J. L. Coffer, Y. D. Chen and R. F. Pinizzotto, J. Am. Chem. Soc., 1999, 121, 1888–1892 CrossRef CAS.
- K. Riwotzki, H. Meyssamy, H. H. Schnablegger, A. Kornowski and M. Haase, Angew. Chem., Int. Ed., 2001, 40, 573–576 CrossRef CAS.
- J. W. Stouwdam and F. Van Veggel, Nano Lett., 2002, 2, 733–737 CrossRef CAS.
- P. R. Diamente and F. Van. Veggel, J. Fluoresc., 2005, 15, 543–551 CrossRef CAS.
- F. Wang, Y. Zhang, X. P. Fan and M. Q. Wang, Nanotechnology, 2006, 17, 1527–1532 CrossRef CAS.
- P. Schuetz and F. Caruso, Chem. Mater., 2002, 14, 4509–4516 CrossRef CAS.
- M. Yu, J. Lin, J. Fu, H. J. Zhang and Y. C. Han, J. Mater. Chem., 2003, 13, 1413–1419 RSC.
- F. N. Sayed, V. Grover, K. A. Dubey, V. Sudarsan and A. K. Tyagi, J. Colloid Interface Sci., 2011, 353, 445–453 CrossRef CAS.
- M. Yamaga, E. Hayashi, N. Kodama, K. Itoh, S. Yabashi, Y. Masui, S. Ono, N. Sarukura, T. P. J. Han and H. G. Gallagher, J. Phys.: Condens. Matter, 2006, 18, 6033–6044 Search PubMed.
Footnote |
| † Electronic Supplementary Information (ESI) available. See DOI: 10.1039/c1ra00651g/ |
| This journal is © The Royal Society of Chemistry 2012 |