Enhanced hydrogen storage properties of NaAlH4 co-catalysed with niobium fluoride and single-walled carbon nanotubes†
Jianfeng
Mao
*a,
Zaiping
Guo
*ab and
Huakun
Liu
a
aInstitute for Superconducting and Electronic Materials, University of Wollongong, NSW 2522, Australia. E-mail: jeff.mao@hotmail.com; zguo@uow.edu.au
bSchool of Mechanical, Materials & Mechatronics Engineering, University of Wollongong, NSW 2522, Australia
First published on 22nd December 2011
Abstract
The effects of single-walled carbon nanotubes (SWCNTs) as a co-catalyst with NbF5 on the dehydrogenation and hydrogenation kinetics of NaAlH4 were investigated by X-ray diffraction, Fourier transform infrared spectroscopy, differential thermal analysis, temperature-programmed desorption, and isothermal hydrogen ab/desorption techniques. It has been revealed that there is a synergistic effect of SWCNTs and NbF5 on the de/rehydrogenation of NaAlH4, which improves the hydrogen de/absorption performance when compared to adding either SWCNTs or NbF5 alone. For example, the apparent activation energy for the first-step and the second-step dehydrogenation of the co-doped NaAlH4 sample is estimated to be 85.9 and 96.2 kJ mol−1, respectively, using Kissinger's approach, which is lower than the pristine, SWCNT-, and NbF5 doped NaAlH4, respectively, indicating a reduced kinetic barrier. These results are attributed to the active Nb-containing species and the function of F anions, as well as the nanosized pores and high specific surface area of the SWCNTs, which facilitates the dissociation and recombination of hydrogen molecules on its surface and the atomic hydrogen diffusion along the grain boundaries and inside the grains, and decreases the segregation of bulk Al after the desorption. Hence, the combined catalytic mechanism is presented.
Introduction
Clean energy sources such as wind, solar, and hydropower are needed to meet the challenges of global warming and to address the finite nature of fossil fuel based energy resources. However, for the environmentally friendly use of the energy produced by these sources in final applications, a clean, efficient, and safe energy carrier is necessary. Since the development of the proton exchange membrane (PEM) fuel cell, which is fuelled by hydrogen and oxygen, and produces only water, hydrogen has been seen to be the most promising solution.1 However, the use of hydrogen for fuel-cell powered mobile applications requires materials that not only store hydrogen at high density, but that can operate reversibly at ambient pressure and temperatures below approximately 100 °C.2Among the many materials studied for hydrogen storage, complex hydrides of light metals containing borohydride,3amide,4 and alanate5,6 anions have high hydrogen capacity and, thus, have been studied extensively. However, the thermodynamic and kinetic properties of the borohydrides limit their ability to cycle hydrogen at low temperatures. On the other hand, the elimination of ammonia gas in using amides for hydrogen storage is the most important issue, because a very small amount of ammonia (ppm level) poisons the catalysts of proton exchange membrane (PEM) fuel cells. In this regard, sodium alanate has offered good prospects due to the high purity of its released hydrogen, its high reversible hydrogen storage capacity, and its optimal thermodynamic stability for reversible hydrogen storage at moderate temperatures, since Bogdanović and Schwickardi demonstrated that transition-metal dopants can considerably lower the kinetic barriers for both hydrogenation and dehydrogenation of NaAlH4.6 It is well known that NaAlH4 decomposes to release hydrogen in three steps according to the following reactions:
| NaAlH4 ↔ 1/3Na3AlH6 + 2/3Al + 3/2H2 3.7 wt% H2 | (1) |
| Na3AlH6 ↔ 3NaH + Al + 3/2H2 1.9 wt% H2 | (2) |
| NaH ↔ Na + 1/2H2 1.9 wt% H2 | (3) |
In principle, gives 3.7 wt% hydrogen and the second one 1.9 wt% upon heating. The last reaction, eqn (3), however, occurs at over 300 °C, releasing another 1.9 wt% of hydrogen. This temperature is high, and hence, the desorption of NaH is not considered a useful capacity for practical purposes. By doping with a few mol% of selected catalyst, NaAlH4 can reversibly release and take up hydrogen, as described above for the first two-step reaction. During the past decade, various catalysts, such as carbon,7 transition metal,8 and rare earth metal9 based materials have been found to be active in significantly enhancing the reaction kinetics of NaAlH4. However, further improvements in the dehydriding and hydriding kinetics of NaAlH4 are highly desirable. In addition, an understanding of the hydrogen desorption/absorption of NaAlH4 doped with a metal based catalyst is still unclear. For example, several Ti-containing species including Ti–Al alloy, Ti hydrides, and Ti cations in the NaAlH4 lattice are proposed as the active species in Ti doped NaAlH4, but none of them has been conclusively confirmed.8
More recently, it was demonstrated that the catalytic effects of transition metals such as Ti and Zr combined with porous materials such as carbon nanotubes (CNTs) and porous SiO2 as mixed dopants lead to significant acceleration of hydrogen dissociation and diffusion, approaching the goal of rapid hydrogenation kinetics at practically meaningful low temperatures.10 For example, Wang et al.10 found that all five carbons SWCNTs, multiwalled CNTs (MWCNTs), activated carbon (AC), fullerenes (C60), and graphite G) exhibited significant, sustaining, and synergistic co-catalytic effects on the dehydrogenation and hydrogenation kinetics of Ti-doped NaAlH4 that persisted through charge and discharge cycling, in which SWCNTs were the best co-catalyst. This indicates that the synergistic interaction among metals and carbon nanotubes may be an effective strategy to significantly lower the operating temperature and to increase hydrogenation kinetics. Despite this progress, the dehydrogenation and hydrogenation kinetics still fall short of the requirements for practical applications. It is therefore desirable to further explore and develop the synergistic effects of CNTs with other metallic catalysts in order to achieve faster kinetics.
In our previous work, we demonstrated that the hydrogen desorption/absorption of NaAlH4 can be significantly improved by introducing NbF5 through the in situ formation of active Nb-containing catalysts and the function of F− anions.11 In this paper, we investigate the effects of single walled carbon nanotubes (SWCNTs) as a co-dopant on the hydrogen desorption/absorption of NbF5-doped NaAlH4. By comparing the hydrogen release/uptake kinetics with those of pristine NaAlH4, SWCNT-doped NaAlH4, and NbF5-doped NaAlH4, which possesses state-of-art kinetics among the various forms of doped NaAlH4, we will show how SWCNTs can improve the hydrogen release/uptake kinetics of NbF5-doped NaAlH4 by a series of dehydrogenation/rehydrogenation measurements. Moreover, in order to acquire detailed information about the kinetics of the reactions, the non-isothermal Kissinger method has been used to evaluate the activation energy. At the end of the article, on the basis of these findings and the previous investigations, the active species and the catalysis are discussed.
Experimental procedures
The chemicals NaAlH4 (hydrogen-storage grade, ≥93% purity), NbF5 (98%), and single walled carbon nanotubes (SWCNTs) were all purchased from Sigma-Aldrich and used directly without pretreatment. All sample storage and handling were performed in an Ar filled glove box (MBraun Unilab). A QM-3SP2 planetary ball mill was employed to prepare the pristine NaAlH4, NaAlH4-3 mol% NbF5, NaAlH4-5 wt% SWCNT and NaAlH4-3 mol% NbF5-5 wt% SWCNT samples, under an argon atmosphere at 450 rpm. Each time, about 1 g of a sample was prepared with 2 h of ball milling, with a ball-to-powder ratio of around 30![[thin space (1/6-em)]](https://www.rsc.org/images/entities/char_2009.gif) :
:![[thin space (1/6-em)]](https://www.rsc.org/images/entities/char_2009.gif) 1.
1.
The hydrogen desorption/absorption properties were measured in a Sieverts apparatus (Advanced Materials Corporation, USA), where the temperatures and pressures of the sample and the gas reservoirs were monitored and recorded by GrcLV-LabVIEW-based control program software during the sorption process. Temperature programmed desorption (TPD) curves were determined by volumetric methods starting from vacuum. The temperature was increased from ambient to ∼300 °C at 2 °C min−1. The hydrogen desorption kinetic measurements were performed at the desired temperature starting from vacuum. The hydrogen absorption measurements were performed at 150 or 160 °C and 55 or 65 bar hydrogen pressure. The sample was thoroughly dehydrogenated at 300 °C under dynamic vacuum before the rehydrogenation measurement. Other than specified, the H-capacity was calculated using the total weight of the samples to allow for an evaluation of the practical hydrogen storage properties.
Differential scanning calorimetry (DSC) analysis of the dehydrogenation process was carried out on a Mettler ToledoTGA/DSC 1. About 2–6 mg of the sample was loaded into an alumina crucible in the glove box. The crucible was then placed in a sealed glass bottle in order to prevent oxidation during transportation from the glove box to the DSC apparatus. An empty alumina crucible was used as the reference material. The samples were heated from room temperature to 300 °C under 1 atm flowing argon atmosphere, and the heating rate was 2 °C min−1.
The phase structures of various samples at different stages were identified by a GBC X-ray diffractometer with Cu-Kα radiation at 40 kV and 25 mA. In order to avoid oxidation during the X-ray diffraction (XRD) measurement, samples were mounted on a glass slide 1 mm in thickness in the Ar-filled glove box and sealed with an airtight hood composed of amorphous tape. To obtain the information of Al–H bond, the obtained samples were ground with KBr and pressed into a sample cup, and the vibration spectra of the species were then identified using a Shimadzu Prestige 21 Fourier transform infrared spectrometer (FTIR) in absorbance mode.
Results and discussion
Hydrogen desorption
Fig. 1 reveals the effects of NbF5 and the SWCNTs, when used separately as single catalysts or together as co-catalysts, on the dehydrogenation of NaAlH4 by means of TPD curves. It was observed that the pristine NaAlH4 starts to release a small amount of hydrogen at around 183 °C, which is probably due to the melting of NaAlH4. Most of the hydrogen was released starting at 210 °C, and release was completed at 283 °C. The total amount of hydrogen evolved is about 5.5 wt%, which is very close to the theoretical value from eqn.(1) and (2), but these two steps of dehydrogenation were not distinct. In contrast, a significant catalytic effect was observed in the curves for the NbF5-doped, SWCNT-doped, and NbF5 and SWCNT co-doped samples, which exhibited two distinct dehydrogenation steps at much lower dehydrogenation temperatures. For the NbF5-doped NaAlH4 sample, the first-step dehydrogenation could be finished at around 178 °C. Further heating led to a second decomposition, which was completed at 225 °C. For the SWCNT-doped NaAlH4 sample, the first and second dehydrogenation steps could be finished at 181 and 223 °C, respectively. Clearly, the dehydrogenation temperature of the NaAlH4 is reduced by addition of either NbF5 or SWCNTs, suggesting that a catalytic effect occurred. Furthermore, the NbF5 and SWCNT co-doped NaAlH4 sample can complete its first and second-step dehydrogenation at 159 and 201 °C, respectively, which is lower than for the NbF5 or SWCNT-doped NaAlH4 samples. These results clearly show the synergistic effects associated with the use of SWCNTs as a co-catalyst with NbF5.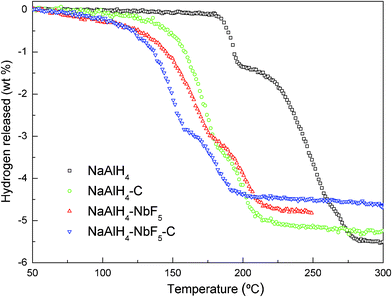 | ||
| Fig. 1 Temperature programmed desorption (TPD) curves of as-milled NaAlH4, and NaAlH4 doped with different catalysts. The heating rate was 2 °C min−1. | ||
The aforementioned TPD results are confirmed by the DSC curves shown in Fig. 2. Clearly, the plot for the pristine NaAlH4 shows four distinct endothermic processes, which can be assigned to the melting of NaAlH4 (∼185 °C), along with slight decomposition of the NaAlH4, the decomposition of molten NaAlH4 to Na3AlH6 (195–252 °C), a phase transition of α–Na3AlH6 to β–Na3AlH6 (∼264 °C) and the decomposition of Na3AlH6 into NaH and Al (171–286 °C). However, only two endothermic peaks are seen in the dehydrogenation of the doped NaAlH4 samples. In the case of the NbF5-doped sample, the first peak at about 178 °C is attributed to the dehydrogenation of NaAlH4, and the second peak at 215 °C corresponds to the dehydrogenation of Na3AlH6. For the SWCNT-doped sample, the first and second peaks were observed at 179 and 219 °C, corresponding to the decomposition of NaAlH4 and Na3AlH6, respectively. As a whole, the DSC curves for the co-doped NaAlH4 sample were similar to those of the NbF5 or SWCNT doped samples, displaying only two endothermic peaks, corresponding to eqn. (1) and (2), respectively, but both endothermic peaks had moved to lower temperatures. The first peak at about 169 °C is attributed to the dehydrogenation of NaAlH4, and the second peak at 209 °C corresponds to the dehydrogenation of Na3AlH6, which is lower than for either the NbF5 or the SWCNT doped samples. These results further confirmed the synergistic effect of NbF5 and SWCNTs towards the decomposition of NaAlH4.
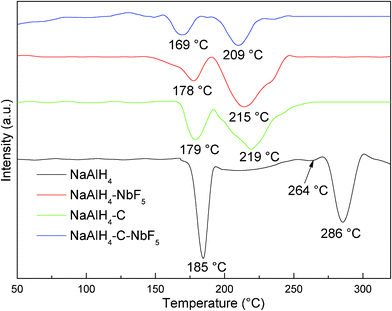 | ||
| Fig. 2 Differential scanning calorimetry (DSC) curves of the NaAlH4, NaAlH4-3 mol% NbF5, NaAlH4-5 wt% SWCNT, and NaAlH4-3 mol% NbF5-5 wt% SWCNT samples. | ||
A comparative evaluation of the isothermal dehydrogenation kinetics of NaAlH4 with single catalysts (NbF5, SWCNTs) and co-catalysts (NbF5 and SWCNTs together) at 155 °C was performed, as shown in Fig. 3. For the pristine NaAlH4, no appreciable hydrogen desorption is detected within 120 min at 155 °C (results not shown here). However, the NbF5-doped sample releases around 2.5 wt% hydrogen within 50 min. The hydrogen evolved from the SWCNT-doped NaAlH4 sample is 2.4 wt% in 50 min, which is a little lower than for the NbF5-doped sample. The results indicate that the hydrogen released from the SWCNT- and NbF5-doped samples at 155 °C is attributable to the first-step dehydrogenation of NaAlH4 according to eqn. (1). However, the dehydrogenation curves for the co-doped sample showed a two-step decomposition feature, corresponding to the first reaction stage (1) and the second reaction stage (2) of NaAlH4, respectively. The co-doped sample releases about 2.5 wt% hydrogen in 6 min and another 1.45 wt% in the following 120 min, almost all of the hydrogen in the post-milled sample. This phenomenon further indicates that a synergistic catalysis from the combination of NbF5 and SWCNTs exists for NaAlH4.
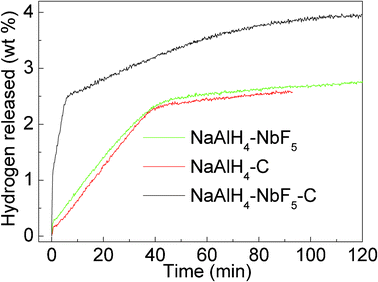 | ||
| Fig. 3 Isothermal dehydrogenation curves at 155 °C for NaAlH4-3 mol% NbF5, NaAlH4-5 wt% SWCNT, and NaAlH4-3 mol% NbF5-5 wt% SWCNT samples. | ||
Hydrogen absorption
Fig. 4 presents a systematic comparison of the absorption behaviour between the NaAlH4 samples with NbF5 or SWCNTs as the sole additive and with NbF5 and SWCNTs as co-additives. It was observed that the simultaneous addition of NbF5 and SWCNTs further improves the absorption rate of NaAlH4. At 150 °C and 55 bar in Fig. 4(a), the saturated hydrogenation process for the co-doped sample can be limited to within 20 min, which is lower than for the SWCNT doped sample (48 min) and much lower than for the NbF5 doped sample (96 min). On increasing the hydrogenation temperature and pressure up to 160 °C and 6.5 MPa (see Fig. 4(b)), the rehydrogenation capacity remains unchanged for the three samples, but the absorption rate is increased, leading to saturated rehydrogenation times of 7, 14, and 49 min, respectively, for the co-doped, SWCNT doped, and NbF5 doped samples. These results clearly show that the co-doped NaAlH4 has better rehydrogenation kinetics than the samples doped with a single catalyst.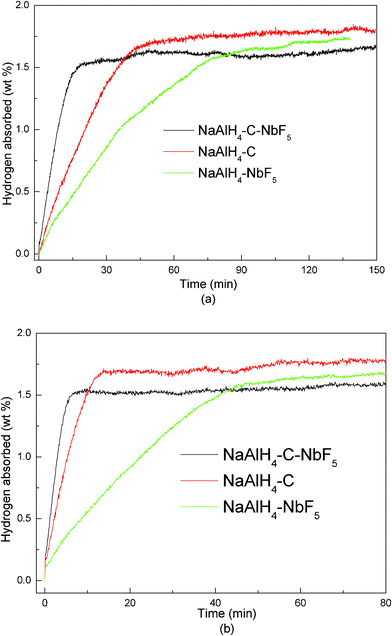 | ||
| Fig. 4 Comparison of the hydrogenation curves for the first dehydrogenation cycle of NaAlH4-3 mol% NbF5, NaAlH4-5 wt% SWCNT, and NaAlH4-3 mol% NbF5-5 wt% SWCNT samples at (a) 150 °C and 5.5 MPa H2 pressure and (b) 160 °C and 6.5 MPa H2 pressure. | ||
It is worth noting that the rehydrogenation capacity for the SWCNT-doped, NbF5-doped, and SWCNT–NbF5 co-doped samples is 1.78, 1.73, and 1.66 wt%, respectively. These values are similar to those found in the second-step dehydrogenation processes in these three samples, suggesting that the hydrogen released from the rehydrogenated sample is from the separate contributions of the reformed Na3AlH6. To confirm this, these rehydrogenation products for the three samples were examined by means of TPD, and the TPD curves are compared in Fig. 5. Fig. 5 presents the TPD curves for the first hydrogenation cycle of the three samples. All the curves show one hydrogen release step, starting at over 150 °C and completed before 240 °C, with a hydrogen capacity of between 1.5–1.7 wt%. All in all, these results indicate the recombination of Na3AlH6 in all three samples. The absence of NaAlH4 in the rehydrogenated state is possibly due to the quite high equilibrium hydrogen pressure required for the transformation from Na3AlH6 to NaAlH4 in the hydrogenation process by eqn. (1).12 Meanwhile, the dehydrogenation temperature for the rehydrogenated SWCNT doped sample is similar to that of the rehydrogenated NbF5 doped sample. However, the co-doped sample has the lowest dehydrogenation temperature compared to the SWCNT and NbF5 doped samples, further confirming the synergistic effect of NbF5 and SWCNTs.
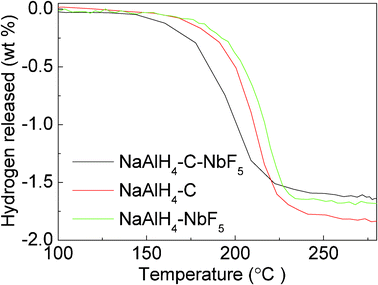 | ||
| Fig. 5 TPD curves of the NaAlH4-3 mol% NbF5, NaAlH4-5 wt% SWCNT, and NaAlH4-3 mol% NbF5-5 wt% SWCNT samples for the first rehydrogenation. | ||
Structure analysis
An intriguing aspect of the co-doped NaAlH4 sample after cycling through synthesis, dehydrogenation, and rehydrogenation is illustrated by the XRD patterns shown in Fig. 6. After ball milling, only peaks due to the NaAlH4 and a small amount of Al are observed. The crystalline Al is most likely formed by the decomposition of a minor part of the NaAlH4 during the ball milling, due to the effects of the NbF5 and SWCNTs. Upon desorption of the hydrogen from the as-milled sample, the NaAlH4 phase has disappeared, and more the crystalline Al and NaH are observed, indicating the complete decomposition of NaAlH4 according to eqn. (1) and eqn. (2). After rehydrogenation, the peak due to the crystalline Al decreases in height, and the new phase Na3AlH6 is formed. Nevertheless, no crystalline NaAlH4 is formed, which is possibly due to the quite high equilibrium hydrogen pressure required for the transformation of Na3AlH6 to NaAlH4 in the hydrogenation process by eqn. (1). However, no C, Nb-, or F-containing species could be detected in the co-doped sample in the different stages, which may be attributed to the low concentration (NbF5) or amorphous state (C) in the sample.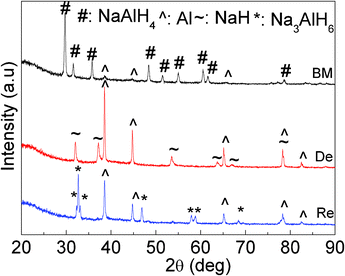 | ||
| Fig. 6 XRD patterns of the NaAlH4-3 mol% NbF5-5 wt% SWCNT samples after ball milling (BM), of the milled sample after dehydrogenation (De), and of the dehydrogenated sample after rehydrogenation (Re). | ||
In order to detect the existing state of C, Nb and F in the NbF5 and SWCNT co-doped NaAlH4 sample, two samples of NaAlH4-30 wt% NbF5-15 wt% SWCNT and NaAlH4-60 wt% NbF5-30 wt% SWCNT were further prepared by increasing the amount of NbF5 and SWCNT. Then, the XRD patterns of the as-milled samples were analysed, as shown in Fig. 7. Clearly, only NaAlH4 and Al phases were observed in the case of NaAlH4-30 wt% NbF5-15 wt% SWCNT. However, for the NaAlH4-60 wt% NbF5-30 wt% SWCNT samples, the NaAlH4 phase disappeared. Meanwhile, in addition to Al, the new phases of Al3Nb, NbHx, and NaF were identified although their diffraction peaks are weak and distorted (Fig. 7 and Fig. S1, ESI†). Since NaAlH4 was stable when it was ball milled alone,11 the consumption of NaAlH4 and the formation of Al3Nb, NbHx, and NaF in the case of NaAlH4-60 wt% NbF5-30 wt% SWCNT were very likely due to a chemical reaction between NaAlH4 and NbF5. The result agrees well with our previous report that Al3Nb, NbHx, and NaF were also detected in the NbF5 doped NaAlH4 sample after ball milling.11 Therefore, it can be deduced that similar to the case of NbF5 doped NaAlH4, the NbF5 still prefer to react with NaAlH4 during ball milling to generate the active Nb and F containing species in the case of NbF5 and SWCNT co-doped sample.
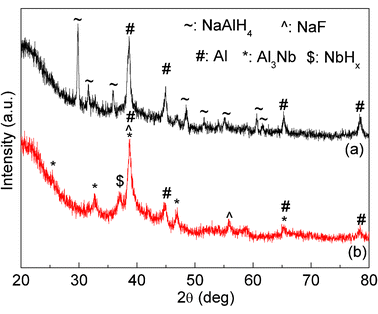 | ||
| Fig. 7 XRD patterns of the (a) NaAlH4-30 wt% NbF5-15 wt% SWCNT and (b) NaAlH4-60 wt% NbF5-30 wt% SWCNT samples after ball milling. | ||
The FTIR spectra for the pure, NbF5 doped, SWCNT doped, and co-doped NaAlH4 are compared in Fig. 8, in which two intense bands appear at 1694 cm−1 and 866 cm−1, which are attributed to the ν3 [AlH4]− stretching and ν4 [AlH4]− bending modes, respectively. In comparison with the pristine sample, the host bands for the doped samples remain unchanged in position, but are reduced in intensity. The observed reduction in the stretching and bending bands is indicative of the weakening of the Al–H bonds in the NaAlH4 lattice, which cause hydrogen to desorb at lower temperatures, as well as facilitating the absorption of H2 to reverse the dehydrogenation reaction. Moreover, the co-doped sample displayed the weakest intensity, indicating that a synergetic effect between NbF5 and SWCNTs may be present.
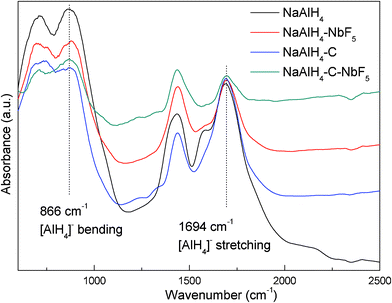 | ||
| Fig. 8 FTIR spectra of NaAlH4, NaAlH4-3 mol% NbF5, NaAlH4-5 wt% SWCNT, and NaAlH4-3 mol% NbF5-5 wt% SWCNT samples after ball milling. | ||
Activation energy
To further study the effect of the co-catalyst on the kinetic barrier, the apparent activation energy (Ea) relating to the first and the second-step dehydrogenation of NaAlH4 was estimated using the non-isothermal Kissinger method according to the following equation.13| ln (β/Tm2) = -Ea/RT | (4) |
Where Ea is the activation energy, β is the heating rate in °C min−1, Tm is the absolute temperature for the maximum desorption rate, and R is the gas constant. In this work, Tm was obtained using TPD measurement with the selected heating rates of 0.5, 1, 2 and 5 °C min−1. The detailed TPD curves are shown in Figures S2–S4 of the ESI.† Plotting ln(β/Tm2) versus 1/Tm yields a straight line with the slope of −Ea/R. Fig. 9 shows the Kissinger plots for the first-step and second-step dehydrogenation of the co-doped NaAlH4 sample, together with NbF5– and SWCNT-doped samples for comparison. The intrinsic linearity of all of the curves indicates that the dehydrogenation kinetics of doped NaAlH4 is well represented by the non-isothermal Kissinger equation and that they follow a first order decomposition reaction.
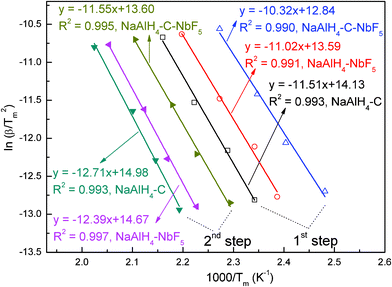 | ||
| Fig. 9 Kissinger plots for the first and second dehydrogenation steps for the NaAlH4-3 mol% NbF5, NaAlH4-5 wt% SWCNT, and NaAlH4-3 mol% NbF5-5 wt% SWCNT samples. | ||
The derived values of the activation energies, Ea1, for the first step [i.e., eqn. (1)] and Ea2 for the second step [i.e., eqn. (2)], are listed in Table 1. For comparison, Ea1 and Ea2 of pristine NaAlH4 are also included in Table 1.14 Comparison of the activation energies for dehydrogenation reveals several phenomena as follows: (1) All of the present additives significantly enhance the dehydrogenation kinetics of NaAlH4 and Na3AlH6 (reducing Ea1 and Ea2). (2) SWCNTs enhance the kinetics of NaAlH4, reducing Ea1 from 118.1 to 95.8 kJ mol−1, and Ea2 from 120.7 to 105.8 kJ mol−1, showing that the addition of SWCNTs reduces energy barriers for both eqn.(1) and eqn. (2). (3) Compared to the SWCNT doped sample, the NbF5 doped sample has a lower Ea1 (91.7 kJ mol−1) and Ea2 (103.1 kJ mol−1), indicating that NbF5 is more effective for the decomposition of NaAlH4. It should be noted that the activation energies for the decomposition of NbF5 doped NaAlH4 are slightly different to that of our previous report, which is probably due to the fact that the Tm was obtained using TPD measurement in this paper but using DSC measurement in the previous report.11 (3) The combination of SWCNTs and NbF5 was more efficient than those of SWCNTs or NbF5 alone, lowering the Ea1 and Ea2 to 85.9 and 96.2 kJ mol−1, respectively. This phenomenon indicates that a synergistic catalytic effect between the NbF5 and SWCNTs exists for NaAlH4.
| Samples | E a1 (kJ mol−1) | E a2 (kJ mol−1) |
|---|---|---|
| NaAlH4 | 118.1 | 120.7 |
| NaAlH4–NbF5 | 91.7 | 103.1 |
| NaAlH4–C | 95.8 | 105.8 |
| NaAlH4–C–NbF5 | 85.9 | 96.2 |
Discussion
On the basis of the above results, it is evident that the dehydrogenation and rehydrogenation kinetics of NaAlH4 were enhanced by introducing NbF5 or SWCNTs. As discussed in our previous paper,11 a much higher dispersion of Nb–Al and Nb–H active species may form on the hydride surface or grain boundaries during ball milling or after the heating process in the NbF5–doped NaAlH4, which may facilitate the dissociation/recombination of molecular hydrogen and mass transport. Meanwhile, the introduction of F-anions may also play a role, which has also been theoretically and experimentally demonstrated in the study of NaAlH4.15 Therefore, it was believed that both Nb and F containing species play critical roles in the dehydrogenation/hydrogenation process of the NaAlH4 sample with added NbF5. The reasons for the improvement in the dehydrogenation of NaAlH4 doping with SWCNTs can be understood from the following three aspects: (1) SWCNTs exhibits a prominent “catalytic” effect in NaAlH4. Based on the experimental observations and theoretical calculations, Berseth et al. provided a general understanding of the catalytic mechanism by the carbon catalysts that interaction of NaAlH4 with an electronegative substance such as carbon nanotube affects the charge donation from Na to AlH4, consequently weakening the Al–H bond and decreasing the dehydrogenation temperatures as well as facilitating the rehydrogenation reaction.7 Actually, the weakening of Al–H bond in the NaAlH4 lattice was confirmed by FTIR in the case of NaAlH4-5 wt% SWCNTs, compared with pristine NaAlH4 sample (Fig. 8). (2) Because of the nanosize and strength, the SWCNTs can penetrate in NaAlH4 matrix either nearly vertically or in an inclined orientation. Therefore, the presence of SWCNTs may facilitate the atomic hydrogen diffusion both inside the phase grains and along the grain boundaries. (3) The presence of SWCNTs may also modify the grain interfaces of dehydrogenated phases due to its high specific surface area, especially by inhibiting the aggregation of Al particles. All these are responsible for the decrease in both the onset dehydrogenation temperature and the activation energy in the SWCNT-doped NaAlH4.It was also shown that co-doping with NbF5 and SWCNTs exhibits superior de/rehydrogenation properties to that doping with single NbF5 or SWCNTs, indicating a favorable synergistic effect. It is already well known that combined utilization of catalytically active metal nanoparticles and nanostructured carbon materials is effective for improving the dehydriding/rehydriding properties of metal hydrides, and this strategy has been intensely developed over the past several decades,10,16 where the carbon nanotubes are expected to form a net-like structure after being milled together with host metal hydrides, thus creating a microconfined environment for the decomposition/restoration of hydrides, while the metal nanoparticles have high catalytic activity. In our case, we also believe that both NbF5 and SWCNTs play important roles in the dehydrogenation/hydrogenation process of the co-doped NaAlH4. Similar to the NbF5 doped NaAlH4, the active species of NbHx, Al3Nb, and NaF were also found in the co-doped sample (Fig. 7).11 The results indicate that NbF5 prefers to react with NaAlH4 during ball milling to generate the active Nb and F containing species in the NbF5 and SWCNT co-doped sample. The role of SWCNTs in the co-doped sample could be more “physical” than “chemical” compared with the catalytic role of NbF5 in that it modifies the grain surface of the de-hydrogenated phases probably due to the inhibition of grain aggregation. As a consequence, a favourable synergistic effect on the dehydrogenation and rehydrogenation of NaAlH4 is achieved in the co-doped NaAlH4 sample through the formation of Nb- and F- containing species, and the presence of SWCNTs. All these complex factors resulted in together the improvement of the hydrogen storage performances of NaAlH4.
Conclusions
The effects of SWCNTs as a co-catalyst with NbF5 on the dehydrogenation and hydrogenation kinetics of NaAlH4 are presented in the present study. Either the SWCNTs or the NbF5 alone can improve the hydrogen de/absorption properties of NaAlH4. Moreover, a synergistic effect on the dehydrogenation of NaAlH4 occurs when SWCNTs are added as a co-dopant with NbF5. For example, the synergistic effect results in the apparent activation energy for the first-step and the second-step dehydrogenation of NaAlH4 being reduced to 85.9 kJ mol−1 and 96.2 kJ mol−1, respectively. These positive effects can be ascribed to the in situ formation of Nb- and F- containing species in the NbF5, as well as the presence of nanosized pores and the high specific surface area of the SWCNTs.Acknowledgements
We would like to acknowledge support from the University of Wollongong, as well as critical reading by Dr Tania Silver.References
- (a) V. Mehta and J. S. Cooper, J. Power Sources, 2003, 114, 32 CrossRef CAS; (b) V. M. Vishnyakov, Vacuum, 2006, 80, 1053 CrossRef CAS.
- (a) L. Schlapbach and A. Zuttel, Nature, 2001, 414, 353 CrossRef; (b) S. V. Alapati, J. Karl Johnson and D. S. Sholl, Phys. Chem. Chem. Phys., 2007, 9, 1438 RSC.
- (a) A. Züttel, S. Rentsch, P. Fischer, P. Wenger, P. Sudan, P. Mauron and C. Emmenegger, J. Alloys Compd., 2003, 356-357, 515 CrossRef; (b) S. Orimo, Y. Nakamori, G. Kitahara, K. Miwa, N. Ohba, S. Towata and A. Züttel., J. Alloys Compd., 2007, 404, 427 Search PubMed; (c) P. Mauron, F. Buchter, O. Friedrichs, A. Remhof, M. Bielmann, N. Z. Christoph and A. Züttel, J. Phys. Chem. B, 2008, 112, 906 CrossRef CAS; (d) P. Martelli, R. Caputo, A. Remhof, P. Mauron, A. Borgschulte and A. Züttel., J. Phys. Chem. C, 2010, 114, 7173 CrossRef CAS; (e) J. F. Mao, Z. P. Guo, X. B. Yu and H. K. Liu, J. Phys. Chem. C, 2011, 115, 9283 CrossRef CAS; (f) E. Rönnebro and E. Majzoub, J. Phys. Chem. B, 2007, 111, 12045 CrossRef; (g) Y. Y.Kim, D. Reed, Y. S. Lee, J. Y. Lee, J. H. Shim, D. Book and Y. W. Cho, J. Phys. Chem. C, 2009, 113, 5865 CrossRef CAS; (h) J. F. Mao, Z. P. Guo, C. K. Poh, A. Ranjbar, Y. H. Guo, X. B. Yu and H. K. Liu, J. Alloys Compd., 2010, 500, 200 Search PubMed; (i) K. Chzopek, C. Frommen, A. Leon, O. Zabara and M. Fichtner, J. Mater. Chem., 2007, 17, 3496 RSC; (j) H. W. Li, K. Kikuchi, Y. Nakamori, N. Ohba, K. Miwa, S. Towata and S. Orimo, Acta Mater., 2008, 56, 1342 CrossRef CAS; (k) G. Severa, E. Rönnebro and C. M. Jensen, Chem. Commun., 2010, 46, 421 RSC.
- (a) P. Chen, Z. T. Xiong, J. Luo, J. Lin and K. Tan, Nature, 2002, 420, 302 CrossRef CAS; (b) W. F. Luo, J. Alloys Compd., 2004, 381, 284 CrossRef CAS; (c) H. Y. Leng, T. Ichikawa, S. Hino, N. Hanada, S. Isobe and H. Fujii, J. Phys. Chem. B, 2004, 108, 8763 CrossRef CAS; (d) Y. F. Liu, K. Zhong, M. X. Gao, J. H. Wang, H. G. Pan and Q. D. Wang, Chem. Mater., 2008, 20, 3521 CrossRef CAS; (e) Z. T. Xiong, C. K. Yong, G. Wu, P. Chen, W. Shaw, A. Karkamkar, T. Autrey, M. O. Jones, S. R. Johnson, P. P. Edwards and W. I. F. David, Nat. Mater., 2008, 7, 138 CrossRef CAS.
- (a) J. Chen, N. Kuriyama, Q. Xu, H. T. Takeshita and T. Sakai, J. Phys. Chem. B, 2001, 105, 11214 CrossRef CAS; (b) J. R. Ares, K. F. Aguey-Zinsou, F. Leardini, I. J. Ferrer, J. F. Fernandez, Z. X. Guo and C. Sánchez., J. Phys. Chem. C, 2009, 113, 6845 CrossRef CAS; (c) Y. Y. Kim, E. K. Lee, J. H. Shim, Y. W. Cho and K. B. Yoon, J. Alloys Compd., 2006, 422, 283 CrossRef CAS; (d) N. Hanada, W. Lohstroh and M. Fichtner, J. Phys. Chem. C, 2008, 112, 131 CrossRef CAS; (e) F. H. Wang, Y. F. Liu, M. X. Gao, K. Luo, H. P. Pan and Q. D. Wang, J. Phys. Chem. C, 2009, 113, 7978 CrossRef CAS.
- B. Bogdanović and M. Schwickardi, J. Alloys Compd., 1997, 253-#x2013;254, 1 CrossRef.
- (a) J. Wang, A. D. Ebner, T. Prozorov, R. Zidan and J. A. Ritter, J. Alloys Compd., 2005, 395, 252 CrossRef CAS; (b) A. Zaluska, L. Zaluski and J. O.Ström-Olsen, J. Alloys Compd., 2000, 298, 125 CrossRef CAS; (c) P. Adelhelm, K. P. de Jong and P. E. de Jongh., Chem. Commun., 2009, 41, 6261 Search PubMed; (d) P. A. Berseth, A. G. Harter, R. Zidan, A. Blomqvist, C. M. Araujo, R. H. Scheicher, R. Ahuja and P. Jena, Nano Lett., 2009, 9, 1501 CrossRef CAS; (e) C. Cento, P. Gislon, M. Bilgili, A. Masci, Q. Zheng and P. P. Prosini, J. Alloys Compd., 2007, 437, 360 CrossRef CAS; (f) M. Hudson, H. Raghubanshi, D. Pukazhselvan and O. Srivastava, Int. J. Hydrogen Energy, 2011 DOI:10.1016/j.ijhydene.2011.03.003; (g) A. C. Stowea, J. A. Teprovich, D. A. Knighta, M. S. Wellonsa and R. Zidan, J South Carolina Academy of Science, 2011, 9, 13 Search PubMed.
- (a) K. J. Gross, E. H. Majzoub and S. W. Spangler, J. Alloys Compd., 2003, 356–357, 423 Search PubMed; (b) D. L. Sun, S. Srinivasan, T. Kiyobayashi, N. Kuriyama and C. Jensen, J. Phys. Chem. B, 2003, 107, 10176 CrossRef CAS; (c) P. Wang and C. M. Jensen, J. Alloys Compd., 2004, 379, 99 CrossRef CAS; (d) S. Gomes, G. Renaudin, H. Hagemann, K. Yvon, M. P. Sulic and C. M. Jensen, J. Alloys Compd., 2005, 390, 305 CrossRef CAS; (e) H. Brinks, M. Sulic, C. M. Jensen and B. Hauback, J. Phys. Chem. B, 2006, 110, 2740 CrossRef CAS; (f) F. Fang, J. Zhang, J. Zhu, G. R. Chen, D. L. Sun, B. He, Z. Wei and S. Q. Wei, J. Phys. Chem. C, 2007, 111, 3476 CrossRef CAS; (g) X. D Kang, P. Wang and H. M. Cheng, Int. J. Hydrogen Energy, 2007, 32, 2943 Search PubMed; (h) A. Léon, G. Yalovega, A. Soldatov and M. Fichtner, J. Phys. Chem. C, 2008, 112, 12545 CrossRef CAS; (i) X. Z. Xiao, L. X. Chen, X. L. Fan, X. Wang, C. Chen C, Y. Q. Lei and Q. D. Wang, Appl. Phys. Lett., 2009, 94, 041907 CrossRef; (j) Y. F. Liu, C. Liang, H. Zhou, M. X. Gao, H. G. Pan and Q. D. Wang, Chem. Commun., 2011, 47, 1740 RSC; (k) H. Wang, A. Tezuka, H. Ogawa and T. Ikeshoji, Phys. Rev. B: Condens. Matter Mater. Phys., 2011, 83, 045112 Search PubMed; (l) T. J. Frankcombe, G. J. Kroes, N. I. Choly and E. Kaxiras, J. Phys. Chem. B, 2005, 109, 16554 Search PubMed.
- (a) B. Bogdanović, M. Felderhoff, A. Pommerina, F. Schüth, S. Nick and A. Starka, J. Alloys Compd., 2009, 471, 383 CrossRef CAS; (b) C. Rongeat, N. Scheerbaum, L. Schultz and O. Gutfleisch, Acta Mater., 2011, 59, 1725 Search PubMed; (c) X. L. Fan, X. Z. Xiao, L. X. Chen, K. R. Yu, Z. Wu, S. Q. Li and Q. D. Wang, Chem. Commun., 2009, 44, 6857 Search PubMed; (d) Y. Suttisawat, V. Jannatisin, P. Rangsunvigit, B. Kitiyanan, N. Muangsin and S. Kulprathipanja, Int. J. Hydrogen Energy, 2007, 32, 1277 Search PubMed; (e) T. Sun, B. Zhou, H. Wang and M. Zhu, Int. J. Hydrogen Energy, 2008, 33, 2260 Search PubMed; (f) G. Lee, J. Shim, Y. Cho and K. Lee, Int. J. Hydrogen Energy, 2007, 32, 1911 Search PubMed; (g) D. Pukazhselvan, M. Sterlin Leo Hudson, B. K. Gupta, M. A. Shaz and O. N. Srivastava, J. Alloys Compd., 2007, 439, 243 CrossRef CAS.
- (a) J. Wang, A. D. Ebner and J. A. Ritter, J. Phys. Chem. B, 2006, 110, 17353 CrossRef CAS; (b) Z. Dehouche, L. Lafi, N. Grimard, J. Goyette and R. Chahine, Nanotechnology, 2005, 16, 402 CrossRef CAS; (c) S. Y. Zheng, Y. T. Li, F. Fang, G. Y. Zhou, X. B. Yu, G. R. Chen, D. L. Sun, L. Z. Ouyang and M. Zhu, J. Mater. Res., 2010, 25, 2047 Search PubMed; (d) J. Ma, J. Li, R. Tang, D. W. Li, W. Z. Li an and Q. Y. Chen., Int. J. Hydrogen Energy, 2011, 36, 9091 Search PubMed; (e) Y. Suttisawat, P. Rangsunvigit, B. Kitiyanan and S. Kulprathipanja, J. Solid State Electrochem., 2010, 14, 1813 Search PubMed.
- J. F. Mao, Z. P. Guo and H. K. Liu, Int. J. Hydrogen Energy, 2011, 36, 14503–14511 Search PubMed.
- (a) C. M. Jensen and K. J. Gross, Appl. Phys. A: Mater. Sci. Process., 2001, 72, 213 CrossRef CAS; (b) B. Bogdanović, R. A. Brand, A. Marjanovic, M. Schwickardi and J. Tölle., J. Alloys Compd., 2000, 302, 36 CrossRef CAS.
- H. E. Kissinger, Anal. Chem., 1957, 29, 1702 CrossRef CAS.
- G. Sandrock, K. Gross and G. Thomas, J. Alloys Compd., 2002, 399, 299 Search PubMed.
- (a) L. C. Yin, P. Wang, X. D. Kang, C. H. Sun and H. M. Cheng, Phys. Chem. Chem. Phys., 2007, 9, 1499 RSC; (b) S. Singh and S. W. H. Eijt, Phys. Rev. B: Condens. Matter Mater. Phys., 2008, 78, 224110 CrossRef; (c) X. D. Kang, P. Wang and H. M. Cheng, Scr. Mater., 2007, 56, 361 CrossRef CAS; (d) H. W. Brinks, A. Fossdal and B. C. Hauback, J. Phys. Chem. C, 2008, 112, 5658 CrossRef CAS; (e) Y. F. Liu, F. H. Wang, Y. H. Cao, M. X. Gao, H. G. Pan and Q. D. Wang, Energy Environ. Sci., 2010, 3, 645 RSC.
- (a) X. D. Yao, C. Z. Wu, A. J. Du, J. Zou, Z. H. Zhu, P. Wang, H. M. Cheng, . S. Smith and G. Q. Lu, J. Am. Chem. Soc., 2007, 129, 15650 CrossRef CAS; (b) Z. Z. Fang, X. D. Kang, P. Wang and H. M. Cheng, J. Phys. Chem. C, 2008, 112, 17023 CrossRef CAS.
Footnote |
| † Electronic Supplementary Information (ESI) available. See DOI: 10.1039/c1ra00645b/ |
| This journal is © The Royal Society of Chemistry 2012 |
