Synthesis of WO3@Graphene composite for enhanced photocatalytic oxygen evolution from water
Jingjing
Guo
a,
Yao
Li
a,
Shenmin
Zhu
*a,
Zhixin
Chen
b,
Qinglei
Liu
a,
Di
Zhang
*a,
Won-Jin
Moon
c and
Deok-Min
Song
c
aState Key Laboratory of Metal Matrix Composites, Shanghai Jiao Tong University, 800 Dongchuan Road, Shanghai, 200240, P. R. China. E-mail: smzhu@sjtu.edu.cn, zhangdi@sjtu.edu.cn; Tel: +86-21-34202584; Fax: +86-21-34202749
bFaculty of Engineering, University of Wollongong, Wollongong, NSW 2522, Australia
cGwang ju Center, Korea Basic Science Institute Chonnam National University, 300 YongBong-Dong, Buk-Gu, Gwang ju 500-757, Korea
First published on 15th December 2011
Abstract
Nano tungsten oxide (WO3) particles were synthesized on the surface of graphene (GR) sheets by using a simple sonochemical method. The obtained composite, WO3@GR, was characterized by X-ray diffraction, N2adsorption/desorption analysis, thermo-gravimetric analysis, Raman spectroscopy and UV-vis diffuse reflectance spectra measurements. It was found that chemical bonds between the nano WO3 particles and the GR sheets were formed. The average particle size of the WO3 was evidenced to be around 12 nm on the GR sheets. When used as photocatalyst for water splitting, the amount of evolved O2 from water for the WO3@GR composite with 40 wt% GR inside was twice and 1.8 times as much as that for pure WO3 and mixed-WO3/GR, respectively. The excellent photocatalytic property of the WO3@GR composite is due to the synergistic effects of the combined nano WO3 particles and GR sheets. The sensitization of WO3 by GR enhances the visible light absorption property of WO3@GR. The chemical bonding between WO3 and GR minimizes the interface defects, reducing the recombination of the photo-generated electron–hole pairs. Furthermore, the GR sheets in the WO3@GR composite enhance electrons transport by providing low resistance conduction pathways, leading to improved photo-conversion efficiency. The methodology opens up a new way of obtaining photoactive GR-semiconductor composites for photodissociating water under visible light.
Introduction
Recently, great interest has been focused on semiconductor photocatalysis utilizing solar energy to photodissociate water.1–5 Solar photolysis of water is one of the cleanest ways of producing hydrogen and oxygen, which has great potential in solving energy problem. As a semiconductor for spontaneous photolysis, three main thermodynamic requirements should be fulfilled: (1) its band gap must be higher than water decomposition voltage (1.23 eV); (2) its band edge positions must straddle the hydrogen and oxygen redox potential, and (3) it must be stable against photo corrosion during photocatalysis. Accordingly, semiconductors including TiO2, WO3, Bi2WO6, ZnO, Bi2O3 and CdS etc. have been reported to be used in water splitting to produce hydrogen or oxygen.6–12 Among them, TiO2 is the most extensively studied photocatalyst for its low toxicity, long-term thermodynamic stability, high photostability, and high efficiency.5,12,13 Unfortunately, TiO2 is only active in the ultraviolet light range due to its wide band gap (3.2 eV), result in utilizing only 5% of the total solar spectrum.Nanostructured tungsten trioxide (WO3), as one of the n type semiconductors with a band gap of 2.8 eV, has attracted a lot of interests in photocatalysis because of its strong adsorption within the solar spectrum (≤ 500 nm), stable physicochemical properties as well as its resilience to photo corrosions.7,14–16 Under the irradiation of visible light, photoinduced electrons and holes can be produced in the conduction band and valence band of WO3, respectively. The photo generated holes can be used to drive the water-splitting reaction to produce oxygen. Generally, nanocrystalline semiconductors have poor charge mobility and thus produce very limited photocurrent.5,17,18 The poor mobility combined with inherently slow water oxidation reactions often results in the high degree of electron and hole recombination either with the defect and trap states or within grain boundaries, which diminishes the efficiency of the photocatalytic reaction significantly. This is one of the biggest obstacles hindering the development of WO3 as a practical photocatalyst.2,19 One possible technique of improving the efficiency of electron–hole pair separation in WO3 is to dope WO3 with other elements or compound (Ag, C, S, P, and TiO2).1,2,19–22 In 2010, Sun et al. reported that Ag doped mesoporous WO3, exhibited excellent photocatalytic decomposition of acetaldehyde under visible-light irradiation.1 It has been reported that carbon doping enhances charges exchange rate and thus improves the photocatalytic activity of WO3.2 Furthermore doping may also reduce the band gap of WO3 and improves its photocatalytic efficiency, for instance the band gap of WO3 nanowire array reduced from 2.8 to 2.2 eV after nitridation in a NH3 atmosphere.19
Graphene (GR), with a flat monolayer of carbon atoms tightly packed into a two-dimensional honeycomb lattice, is a very promising candidate for high performance photocatalyst because of its high thermal conductivity,23 excellent mobility of charge carriers (20![[thin space (1/6-em)]](https://www.rsc.org/images/entities/char_2009.gif) 000 cm2 V−1 s−1 at room temperature),24 and a large specific surface area (2630 m2 g−1).25 The combination of GR with a well photocatalytic semiconductor is expected to result in a high performance in photocatalytic activity. Recently, there are many reports concerning about incorporation of metal oxide (TiO2, Sr2Ta2O7 and ZnO, etc.) on GR sheets to obtain composite photocatalysts.18,26,27 It has been shown that GR in the composites could act as electronic conductive channels to improve the electrochemical performance. From the point view of photo-conversion efficiency, the photocatalytic properties of semiconductor could be further enhanced if the recombination of the photoinduced electron–hole pairs can be effectively suppressed. Therefore, the composite consisted of nano WO3 particles and two-dimensional GR sheets is a promising photocatalyst for oxygen production because GR can act as an electron transfer channel thus reducing the recombination of the photo-generated electron holes and leading to improved photo-conversion efficiency.3,5,18 Up to now, no investigation concerning about nano WO3 particles on GR sheets for water splitting has been reported. To the best of our knowledge, only one paper concerning about the mixture of WO3 powder and graphene oxide (GO) for in situreduction under visible light was reported by Nget al. But the WO3 particle sizes were really large up to 100 nm and tended to aggregate during the physical mixing.28 How to control the synthesis of crystalline WO3 nanoparticles uniformly on the surface of the GR sheet is critically important. The crystallinity and the particle size of the photocatalyst are two important factors of affecting the photocatalytic activity.6,29–31
000 cm2 V−1 s−1 at room temperature),24 and a large specific surface area (2630 m2 g−1).25 The combination of GR with a well photocatalytic semiconductor is expected to result in a high performance in photocatalytic activity. Recently, there are many reports concerning about incorporation of metal oxide (TiO2, Sr2Ta2O7 and ZnO, etc.) on GR sheets to obtain composite photocatalysts.18,26,27 It has been shown that GR in the composites could act as electronic conductive channels to improve the electrochemical performance. From the point view of photo-conversion efficiency, the photocatalytic properties of semiconductor could be further enhanced if the recombination of the photoinduced electron–hole pairs can be effectively suppressed. Therefore, the composite consisted of nano WO3 particles and two-dimensional GR sheets is a promising photocatalyst for oxygen production because GR can act as an electron transfer channel thus reducing the recombination of the photo-generated electron holes and leading to improved photo-conversion efficiency.3,5,18 Up to now, no investigation concerning about nano WO3 particles on GR sheets for water splitting has been reported. To the best of our knowledge, only one paper concerning about the mixture of WO3 powder and graphene oxide (GO) for in situreduction under visible light was reported by Nget al. But the WO3 particle sizes were really large up to 100 nm and tended to aggregate during the physical mixing.28 How to control the synthesis of crystalline WO3 nanoparticles uniformly on the surface of the GR sheet is critically important. The crystallinity and the particle size of the photocatalyst are two important factors of affecting the photocatalytic activity.6,29–31
Herein, we report for the first time the synthesis of a composite (WO3@GR) consisting of WO3 nanoparticles and GR sheets. The structures and morphologies of the composite were characterized by using a variety of measurements. The photocatalytic oxygen evolution properties of the WO3@GR composite was investigated by measuring the amount of oxygen evolved from water splitting and compared with those of pure GR, WO3 and the mixture of WO3 and GR (mixed-WO3/GR).
Experimental
Preparation of GR
GR was obtained by chemical reduction of GO which was prepared from natural graphite (crystalline, 300 mesh, Alfa Aesar) by a modified Hummers method.32 The details of the preparation of the GO were described in our previous article.33 In a typical reduction experiment, 0.5 g of GO powder was dispersed in 150 ml of deionized water and the mixture was sonicated for 1 h. Next, 18 ml of hydrazine (85%) was added under magnetic stirring, and the mixture was continuously stirred at 50 °C for 24 h. Finally, black GR powder was obtained by filtration and drying under vacuum at 60 °C.Preparation of WO3@GR
WO3@GR composite was synthesized by sonochemical reaction of phosphotungstic acid (AR, Sinopharm) in the presence of GO. The process of preparing WO3@GR composite is described as follows: 0.50 g of GO was added to 20 ml of H2O and stirred for 12 h under magnetic vigorous stirring at ambient temperature. As the reaction progressed, GO was dissolved in the water, while the mixture gradually became pasty and the color turned into light brownish. At the same time, 1.2 g of phosphotungstic acid and 10 ml ethanol were mixed uniformity, and slowly added to the above GO mixture. Finally the suspension was sonicated at room temperature for 3 h using a high-intensity ultrasonic probe (Ti horn, 20 kHz, 100 W cm−2). The resulting composite was recovered by centrifugation and rinsed with ethanol solvent and H2O several times, then dried under vacuum at 60 °C to obtain amorphous WO3 and GR composite (A-WO3@GO). After calcination at 550 °C for 3 h under nitrogen, black crystallized WO3@GR composite was obtained.For comparison, pure WO3 powders were also prepared under the same condition without adding GO precursor in the process, and the mixed-WO3/GR was prepared by mechanical mixing of pure WO3 and GR, with the same composition as that in the WO3@GR composite.
Characterization
The synthesized samples were characterized by X-ray diffraction (XRD) using a RigakuD/max2550VL/PC system operated at 40 kV and 40 mA with Cu-Kα radiation (λ = 1.5406 Å), at a scan rate of 5° min−1 and a step size of 0.050° in 2θ. Nitrogen adsorption measurements at 77 K were performed using an ASAP2020 volumetric adsorption analyzer, after the samples had been outgassed for 8 h in the degas port of the adsorption apparatus. Field-emission scanning electron microscopy (FE-SEM) was performed on a JEOL JSM-6360LV field emission microscope at an accelerating voltage of 15 kV. Transmission electron microscopy (TEM) and energy-dispersive X-ray measurements (EDX) were carried out on a JEOL 2010 microscope at 200 kV. TEM specimens were prepared by grinding the synthesized samples into powder with a mortar and pestle and the powder was dispersed in pure ethanol and picked up with holey carbon supporting films on copper grids. A Dilor LABRAM-1B microspectrometer with 633 nm laser excitation was used to record the Raman spectrum of the samples. Fourier transform-infrared measurements (FT-IR) were recorded on KBr pellets with a PE Paragon 1000 spectrophotometer. Thermal gravimetric analysis (TGA) was conducted on a PE TGA-7 instrument with a heating rate of 20 °C min−1. Diffuse reflectance electronic spectra (DRS) were measured with a Perkin–Elmer 330 spectrophotometer equipped with a 60 mm Hitachi integrating sphere accessory.Photocatalytic oxygen evolution experiments
Photocatalytic oxidation reactions were conducted at ca. 20 °C in a Lab Solar gas photocatalysis system with external light irradiation. The light source was a 300 W high pressure integrated type xenon lamp (PLS-SXE300/300UV, China). Before the photochemical reaction, 60 ml of ultra-pure water was degassed by boiling it for 30 min and cooling to room temperature, and then added it to the reactor. Then 0.05 g of the photocatalyst (GR, WO3@GR, WO3 and Mixed-WO3/GR) and 10 ml of 16.0 mmol l−1Fe2(SO4)3 were added to the reactor in tandem under magnetic vigorous stirring to ensure the mixture suspense, using H2SO4 solution to adjust the pH of the mixture at 2. During the experiment, the reactor system was filled with flowing temperature-controlled cooling water. The amount of O2 evolved was determined using gas chromatography (GC7890II, thermal conductivity detector, nitrogen carrier gas).Results and discussions
The preparation process of the WO3@GR composite is illustrated schematically in Scheme 1. After the dispersion of GO in the aqueous solution, phosphotungstic acid in ethanol was added under continuous stirring. Then the mixture was under ultrasonication for 3 h to fabricate WO3 on the GO sheets (A-WO3@GO). The crystallization of the amorphous WO3 particles and the reduction of the GO to GR were achieved by the calcination of A-WO3@GO at 550 °C for 3 h under nitrogen. | ||
| Scheme 1 Synthetic procedure for the preparation of WO3@GR composite. | ||
Wide-angle XRD patterns of the pure WO3 powder, A-WO3@GO and WO3@GR are compared as shown in Fig. 1. The pure WO3 sample is well crystallized in a single phase and all of the diffraction peaks can be indexed to monoclinic WO3 (JCPDF 43-1035). As for the A-WO3@GO composite, two broad peaks located at 2θ = 26.4°, 10.6° were detected, corresponding to graphite carbon and GO with interlayer spacing of 0.34 nm and 1.02 nm, respectively.34 A small peak at 19.5° is assigned to the residual intermediate of phosphotungstic acid (JCPDF 53-1015). No characteristic peaks of WO3 were presented in the A-WO3@GO composite before calcination. After calcination at 550 °C, the diffraction peaks which can be indexed to cubic WO3 (JCPDF 20-1324) appeared, indicating the crystalline WO3 formed on the GR sheets. Compared with that of A-WO3@GO, the peak of carbon in WO3@GR located at 26.4° became distinguished, suggesting the possible reduction of GO to GR occurred during the heat treatment process. This is consistent with the disappearance of the small peak at 2θ = 10.6° in the XRD pattern of WO3@GR, attributed to the GO in A-WO3@GO. The average particle size of the WO3 in WO3@GR can be estimated to be around 12 nm by applying the Scherrer formula.35 This result suggests that the growth of nanocrystalline WO3 on the GR sheets was very limited and controlled, which will be further confirmed by TEM.
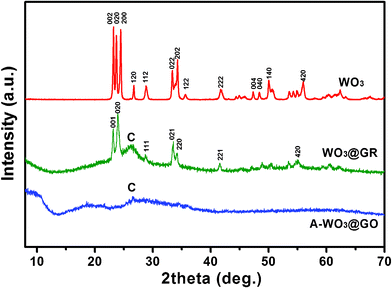 | ||
| Fig. 1 XRD of WO3, A-WO3@GO and WO3@GR. | ||
Fig. 2 shows the TGA of GR and WO3@GR in air by heating up from 40 to 900 °C. The largest weight loss occurs at temperatures from 530 to 690 °C for both GR and WO3@GR, due to the destruction of the carbon skeleton (carbonyl/double bond). The weight loss of WO3@GR was stabilized at about 40% at temperatures between 690 and 900 °C, which indicates that the amount of WO3 loaded on the GR sheets was about 60 wt%. It is worth mentioning that a weight loss of 15 wt% was observed from 150 to 530 °C for GR, owing to the pyrolysis of the residual hydroxyl group on the surface of GR. Unlike the pure GR sample, only one large weight loss peak at 600 °C was observed for the WO3@GR, illustrating that the WO3 was most likely located on the surface of the supporting GR sheets and didn't form as separate material.
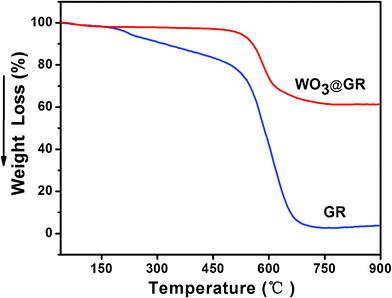 | ||
| Fig. 2 TGA curves of GR and WO3@GR (heating rate = 20 °C min−1 under air atmosphere). | ||
Fig. 3 shows a selected region of the Raman spectra of the pure WO3, GR as well as WO3@GR. As is expected, GR has two peaks at around 1350 and 1595 cm−1.17 The G-band peak at around 1595 cm−1 is characteristic of graphitic sheets, corresponding to a well defined sp2carbon-type structure.36 Whereas, the D-band at around 1350 cm−1 can be attributed to the presence of defects within the hexagonal graphitic structure.37 Thus a smaller ID/IG peak intensity ratio of a Raman spectrum indicates lower defects and disorders of the graphitized structures. Similar peaks at D-band (1366 cm−1) and G-band (1640 cm−1) are also observed in the WO3@GR composite. From the spectra in Fig. 3, we can see that the ID/IG ratio decreases from 1.16 for the GR sheets to 0.75 for the WO3@GR composite. The higher ID/IG ratio of the GR is probably due to the formation of large number of multilayered GR (thin graphite) through GR restacking. The GR restacking in the WO3@GR composite would be much reduced because the GR surfaces were coated with WO3. Consequently the WO3@GR composite has less lattice defects than the GR reduced from the GO. The smaller number of the defects will benefit to the photocatalytic activity of the WO3@GR composites because these lattice defects normally act as recombination centers for the photo-generated electrons and holes. Moreover, Raman vibrations centered at 129, 276, 709, 801 cm−1 characteristic of pure WO3 were also detected in the sample of WO3@GR composite. These bands are due to the stretching mode O–W–O. Compared with that of the pure WO3 powder, the band at 709 cm−1 attributed to W![[double bond, length as m-dash]](https://www.rsc.org/images/entities/char_e001.gif) O bonds was broadened and shifted to 678 cm−1 for the WO3 in the WO3@GR composite, probably because the formation of C–O–W bonds makes the initial W
O bonds was broadened and shifted to 678 cm−1 for the WO3 in the WO3@GR composite, probably because the formation of C–O–W bonds makes the initial W![[double bond, length as m-dash]](https://www.rsc.org/images/entities/char_e001.gif) O bond weaker and a similar phenomena has been reported elsewhere.38 This means that WO3 was grafted onto the surface of GR layer via C–O–W bonds rather physically adsorbed on the GR sheets. This kind of structure is desirable for charge transfer upon light excitation.39 It is worth noting that a G-band up-shift from 1595 to 1604 cm−1 was observed for WO3@GR compared with GR. This G-band up-shift is generally an evidence of chemical doping of carbon materials. The trend was similar to previous studies with the p-type doping of the GR causing up-shift of the G-band.40 The Raman G-band shift provides reliable evidence of charge transfer between the GR sheets and the WO3 in the WO3@GR composite and suggests a dyadic bonding between the GR and WO3.
O bond weaker and a similar phenomena has been reported elsewhere.38 This means that WO3 was grafted onto the surface of GR layer via C–O–W bonds rather physically adsorbed on the GR sheets. This kind of structure is desirable for charge transfer upon light excitation.39 It is worth noting that a G-band up-shift from 1595 to 1604 cm−1 was observed for WO3@GR compared with GR. This G-band up-shift is generally an evidence of chemical doping of carbon materials. The trend was similar to previous studies with the p-type doping of the GR causing up-shift of the G-band.40 The Raman G-band shift provides reliable evidence of charge transfer between the GR sheets and the WO3 in the WO3@GR composite and suggests a dyadic bonding between the GR and WO3.
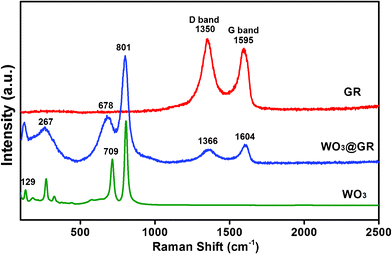 | ||
| Fig. 3 Raman spectra of pure WO3, GR and WO3@GR. | ||
The interaction between the WO3 and GR was also confirmed by FT-IR spectroscopy as shown in Fig. 4. C–O functionalities such as COOH (1724.8 cm−1) and C–OH (1045.3 cm−1) are clearly visible in the GO. The spectrum also shows a C![[double bond, length as m-dash]](https://www.rsc.org/images/entities/char_e001.gif) C peak at 1606.3 cm−1 corresponding to the remaining sp2 character. As for A-WO3@GO, the broad absorptions at low frequencies were ascribed to the vibration of W–O–W bond (below 1000 cm−1) which was not observed in the spectrum of GO. It was found that the peak of the C–OH at 1045.3 cm−1 for GO shifted to a higher wave number of 1079 cm−1 for A-WO3@GO, which could be explained by the influence of the formation of C–O–W bond.
C peak at 1606.3 cm−1 corresponding to the remaining sp2 character. As for A-WO3@GO, the broad absorptions at low frequencies were ascribed to the vibration of W–O–W bond (below 1000 cm−1) which was not observed in the spectrum of GO. It was found that the peak of the C–OH at 1045.3 cm−1 for GO shifted to a higher wave number of 1079 cm−1 for A-WO3@GO, which could be explained by the influence of the formation of C–O–W bond.
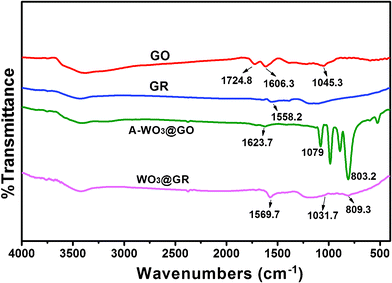 | ||
| Fig. 4 FT-IR spectra of GO, GR, A-WO3@GO and WO3@GR. | ||
SEM images of GR, A-WO3@GO and WO3@GR are shown in Fig. 5. The pure GR has a layered structure with a very smooth surface (Fig. 5a and b), while the A-WO3@GO and WO3@GR composite shows a mass of wrinkles (Fig. 5c–f). The layered structure of the GR sheets in the WO3@GR composite exhibits nanoscale textures, indicative of a much rougher surface. In addition a large amount of WO3 nanoparticles were observed clearly dispersion on both the GR surface and the interlayers without apparent agglomeration (Fig. 5e). Fig. 5f shows that the particle size is very uniform with tens nanometres in diameters, illustrating that ultrasonic sound irradiation is an effective method of fabricating WO3 nanoparticles on the GR surface.
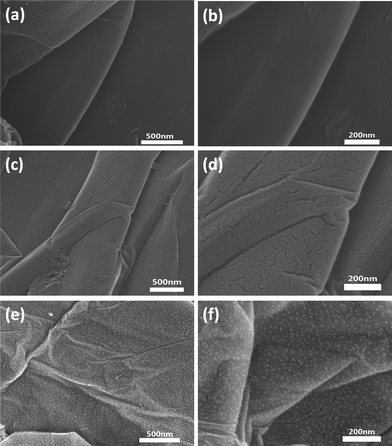 | ||
| Fig. 5 FE-SEM images of GR (a, b), A-WO3@GO (c, d) and WO3@GR (e, f) in different magnifications. | ||
The structures and composition of the WO3@GR composite were further characterized by using TEM and EDX, and the results are shown in Fig. 6. From the low-resolution TEM (Fig. 6a), it can be seen there are plenty of wrinkles on the clean sheet owing to the two-dimensional nature of the matrix sheet. From the high resolution image, discrete and well defined WO3 particles are uniformly scattered on the sheets with the particle size of around 12 nm (Fig. 6b). This observation is consistent with the wide angle XRD results presented in Fig. 1. As demonstrated in Fig. 6c, the measured lattice-fringe spacing of 0.34 nm in the ribbons was detected corresponding to the (001) of the GR sheets; and the measured lattice fringe spacing of 0.36 nm in WO3@GR composites corresponds to the (020) of cubic WO3 (JCPDF 20-1324). Fig. 6 shows the EDX spectrum from the area shown in Fig. 6c. The TEM results provide the direct evidence of WO3 nanoparticles on the surface of GR sheets.
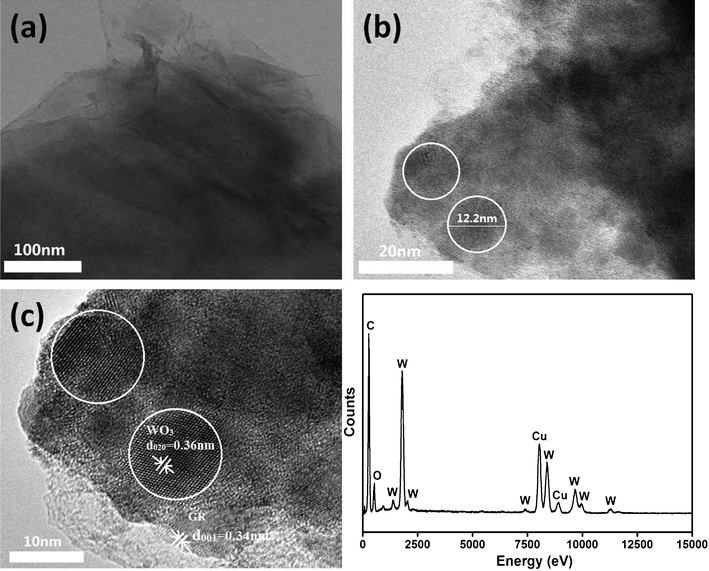 | ||
| Fig. 6 TEM images of WO3@GR in different resolutions (a, b, and c) and EDX images. | ||
N2 adsorption/desorption isotherms of the samples WO3 and WO3@GR have been measured and are shown in Fig. 7. Both of the WO3 and WO3@GR samples show similar isotherm curves. The WO3 sample has a specific surface area of 7.29 m2g−1 according to the BET (Brunauer, Emmett and Teller) analysis and the specific surface area of the WO3@GR samples is 20.72 m2g−1. The increase of the surface area can be explained by the special structure of GR which has ordered two-dimensional honeycomb lattice and a large specific surface area (GR, 66.35 m2g−1).
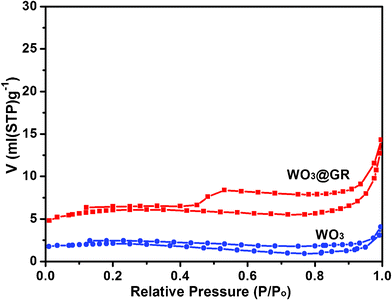 | ||
| Fig. 7 N2 adsorption/desorption isotherms of samples WO3 and WO3@GR. | ||
The light-absorbance properties of the pure WO3, GR and WO3@GR composite were studied with a UV-vis spectrophotometer and the obtained spectra are shown in Fig. 8. Both the GR and WO3@GR show a similar spectrum shape with strong adsorption from UV to visible light region because their similar black appearance. At a wavelength above 500 nm the pure WO3 has a much weaker absorption and different shape in comparison with those of the GR and WO3@GR samples. As shown in Fig. 8, the light absorption intensity of WO3@GR is stronger than that of GR due to the presence of 60 wt% WO3 in the WO3@GR composite. At the same time, the light absorption intensity of WO3@GR is also much stronger than that of WO3 in visible light range resulting from the existence of 40 wt% GR in the WO3@GR composite. DRS demonstrate the synergistic effect of GR and WO3 contributed to an improved light harvesting property. This is expected to result in an improved photocatalytic activity over the complete spectral range.
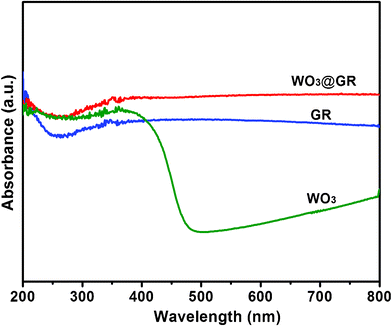 | ||
| Fig. 8 Diffuse reflectance electronic spectra of pure WO3, GR and WO3@GR. | ||
The photocatalytic activities of the WO3@GR, pure GR, pure WO3 and mixed-WO3/GR in terms of O2 generation from water were measured using a Lab Solar gas photocatalysis system with external light irradiation and the results are shown in Fig. 9. In order to remove the gas dissolved in water, before the photochemical reaction, ultra-pure water was boiled for 30 min and cooled to room temperature. Fig. 9 shows the amount of evolved O2 of photocatalyst (GR, WO3, mixed-WO3/GR and WO3@GR) by solar light from an aqueous solution containing the Fe3+ ion as an electron acceptor. The amount of evolved O2 from the aqueous solution after 9 h for the WO3@GR was ca. 388 μmol L−1, which is more than 1.8 times and twice as much as that of the mixed-WO3/GR (ca. 214 μmol L−1) and WO3 (ca.186 μmol L−1), respectively.
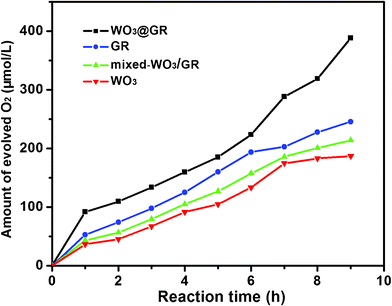 | ||
| Fig. 9 Time course of O2 evolution from the solution with suspended photocatalyst (WO3, GR, mixed-WO3/GR and WO3@GR) under xenon lamp irradiation. | ||
In our photocatalytic oxygen evolution experiments, illumination photons create electron-hole pairs in the WO3 at the solid-solution interface (eqn 1). These electron-hole pairs separate and reach to the photocatalyst surface by diffusion. WO3 is photocatalyst with weak reducing power owing to their positive conduction band position (> 0 eV vs.NHE at pH = 0), which prohibits the electron transfer to reduce H2O to H2.41 Therefore, only holes reaction with water to produce O2 can occur spontaneously by using these photocatalyst (eqn 2). However, electron-hole pairs are very easily to recombine either with defect and trap states or within grain boundaries quickly, which diminishes the efficiency of the photocatalytic reaction significantly. Generally, a scavenger is used to reduce the recombination of electron–hole pairs in order to enhance charge transport rate and improve photocatalytic activity. Here, Fe2(SO4)3 was used as the scavenger. The Fe3+ ion would react with photo-induced electrons as an electron acceptor to reduce the recombination of electron–hole pairs (eqn 3).
 | (1) |
| 2H2O + 4h+ → 4H+ + O2 | (2) |
| 4Fe3+ + 4e− → 4Fe2+ | (3) |
The total equation for the photocatalytic O2 production may be summarized in the following:
It should be noted that the amount of evolved O2 from mixed-WO3/GR (60 wt% WO3 and 40 wt% GR) was measured about 214 μmol L−1, which was much lower than that from the obtained WO3@GR composite (388 μmol L−1). The difference could be mainly due to the structure of the WO3@GR composite. The chemical bonds (C–O–W etc.) between WO3 and GR sheets suggested by the shift of Raman peak and FT-IR (Fig. 3 and Fig. 4), which do not only enhance the optical adsorption by sensitizing the WO3 in visible light, but also significantly enhance charge separation efficiency and carrier transfer rate. A similar phenomenon has also been observed by Zhao et al. in the carbon@TiO2 with a “dyade” structure.5 The enhanced visible-light absorption was explained as the surface nanometre carbon materials which can show collective polarization modes and sensitize semiconductors.
GR has a charge-carrier mobility of 20![[thin space (1/6-em)]](https://www.rsc.org/images/entities/char_2009.gif) 000 cm2 V−1 s−1, so it is very possible that the incorporation of GR might enhance the charge separation efficiency and suppress the charge recombination as suggested by Scheme 2. Under visible light illumination, electrons in the valence band (VB) acquire enough energy and jump into the conduction band (CB) of WO3, leaving positive charged holes in the VB. GR with a two-dimensional conjugated π–π graphitic carbon network and superior electrical conductivity could efficiently transfer the photo-generated electrons away from the WO3. Finally, the electrons were quickly scavenged by the electron acceptor of Fe3+ in the solution,42 while the holes in the VB reacted with H2O to produce O2. Thus GR served as an acceptor of the CB electrons of the WO3 and effectively suppressed the charge recombination in WO3@GR sample, leaving more positive charged holes on the WO3 surface and thus promoting the production of oxygen.43,44
000 cm2 V−1 s−1, so it is very possible that the incorporation of GR might enhance the charge separation efficiency and suppress the charge recombination as suggested by Scheme 2. Under visible light illumination, electrons in the valence band (VB) acquire enough energy and jump into the conduction band (CB) of WO3, leaving positive charged holes in the VB. GR with a two-dimensional conjugated π–π graphitic carbon network and superior electrical conductivity could efficiently transfer the photo-generated electrons away from the WO3. Finally, the electrons were quickly scavenged by the electron acceptor of Fe3+ in the solution,42 while the holes in the VB reacted with H2O to produce O2. Thus GR served as an acceptor of the CB electrons of the WO3 and effectively suppressed the charge recombination in WO3@GR sample, leaving more positive charged holes on the WO3 surface and thus promoting the production of oxygen.43,44
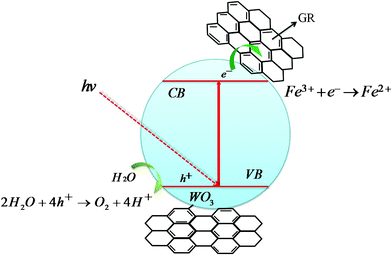 | ||
| Scheme 2 The procedure of photocatalytic oxidation for the WO3@GR composite. | ||
Zhang et al. reported that the photocatalytic activity would decrease distinctly with the content of GR exceeding 5 wt% in GR/TiO2 composite by introducing electron-hole recombination centers into the composite.18 Surprisingly, in our case the percentage of GR in WO3@GR nanocomposite reached as high as 40 wt%, it still showed an enhanced photocatalytic activity (Fig. 9). It could be explained by the bonds between the GR and WO3 in the WO3@GR composite. Carboxylic species of the GO interacting with the precursor of the WO3 particles enable the dispersion and adhesion of particles onto the GO as suggested by Raman and FT-IR measurements. The close contact and bonds would enable easy charge transfer between the WO3 particles and GR sheets. As evidenced by the ID/IG ratios in the Raman spectra, the GR in WO3@GR composite contains less lattice defects than the stand alone GR so that the electron-hole recombination rate would be much lower for the WO3@GR composite. In Zhang's case, there is no chemical bond between the mixed GR and powder TiO2 so that the interface boundaries become the recombination centers for electrons and holes.
Furthermore, the crystallinity and the particle size of the photocatalyst are also important factors to the photocatalytic activity.6,30,31 The higher the crystalline quality of the WO3 is, the less amount of defects it has. Defects can operate as recombination centers between the CB electrons and VB holes and reduce the photocatalytic activity. The smaller the particle size is, the shorter time need for electron-hole pairs moving from inner to surface, which will decrease the electron-hole pairs recombination and enhance the photocatalytic activity. Clearly the photocatalytic activity of the WO3@GR composites is much better than both the pure WO3 and the mixed-WO3/GR due to the synergistic effects from WO3 and GR in the photocatalytic process.
The same process has been extended to the fabrication of Bi2WO6 on the surface of GR sheets (GR-Bi2WO6-T). As is expected, the combination of functionality of Bi2WO6 with the unique properties of GR results in an improved performance in O2 production from water splitting (Fig. 10). Therefore, this methodology opens up a new way of obtaining photoactive GR-semiconductor composites for photodissociating water under visible light.
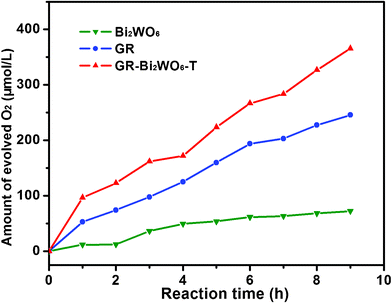 | ||
| Fig. 10 Time course of O2 evolution from the solution with suspended photocatalyst (Bi2WO6, GR and GR-Bi2WO6-T) under xenon lamp irradiation. | ||
Conclusions
WO3@GR composite, a visible light photocatalyst, was successfully synthesized using a sonochemical method in a short time. SEM and TEM provided direct evidence that a fine and uniform distribution of WO3 nanoparticles formed on the surface of GR sheets. The average particle size of the WO3 was controlled at around 12 nm on the GR sheets without using any surfactant. When used as photocatalyst for water splitting, the amount of evolved O2 from WO3@GR with 40 wt% GR inside is much higher than that of pure WO3 and mixed-WO3/GR, 1.8 times and 2 times as much as that from mixed-WO3/GR (ca. 214 μmol L−1) and pure WO3 (ca.186 μmol L−1), respectively. The improved performance is due to the synergistic effects of chemically bonded WO3 and GR. The sensitization of WO3 by GR enhanced the visible light absorption property of WO3@GR. The chemical bonding between WO3 and GR reduced the recombination of the photo-generated electron–hole pairs, leading to improved photo-conversion efficiency. This simple strategy opens up a new way to design more optimized systems for photodissociating water under visible light.Acknowledgements
The authors gratefully acknowledge the financial support of this research by the National Science Foundation of China (Nos. 51072117, 50772067, 51131004, 51171110, 2012CB619600), Shanghai Science and Technology Committee (No. 10JC1407600), and Sino-French Project of MOST of China (No. 2009DFA52410), Shanghai Jiao Tong University Innovation Fund for Postgraduates and KBSI grant (T31903) to W.-J. Moon. We also thank SJTU Instrument Analysis Center for the measurements.References
- S. M. Sun, W. Z. Wang, S. Z. Zeng, M. Shang and L. Zhang, J. Hazard. Mater., 2010, 178, 427 CrossRef CAS.
- H. T. Zheng and M. Mathe, Int. J. Hydrogen Energy, 2011, 36, 1960 CrossRef CAS.
- H. Zhang, X. J. Lv, Y. M. Li, Y. Wang and J. H. Li, ACS Nano, 2010, 4, 380 CrossRef CAS.
- J. He, Q. Z. Cai, Q. Luo, D. Q. Zhang, T. T. Tang and Y. F. Jiang, Korean J Chem Eng, 2010, 27, 435 CAS.
- L. Zhao, X. F. Chen, X. C. Wang, Y. J. Zhang, W. Wei, Y. H. Sun, M. Antonietti and M. M. Titirici, Adv. Mater., 2010, 22, 3317 CrossRef CAS.
- Z. K. Cui, D. W. Zeng, T. T. Tang, J. Liu and C. S. Xie, J. Hazard. Mater., 2010, 183, 211 CrossRef CAS.
- Z. G. Zhao and M. Miyauchi, Angew. Chem., Int. Ed., 2008, 47, 7051 CrossRef CAS.
- T. F. Jaramillo, S. H. Baeck, A. Kleiman-Shwarsctein and E. W. McFarland, Macromol. Rapid Commun., 2004, 25, 297 CrossRef CAS.
- Y. F. Qiu, M. L. Yang, H. B. Fan, Y. Z. Zuo, Y. Y. Shao, Y. J. Xu, X. X. Yang and S. H. Yang, CrystEngComm, 2011, 13, 1843 RSC.
- L. Zhou, W. Z. Wang, H. L. Xu, S. M. Sun and M. Shang, Chem.–Eur. J., 2009, 15, 1776 CrossRef CAS.
- M. Ikeda, Y. Kusumoto, S. Somekawa, P. Ngweniform and B. Ahmmad, J. Photochem. Photobiol., A, 2006, 184, 306 CrossRef CAS.
- T. Maschmeyer and M. Che, Angew. Chem., Int. Ed., 2010, 49, 1536 CrossRef CAS.
- N. L. Wu, M. S. Lee, Z. J. Pon and J. Z. Hsu, J. Photochem. Photobiol., A, 2004, 163, 277 CrossRef CAS.
- Y. F. Guo, X. Quan, N. Lu, H. M. Zhao and S. Chen, Environ. Sci. Technol., 2007, 41, 4422 CrossRef CAS.
- J. G. Yu, L. F. Qi, B. Cheng and X. F. Zhao, J. Hazard. Mater., 2008, 160, 621 CrossRef CAS.
- G. R. Bamwenda and H. Arakawa, Appl. Catal., A, 2001, 210, 181 CrossRef CAS.
- E. P. Gao, W. Z. Wang, M. Shang and J. H. Xu, Phys. Chem. Chem. Phys., 2011, 13, 2887 RSC.
- X. Y. Zhang, H. P. Li, X. L. Cui and Y. H. Lin, J. Mater. Chem., 2010, 20, 2801 RSC.
- V. Chakrapani, J. Thangala and M. K. Sunkara, Int. J. Hydrogen Energy, 2009, 34, 9050 CrossRef CAS.
- B. W. Mwakikunga, A. Forbes, E. Sideras-Haddad, M. Scriba and E. Manikandan, Nanoscale Res. Lett., 2010, 5, 389 CrossRef CAS.
- L. F. Cheng, X. T. Zhang, B. Liu, H. Z. Wang, Y. C. Li, Y. B. Huang and Z. L. Du, Nanotechnology, 2005, 16, 1341 CrossRef CAS.
- L. L. Cao, J. Yuan, M. X. Chen and W. F. Shangguan, J. Environ. Sci., 2010, 22, 454 CrossRef CAS.
- A. K. Geim and K. S. Novoselov, Nat. Mater., 2007, 6, 183 CrossRef CAS.
- A. Dato, V. Radmilovic, Z. H. Lee, J. Phillips and M. Frenklach, Nano Lett., 2008, 8, 2012 CrossRef CAS.
- A. A. Balandin, S. Ghosh, W. Z. Bao, I. Calizo, D. Teweldebrhan, F. Miao and C. N. Lau, Nano Lett., 2008, 8, 902 CrossRef CAS.
- O. Akhavan, ACS Nano, 2010, 4, 4174 CrossRef CAS.
- A. Mukherji, B. Seger, G. Q. Lu and L. Z. Wang, ACS Nano, 2011, 5, 3483 CrossRef CAS.
- Y. H. Ng, A. Iwase, N. J. Bell, A. Kudo and R. Amal, Catal. Today, 2011, 164, 353 CrossRef CAS.
- K. Sayama, H. Hayashi, T. Arai, M. Yanagida, T. Gunji and H. Sugihara, Appl. Catal., B, 2010, 94, 150 CrossRef CAS.
- J. H. Li, W. L. Kang, X. Yang, X. D. Yu, L. L. Xu, Y. H. Guo, L. B. Fang and S. D. Zhang, Desalination, 2010, 255, 107 CrossRef CAS.
- R. Y. Zheng, Y. Guo, C. Jin, J. L. Xie, Y. X. Zhu and Y. C. Xie, J. Mol. Catal. A: Chem., 2010, 319, 46 CrossRef CAS.
- M. Hirata, T. Gotou, S. Horiuchi, M. Fujiwara and M. Ohba, Carbon, 2004, 42, 2929 CAS.
- J. Guo, S. Zhu, Z. Chen, Y. Li, Z. Yu, Q. Liu, J. Li, C. Feng and D. Zhang, Ultrason. Sonochem., 2011, 18, 1082 CrossRef CAS.
- R. Bissessur, P. K. Y. Liu and S. F. Scully, Synth. Met., 2006, 156, 1023 CrossRef CAS.
- W. Thamjaree, W. Nhuapeng and T. Tunkasiri, Ferroelectrics Letters Section, 2004, 31, 79 CrossRef CAS.
- C. Wen, X. Li, D. Y. Sun, J. Q. Guan, X. X. Liu, Y. R. Lin, S. Y. Tang, G. Zhou, J. D. Lin and Z. H. Lin, Spectrosc Spect Anal, 2005, 25, 54 CAS.
- D. Graf, F. Molitor, K. Ensslin, C. Stampfer, A. Jungen, C. Hierold and L. Wirtz, Nano Lett., 2007, 7, 238 CrossRef CAS.
- S. M. Zhu, X. Y. Liu, Z. X. Chen, C. J. Liu, C. L. Feng, J. J. Gu, Q. L. Liu and D. Zhang, J. Mater. Chem., 2010, 20, 9126 RSC.
- M. Niederberger, G. Garnweitner, F. Krumeich, R. Nesper, H. Colfen and M. Antonietti, Chem. Mater., 2004, 16, 1202 CrossRef CAS.
- A. K. Manna and S. K. Pati, Chem.–Asian J., 2009, 4, 855 CrossRef CAS.
- R. Abe, T. Takata, H. Sugihara and K. Domen, Chem. Commun., 2005, 3829 RSC.
- R. Amal, Y. H. Ng, A. Iwase, N. J. Bell and A. Kudo, Catal. Today, 2011, 164, 353 CrossRef.
- X. Xiao and W. D. Zhang, Prog Chem, 2011, 23, 657 CAS.
- Y. Cong, F. Chen, J. L. Zhang and M. Anpo, Chem. Lett., 2006, 35, 800 CrossRef CAS.
| This journal is © The Royal Society of Chemistry 2012 |

