Effects of the functionality of epoxy monomer on the electro-optical properties of thermally-cured polymer dispersed liquid crystal films
Tingting
Zhang
,
Miki
Kashima
,
Mingzhi
Zhang
,
Fang
Liu
,
Ping
Song
,
Xiuting
Zhao
,
Cuihong
Zhang
,
Hui
Cao
* and
Huai
Yang
*
State Key Laboratory for Advanced Metals and Materials, Department of Materials Physics and Chemistry, School of Materials Science and Engineering, University of Science and Technology Beijing, Beijing, 100083, China. E-mail: yanghuai@mater.ustb.edu.cn; caohui@mater.ustb.edu.cn; Tel: 01062333969
First published on 19th January 2012
Abstract
Polymer dispersed liquid crystal (PDLC) films were formed by thermal polymerisation-induced phase separation in epoxy monomer/polyamine/liquid crystal (LC) mixtures. The effects of the epoxy monomer functionality on the morphology of polymer network, electro-optical and peel strength of PDLC films were studied. As the functionality of epoxy monomer increased, the LC domain size of PDLC films decreased resulting in higher threshold voltage and saturation voltage, longer rise time, shorter decay time, meanwhile the peel strength of PDLC films enhanced.
1 Introduction
Polymer dispersed liquid crystal (PDLC) films consist micron-sized droplets of liquid crystal (LC) and continuous polymer matrix in which LC droplets dispersed.1PDLC films appear scattered when no electric field is applied (OFF state), because the LC droplets are randomly oriented in the polymer matrix. Upon application of an electric field, liquid crystal directors align parallel to the applied electric field and the PDLC film becomes transparent (ON state) if the refractive indices match between the LC droplets and the polymer matrix. These optical properties are attractive for display devices, smart windows and other devices.2–5The electro-optical properties of PDLC films include driving voltages and response times which are affected by the size, shape and anchoring energy of the LC domains, as well as the dielectric anisotropy and viscosity of the LC.6–7
In the PDLC market, the content of LCs is an important factor on the price and quality of PDLC films. Lowering the content of LCs can reduce the price of PDLC materials, increase tensile strength of the polymer matrix and improve the interfacial adhesion between films8 resulting in the higher peel strength of PDLC films. But few PDLC films with LCs were lower than 50 wt%. In this study, we prepared PDLC films with 40 wt% of LCs which reduced the production cost of PDLC materials and improved the peel strength of the PDLC films.
Starting with a homogeneous mixture of liquid crystal and prepolymer, and the liquid crystal phase separating from the continuous polymer phase, there are three main ways to fabricate PDLC films: polymerisation-induced phase separation (PIPS),9–11thermally induced phase separation (TIPS),12 solvent-induced phase separation (SIPS).13 Among these methods, PIPS is the most widely used one, since its fabrication processes are simple, clean and solvent-free. And it is usually induced by thermally initiated polymerization or photo-polymerization of a polymer precursor mixed with LC.
At present, researchers are focusing more on photo-polymerization induced phase separation method to prepare PDLC films, while little attention is paid to the thermal-cured method though it emerged many years ago. H. Murai et al. studied the electro-optical properties of thermal-cured PDLC films, and found that driving voltages could be decreased by mixing an excess of hardener (polythiol) in the epoxy resin.10 In our group, X. K. Ding et al. investigated the electro-optical properties of PDLC films obtained by a two-step UV curing and heat curing process, which was perform by PIPS method.14 Q. Y. Meng et al. investigated the effect of epoxy monomers containing flexible chain segments on the electro-optical properties of thermal-cured PDLC films.9 After increasing the amount of flexible segments, the driving voltages decrease and on-state transmittance increases. However, only the functionality of the monomers and the peel strength of PDLC were investigated.
Therefore, we used the thermal polymerisation-induced phase separation method to investigate the influences of different functionalities of epoxy monomers on the electro-optical properties in this paper. Meanwhile its effect on peel strength was also studied.
2 Experimental details
2.1 Material
Fig. 1 indicates the chemical structures of the components used. The nematic LC used in this study was SLC 1717 (TNI = 365.2 K, n0 = 1.519, ne = 1.720, Shijiazhuang Yongsheng Huatsing Liquid Crystal Co. Ltd.) 2, 2′- (ethylenedioxy) bis (ethylamine) (EDBEA, Alfa Aesar, A Johnson Matthey Company) are used as a polyamine hardener for epoxy resins. The epoxy monomers are ethylene glycol diglycidyl ether (EGDE) resin (XY 669, Anhui Hengyuan Chemical Co., Ltd.), trimethylolpropane triglycidyl ether (TMPTGE, Nanjing Chemlin Chenmical Industry) and pentaerythritol tetraglycidyl ether (PERTGE, Synasia (SuZhou) Co., Ltd.). Each contains different functionality: EGDE as two, TMPTGE as three and PERTGE as four. These materials above are used without further purification.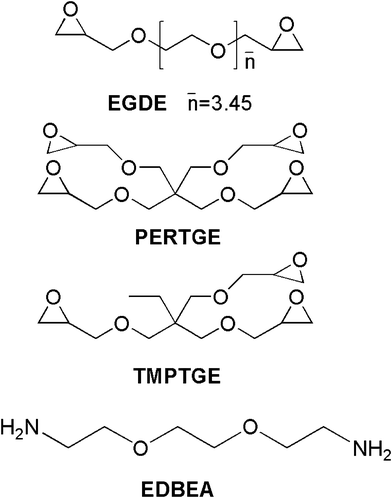 | ||
| Fig. 1 The chemical structures of heat-curable monomers. | ||
The compositions and functionalities of all samples are shown in Table 1. TMPTGE and PERTGE are separately mixed with EGDE in certain proportions to make epoxy resins with different functionalities. The functionality refers to the average functionality of epoxy resin. It is calculated by  ,15 where Fav is the average functionality of composite monomer, Φi and fi stand for the relative percentage and functionality respectively. The theoretical reaction mole ratio of EGDE/EDBEA, TMPTGEP/EDBEA and PERTGE/EDBEA are 2
![[thin space (1/6-em)]](https://www.rsc.org/images/entities/char_2009.gif) :
:![[thin space (1/6-em)]](https://www.rsc.org/images/entities/char_2009.gif) 1, 4
1, 4![[thin space (1/6-em)]](https://www.rsc.org/images/entities/char_2009.gif) :
:![[thin space (1/6-em)]](https://www.rsc.org/images/entities/char_2009.gif) 3 and 1
3 and 1![[thin space (1/6-em)]](https://www.rsc.org/images/entities/char_2009.gif) :
:![[thin space (1/6-em)]](https://www.rsc.org/images/entities/char_2009.gif) 1, respectively.
1, respectively.
| Sample | MM1 a/MM2b/LC/wt (%) | Average Functionality | Sample | MM1 a/MM3c/LC/wt (%) | Average Functionality |
|---|---|---|---|---|---|
| a monomer mixture 1 (MM1): EGDE/EDBEA = 2/1 (mol ratio). b monomer mixture 2 (MM2): TMPTGE/EDBEA = 4/3 (mol ratio). c monomer mixture 3 (MM3): PERTGE/EDBEA = 1/1 (mol ratio). | |||||
| A1 | 54/6/40 | 2.09 | B1 | 54/6/40 | 2.18 |
| A2 | 48/12/40 | 2.19 | B2 | 48/12/40 | 2.36 |
| A3 | 42/18/40 | 2.28 | B3 | 42/18/40 | 2.55 |
| A4 | 30/30/40 | 2.48 | B4 | 30/30/40 | 2.79 |
2.2 Material
The samples we prepared consisted of epoxy monomers, hardener and the same amount of LC (40 wt%). At the beginning, they were mixed uniformly in a proportion until they had been homogenized and then were treated in different ways to investigate their properties.In order to measure the electro-optical properties, the samples were inserted, via a capillary, into the indium tin oxide (ITO) glass substrates using 20 μm spacers to control the thickness and then cured in an oven at 363.15 K for 7 h.
To test peel strength, after being mixed with glass microballoons (20 μm) homogeneously, the samples were coated on ITO films. These specimens of PDLC films were pressed onto the stainless ITO using one pass of a 2 kg roller and cured at 363.15 K for 7 h.
2.3 Morphology analysis
We investigated the morphology of PDLC films with a scanning electron microscopy (SEM, Jeol JSM820). To obtain a polymer network, we extracted the LC molecules by dipping the specimen in cyclohexane for about 6 days at room temperature. Finally, the ITO glass with the polymer network was dried in vacuum and then was sputtered with a coating of carbon for SEM study.2.4 Electro-optic measurements
The electro-optical properties of PDLC films were measured using an LCD parameters tester (LCT-5016C, Changchun Liancheng Instrument Co. Ltd.). A halogen laser beam (560 nm) was used as the incident light source. The transmittance of the PDLC films was recorded by a photodiode, and the response of the photodiode was monitored by a digital storage oscilloscope. An electric field square wave (100 Hz) was used and the distance between PDLC film and photodiode was 300 mm.2.5 Peel strength measurements
The peel strength of PDLC films were measured by an autograph testing machine (AG-IC 50KN, Shimadzu International Trading (Shang Hai) Co. Ltd.). The PDLC film was cut into pieces with 15 × 4 cm2. Measurements were performed at room temperature at a detachment rate of 18 mm min−1. Three independent measurements were made and the averaged value of the results was defined as final peel strength.3 Results and discussion
3.1 Morphology of polymer network in PDLC films
Fig. 2 shows the polymer networks of samples A1–A4 which are named system A. The LC domain size decreases with increasing functionality of the epoxy monomer. More functionalized monomers can produce a higher crosslinking density during polymerization and thus decrease the LC domain size. In addition, the droplet sizes are also controlled by the relative contents of the polymerizable monomers and LC, the rate of polymerization, and some physical parameters such as the viscosity, rate of diffusion, and solubility of the LC in the polymer.7,16 Higher functionality monomers, which have more active centers, have a faster reaction rate than the less functionalized monomers. The prepolymer cured before the LC could diffuse, leaving little time for the LC molecules to grow and coalesce, resulting in the fabrication of smaller LC domain sizes. The results show that the amount of functionality of epoxy monomer influences the mesh size of the polymer network (the LC domain size).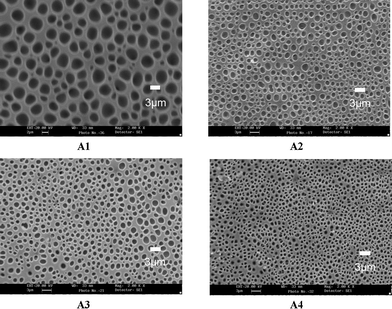 | ||
| Fig. 2 SEM micrographs of the polymer networks of samples A1–A4. | ||
Fig. 3 shows the morphologies of the PDLC samples B1–B4 which are named system B. The LC domain size decreases with increasing functionality of epoxy monomer, whose trend is similar to system A discussed above. This is determined by two factors: the increased crosslinking density and polymerization rate.
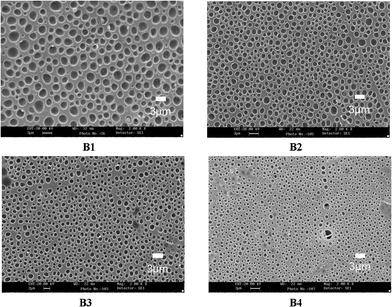 | ||
| Fig. 3 SEM micrographs of the polymer networks of samples B1–B4. | ||
3.2 Electro-optical properties of PDLC films
The voltage-transmittance curves of samples A1–A4 and B1–B4 are shown in Fig. 4. It can be clearly seen that there is an increase in the threshold voltage (Vth) and saturation voltage (Vsat) with the increase of epoxy functionality. Vth and Vsat are defined as the electric fields required for the transmittance to reach 10% and 90% of the maximum transmittance respectively.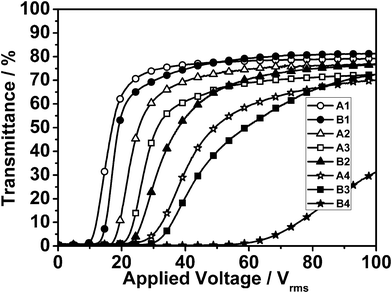 | ||
| Fig. 4 Transmittance vs. applied voltage as a function of functionality number of samples A1–A4 and B1–B4. | ||
As shows in Fig. 4, the transmittance of the sample B4 has not reached saturation at 100 Vrms. Because the polymerization rate is so fast that some LC and monomers are encapsulated in the polymer, LC-polymer phase separation is insufficient.17 Meanwhile, increasing the viscosity restrains the diffusion of the LC, and the remaining LC in the polymer only acts as a plasticizer, so the cell has a high anchoring energy, and therefore the transmittance of the sample does not reach saturation at 100 Vrms.
In this experiment, the electro-optical properties of PDLC films are strongly influenced by the LC domain size which can be controlled by the degree of functionality. It is well known that smaller domains provide more polymer–LC interfaces and higher anchoring energies, therefore the LC molecules are more difficult to orientate along the direction of the electric field. Generally, the threshold voltage Vth is a linear function of a reciprocal size of the droplets R according to
 | (1) |
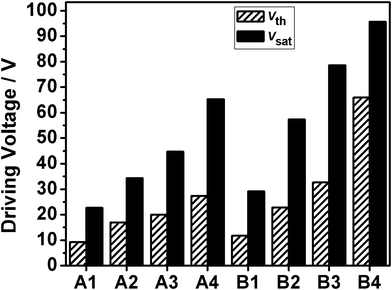 | ||
| Fig. 5 The driving voltage of samples A1–A4 and B1–B4. | ||
The rise time (ton) and decay time (toff) are also important factors when evaluating the performance of PDLC films. ton and toff are calculated from the time dependence of the transmission coefficient. ton is the time required to go from 10% to 90% of the maximum transmission of the sample upon turn on, toff is the time required to go from 90% to 10% of the maximum transmission of the sample upon turn off.
In general, the smaller the LC domain size is, the longer the ton and the shorter the toff. The results are related to the boundary interaction between the polymer matrix and the LC, which controls the orientation and re-orientation of LC under an electric field force. A smaller LC domain size leads to a larger ton, since the orientation of the LC needs a longer time to overcome the higher anchoring energy, while toff is expected to be independent of the voltage, because the much greater distortion of the director and the greater restoring energy of the deformed LC leads the liquid crystal molecule go back to its original position quickly.3,21,22 As shown in the Fig. 6, toff decreases with an increase of functionality, whereas ton increases in samples A1 to A4. The same characters are also observed in samples B1 to B4. We can also conclude that the order of ton is A1 < B1, A2 < B2, A3 < B3 and A4 < B4, while toff is A1 > B1, A2 > B2, A3 > B3 and A4 > B4. This is simply because the functionality of the epoxy monomer in system B is bigger than that in system A at the same mass ratio. The higher functionality of the epoxy monomers could result in the smaller LC domain size, thus contributing to a longer ton and a shorter toff.
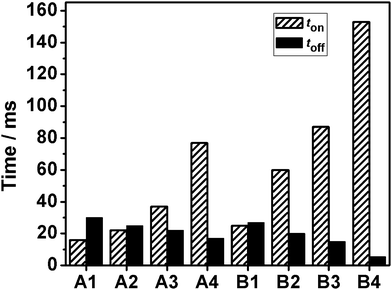 | ||
| Fig. 6 The response times of samples A1–A4 and B1–B4. | ||
Fig. 7 shows the peel strength of samples A1–A4 and B1–B4. The results of system A indicate that the peel strength enhances with an increase of functionality of the epoxy monomer. The peel strength is the sum of the energy required to break the bond and deform the backing and polymer.23 The increasing functionality elevates the crosslinking of the polymer fabric, so the cohesive strength of B4 is stronger than those of other samples. Meanwhile the reaction between epoxy groups and amino hydrogens produces hydroxyl polar groups and the more the epoxy resins react with amino hydrogens, the more hydroxyl groups are produced. Thus, the cohesive strength can be greatly promoted by increasing the surface polarity of the materials, which can be controlled by the amount of epoxy resins. Furthermore, hydrogen bonds formed between hydroxyl groups and the ITO interface also strengthen cohesive force. These also coincide with the increase in the peel strength in the samples B1–B4. However, the peel strength of sample B is bigger than that of sample A at the same weight ratio mainly due to the functionality of epoxy monomer. In summary, the adhesion force increases along with the increase in functionality, which eventually enhances the peel strength.
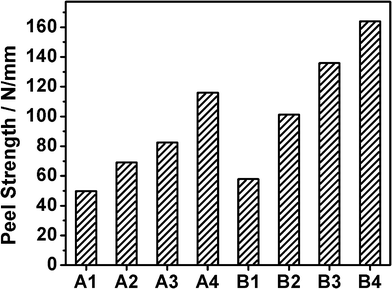 | ||
| Fig. 7 The peel strength of samples A1–A4 and B1–B4. | ||
Conclusions
The functionality of the epoxy monomer has a significant influence on the electro-optical properties and peel strength of thermally-cured PDLC films. When it increases, the crosslinking density and polymerization rate become higher, resulting in a decrease in the LC domain size of PDLC films, which decreases toff and increases ton, Vth and Vsat. Meanwhile, the peel strength is enhanced because the increase of functionality contributes to a higher crosslinking density and a strong cohesive strength with ITO.Acknowledgements
This work was supported by the National Natural Science Fund for Distinguished Young Scholars (Grant No. 51025313), the National Natural Science Foundation (Grant No. 50973010), the Science and Technology Project of Beijing, China (Grant No. D090803044209001), the Key Program for panel display of the 863 program of China (Grant No. 2008AA03A318), the National Key Technology Program (Grant No. 2007BAE31B00) and the Fundamental Research Funds for the Central Universities.References
- J. W. Doane, A. Golemme, J. L. West, J. B. Whitehead and B. G. Wu, Mol. Cyst. Liq. Cryst., 1988, 165, 511 CAS.
- M. Marialuigia, C. Daniela, D. F. Giovanni, P. N. Fiore and C. Giuseppe, Liq. Cryst., 2000, 27, 1337 CrossRef.
- H. Kikuchi, F. Usui and T. Kajiyama, Polym. J., 1996, 28, 35 CrossRef CAS.
- J. B. Whitehead, Jr., S. Zumer and J. W. Doane, J. Appl. Phys., 1993, 73, 1057 CrossRef.
- H. Yang, K. Mishima, K. Matsuyama, K. I. Hayashi, H. Kikuchi and T. Kajiyama, Appl. Phys. Lett., 2003, 82, 2407 CrossRef CAS.
- E. Nastal, E. Zuranska and M. J. Mucha, J. Appl. Polym. Sci., 1999, 71, 455 CrossRef CAS.
- M. Mucha, Prog. Polym. Sci., 2003, 28, 837 CrossRef CAS.
- M. Kashima, H. J. Liu, Q. Y. Meng, D. Wang, F. S. Li and H. Yang, Liq. Cryst., 2010, 37, 339 CrossRef CAS.
- Q. Y. Meng, H. Cao, M. Kashima, H. J. Liu and H. Yang, Liq. Cryst., 2010, 37, 189 CrossRef CAS.
- H. Murai and T. Gotoh, Mol. Cryst. Liq. Cryst. Sci. Technol., Sect. A, 1993, 226, 13 CrossRef CAS.
- N. A. Vaz, G. W. Smith and G. P. Montgomery, Mol. Cyst. Liq. Cryst., 1987, 146, 427 Search PubMed.
- J. L. West, Mol. Cryst. Liq. Cryst., 1988, 157, 427 CrossRef CAS.
- C. S. Shen and T. J. Kyu, Chem. Phys., 1995, 102, 556 CAS.
- X. K. Ding, M. Cao, H. J. Liu and H. Yang, Liq. Cryst., 2008, 35, 587 CrossRef CAS.
- M. D. Sarkar, N. L. Gill, J. B. Whitehead and G. P. Crawford, Macromolecules, 2003, 36, 630 CrossRef.
- A. K. Kalkar, V. V. Kunte and A. A. Deshpande, J. Appl. Polym. Sci., 1999, 74, 3485 CrossRef CAS.
- S. W. Myoung, E. H. Kim and Y. G. Jung, Thin Solid Films, 2010, 519, 1558 CrossRef CAS.
- P. S. Drzaic, Liq. Cryst., 1988, 3, 1543 CrossRef CAS.
- B. G. Wu, J. H. Erdmann and J. W. Doane, Liq. Cryst., 1989, 5, 1453 CrossRef CAS.
- S. C. Jain and D. K. Rout, J. Appl. Phys., 1991, 70, 6988 CrossRef CAS.
- K. Amundson, A. van Blaaderen and P. Wiltzius, Phys. Rev. E: Stat. Phys., Plasmas, Fluids, Relat. Interdiscip. Top., 1997, 55, 1646 CrossRef CAS.
- L. Petti, P. Mormile and W. J. Blau, Opt. Lasers Eng., 2003, 39, 369 CrossRef.
- D. H. Lim, H. S. Do, H. J. Kim, J. S. Bang and G. H. Yoon, J. Adhes. Sci. Technol., 2007, 21, 587 CrossRef.
| This journal is © The Royal Society of Chemistry 2012 |
