Operando 57Fe Mössbauer and XRD investigation of LixMnyFe1−yPO4/C composites (y = 0; 0.25)†
Alexis
Perea
*a,
Moulay T.
Sougrati
a,
Costana M.
Ionica-Bousquet
a,
Bernard
Fraisse
a,
Cécile
Tessier
b,
Laurent
Aldon
a and
Jean-Claude
Jumas
a
aICGM/AIME (CNRS UMR 5253), Université Montpellier II, CC 15-02 Place E. Bataillon, 34095, Montpellier Cedex 5, France. E-mail: alexis.perea@univ-montp2.fr
bSaft Recherche Division, 111-113 Bld. Alfred Daney, 33074, Bordeaux, France
First published on 13th January 2012
Abstract
LiMn0.25Fe0.75PO4 and LiFePO4 powders have been synthesized by a ceramic route. A comparative investigation of their electrochemical behaviour using operando57Fe Mössbauer and X-ray diffraction is reported. The partial substitution of Fe by Mn atoms enhances the energy density of the olivine phase since the average potential of cycling is increased. The complementarity of the operando techniques used in this study allows the monitoring of changes in the local electronic environment and the lattice modifications that are directly linked to the redox reaction mechanisms. The lithium deintercalation/intercalation mechanism in LiMn0.25Fe0.75PO4 has been found to be completely different from LiFePO4. During the charge, the LiMn0.25Fe0.75PO4 phase has been found to undergo three well defined and reversible reactions; (i) a biphasic reaction at 3.46 V corresponding to a partial oxidation of FeII into FeIII, (ii) the remaining FeII is oxidized in a monophasic reaction between 3.46 and 4.1 V. Finally, (iii) MnII is converted to MnIII by mean of biphasic reaction at 4.2 V. Interestingly, the FeIII Mössbauer signature has been found to be sensitive to the oxidation of MnII since this oxidation is accompanied with a significant increase in the quadrupole splitting. The non-optimized LiMn0.25Fe0.75PO4electrode has been successfully cycled with constant capacity (120 mAh.g−1) for more than 40 cycles at room temperature.
1. Introduction
Lithium iron phosphate LiFePO4 with an olivine structure has become of great interest1,21–3 as a promising storage cathode for the next generation of lithium-ion batteries because of its low cost, safety and environmental compatibility Since the first work of Padhi et al.2, many studies have attempted to improve the electrochemical performances of the material and to get deeper insight in the lithium electrochemical mechanism.4–7 In addition, attempts have been made to enhance the potential of the olivine cathode materials by the use of manganese phosphate instead of iron phosphate.2,8 Despite recent advances in cycling insulating materials thanks to nano-coating techniques and new preparation routes 9,10 and despite the promising results reported by some authors,9–11 the use of LiMnPO4 active material in lithium battery has not yet been reported. This is due to the fact that it shows a much lower effective energy density than lithium iron phosphate due to the low practical capacity evidenced and it requires very slow charge and discharge rates.1,12–14 The main reason for that is the large kinetic barrier at the mismatched interface of MnPO4/LiMnPO4.3 It is also worth noticing that during the charge, LiMnPO4 exhibits a higher volume change than LiFePO4.1,13,15A good compromise between LiFePO4 which is a semiconductor (with ca. 0.3 eV band gap) and LiMnPO4 which is an insulator (with ca. 2 eV band gap) is the partially substituted phases LiMnyFe1−yPO4,2,13,16 that would introduce the advantage of combining the good electrochemical performances of LiFePO4 with a higher potential for manganese (∼4.1 V compared with ∼3.4 V vs. Li+/Li for iron) in order to enhance the energy density.
It is however not yet clear which composition has to be preferred for practical application. Yamada et al. suggested that LiMn0.6Fe0.4PO4 composition exhibits the best electrochemical performances.13 LiMn0.4Fe0.6PO4 has also been reported to give good specific capacity after 100 cycles.17 Chang et al. have reported that LiMn0.3Fe0.7PO4 shows the excellent cycling performances,18 whereas Xu et al. found that LiMn0.1Fe0.9PO4 shows the best cycling performances.19 Despite increasing interest in the Mn substituted phases, their electrochemical mechanisms are not yet well understood. It is for example not clear why the Fe3+/Fe2+ and Mn3+/Mn2+ redox potentials are shifted (vs.Mn content) and why the polarizations related to these two couples show an opposite behaviours.20
Operando techniques are increasingly employed for the investigation of battery electrochemical behaviour. Few analyses of LiMnyFe1-yPO4 have been reported using XRD and X-ray absorption spectroscopy (XAS).21–23 To our knowledge, no operando Mössbauer analysis of this family of compounds has been published and only some ex situ studies have been reported.13,24,25
In this study, we have prepared LiMn0.25Fe0.75PO4/C and LiFePO4/C by solid-state reaction. OperandoXRD and 57Fe Mössbauer Spectroscopy analyses have been used to investigate the evolution of iron local environment, oxidation state and lattice structure during the electrochemical redox process.
2. Experimental section
2.1 Synthesis procedure
LiMnyFe1−yPO4/C (y = 0; 0.25; 0.5; 0.75) composites were obtained by a solid-state reaction from Li2CO3, FeC2O4·2H2O, Mn(COOCH3)2·4H2O, NH4H2PO4 and a source of carbon (all chemicals of 99% purity from Aldrich) taken in stoichiometric quantities. The precursors were first ball milled for 90 min and then thermally treated in a furnace (79![[thin space (1/6-em)]](https://www.rsc.org/images/entities/char_2009.gif) 300 Thermolyne Tube Furnace) under argon flow at 600 °C.
300 Thermolyne Tube Furnace) under argon flow at 600 °C.
2.2 Characterization of materials
After preparation, the compounds were crushed in an agate mortar and powder XRD (PHILIPS X'Pert MPD θ–2θdiffractometer equipped with the X'celerator detector) patterns were recorded using Cu-Kα radiation (λ = 1.5418 Å) and a nickel filter.The residual carbon content was evaluated by a Flash EA 1112 analyser based on the Dynamic Flash Combustion which produced complete combustion of the sample followed by an accurate and precise determination of the elemental gases produced. 57Fe Mössbauer spectra were recorded in the constant acceleration mode and in transmission geometry on a standard Mössbauer spectrometer composed of electronic devices from Ortec and Wissel. A 57Co(Rh) source with a nominal activity of 370 MBq was used. The source and the absorber were always kept at RT.
2.3 Electrochemical behaviour
Electrodes containing 80 wt% sample and 20 wt% carbon black were prepared for cycling tests. Standard Swagelok cells Li|1 M LiPF6 (propylenecarbonate (PC)![[thin space (1/6-em)]](https://www.rsc.org/images/entities/char_2009.gif) :
:![[thin space (1/6-em)]](https://www.rsc.org/images/entities/char_2009.gif) ethylene carbonate (EC)
ethylene carbonate (EC)![[thin space (1/6-em)]](https://www.rsc.org/images/entities/char_2009.gif) :
:![[thin space (1/6-em)]](https://www.rsc.org/images/entities/char_2009.gif) dimethyl carbonate (DMC)) 1
dimethyl carbonate (DMC)) 1![[thin space (1/6-em)]](https://www.rsc.org/images/entities/char_2009.gif) :
:![[thin space (1/6-em)]](https://www.rsc.org/images/entities/char_2009.gif) 1
1![[thin space (1/6-em)]](https://www.rsc.org/images/entities/char_2009.gif) :
:![[thin space (1/6-em)]](https://www.rsc.org/images/entities/char_2009.gif) 3, v/v)| LiMn0.25Fe0.75PO4 were assembled in an argon-filled glove box and tested using a VMP system at a rate of C/10 for both charge and discharge, between 4.3 and 2.75 V versusLi+/Li.
3, v/v)| LiMn0.25Fe0.75PO4 were assembled in an argon-filled glove box and tested using a VMP system at a rate of C/10 for both charge and discharge, between 4.3 and 2.75 V versusLi+/Li.
To identify the electrochemical reaction mechanisms, we carried out operandoXRD and 57Fe Mössbauer spectroscopy measurements for both LiMnyFe1−yPO4 (y = 0; 0.25) electrodes using a new electrochemical cell designed especially for this aim26
To preserve the beryllium window from oxidation due to high working voltage, it was covered by a 2 μm thick foil of pure aluminium (Goodfellow). Here, the cells were charged and discharged using a C/40 rate, at room temperature in the voltage ranges 2.75–4.2 V and 2.75–4.3 V for y = 0 and y = 0.25 respectively. Each operandoXRD scan was recorded over 1 h in which Li extraction/insertion was performed and the results correspond to a change of composition of Δx = 0.025 Li (where x is in LixMnyFe1−yPO4/C (y = 0; 0.25)). A 2 h acquisition time was used for the operando Mössbauer measurement. Each spectrum corresponds to Δx = 0.05 extracted/inserted Li.
3. Results and discussion
The sample purity has been checked by XRD and the obtained patterns are given in Fig. 1a and 1b. All the diffraction peaks can be indexed in the orthorhombic Pnma space group. The Lebail method27 has been used to estimate the lattice parameters respectively a = 10.331(3) Å, b = 6.001(2) Å, c = 4.691(1) Å for LiFePO4/C and a = 10.351(3) Å, b = 6.032(2) Å, c = 4.713(1) Å for LiMn0.25Fe0.75PO4/C. These values are in good agreement with the literature.2 Average crystallite sizes of 120 nm have been obtained using the Scherrer formula.28 The residual carbon content was evaluated at 4.85% and 4.9% for LiMnyFe1−yPO4 (y = 0; 0.25) respectively.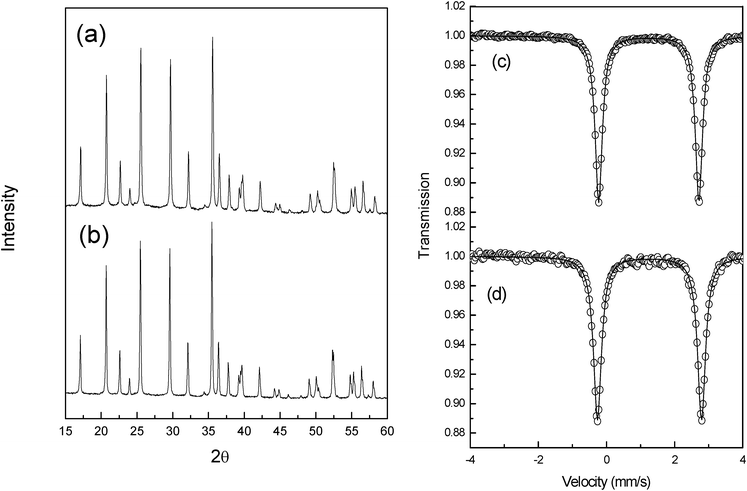 | ||
| Fig. 1 Powder X-ray diffraction patterns (a and b) and 57Fe Mössbauer spectra (c and d) of LiMnyFe1−yPO4/C, where y = 0 or y = 0.25. | ||
Fig. 1c and 1d show the 57Fe Mössbauer spectra of the obtained powders. LiFePO4 spectrum consists of a sharp doublet with an isomer shift of δ = 1.223(1) mm s−1 and a quadrupole splitting of Δ = 2.960(2) mm s−1 in agreement with nature of the iron environment in the olivine structure (high spin iron in the M2 octahedral site).24,29 LiMn0.25Fe0.75PO4spectrum (Fig. 1d) consists of a sharp doublet with an isomer shift of δ = 1.227(1) mm s−1 and a quadrupole splitting of Δ = 2.958(2) mm s−1. To our knowledge, there is no published study on the correlation between Mössbauer parameters and the Mn content in the triphylite-lithiophylite series. In order to verify the existence of such a correlation we prepared and analysed LiMn0.5Fe0.5PO4 and LiMn0.75Fe0.25PO4 samples. The obtained results are summarized in Fig. 2 and Table 1.
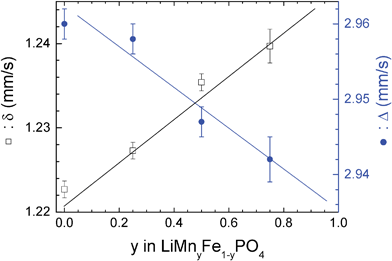 | ||
| Fig. 2 Variation of the hyperfine parameters with the manganese content in LiMnyFe1−yPO4 series. | ||
| y in LiMnyFe1−yPO4 | δ | Δ |
|---|---|---|
| mm s−1 | mm s−1 | |
| 0 | 1.223 | 2.96 |
| 0.25 | 1.227 | 2.958 |
| 0.5 | 1.235 | 2.947 |
| 0.75 | 1.240 | 2.942 |
The isomer shift increases linearly with the Mn content in agreement with the increase of the average Fe–O distance30 due to the substitution of Fe2+ (r = 0.78 Å) by Mn2+ (r = 0.83 Å).31 The similarity of the hyperfine parameters of these two phosphates is explained by the low variation in the length of the metal–ligand bonds following the substitution of 25% of iron by Mn (2.159 instead of 2.145 Å).32 Such a correlation has been established for lattice parameters which follow the Vegard's law.2
As expected by Ingalls's model for ferrous (Fe2+) compounds,33 the quadrupole splitting decreases with Mn content which increases the distortion of the iron octahedron. Such a behaviour has been reported for Fe2+ in Fe1−xMnxNb2O6 series.34
Fig. 3 illustrates the spectra obtained during the first charge for the two LiMnyFe1−yPO4 (y = 0; 0.25) composite materials during the operando Mössbauer measurements as well as the evolution of all Mössbauer hyperfine parameters (Fig. 4).
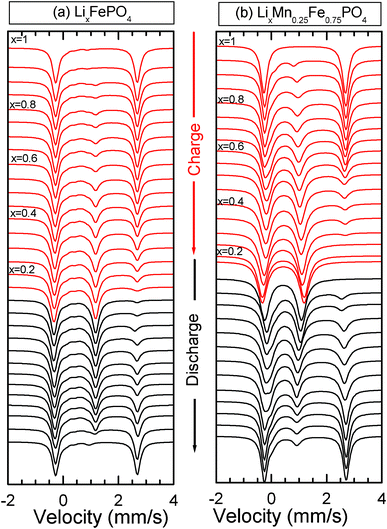 | ||
| Fig. 3 Mössbauer spectra of LiMnyFe1−yPO4/C at C/40 rate (y = 0 (a); 0.25 (b)) recorded during the electrochemical process. | ||
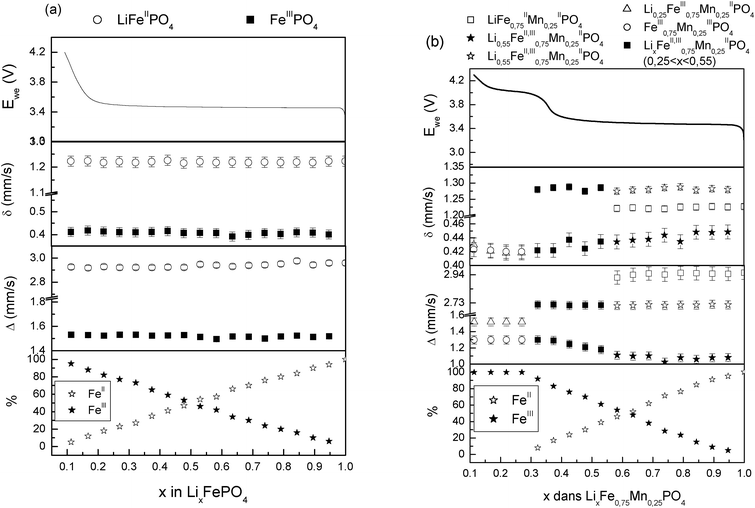 | ||
| Fig. 4 Evolution of the Mössbauer hyperfine parameters of FeII and FeIII species of LiMnyFe1−yPO4/C at C/40 rate (y = 0 (a); 0.25 (b)) recorded during the electrochemical process of the charge. | ||
The galvanostatic curve obtained for LiFePO4/C electrode (Fig. 4) consists of 3 regions. In the 1st region (Li–rich region), the potential increases quickly from 2.75 V to 3.45 V. In this region the corresponding spectra do not show any significant changes since the Mössbauer spectrum obtained at the beginning on the plateau (x = 0.95) is perfectly fitted using one doublet with hyperfine parameters similar to those of the OCV spectrum (δ = 1.223 mm s−1, Δ = 2.960 mm s−1) (Detailed data is given in the ESI†).
Even though the existence of solid solution phases with well-defined composition at room temperature has been reported,35,36 the present results cannot evidence the occurrence of solid solution phases during the first steps of the electrochemical delithiation of LiFePO4 (Fig. 4). Indeed, in the 0.95 ≤ x < 1 domain, only one Mössbauer spectrum and two XRD patterns were recorded continuously. During this data acquisition the Li content is variable and does not allow the identification of a possible solid solution formation. Other in situXRD and Mössbauer measurements are foreseen at different steps of the electrochemical process (fixed Li content) in order to give rise to the solid solution existence.
In the 2nd region (plateau) a progressive deintercalation of Li from the pristine material occurs at a constant potential (3.45 V) in good agreement with the coexistence of two phases LiFePO4 and FePO4 as seen in the Mössbauer spectra. At x = 0.89, FeIIIPO4 heterosite begins to appear with δ = 0.41 mm s−1 and Δ = 1.52 mm s−1 (Fig. 3a) in agreement with ex situ results reported by Andersson et al.24 During the electrochemical process, the hyperfine parameters of both Fe2+ and Fe3+ do not show any significant change that could indicate the formation of a solid solution proposed by some authors.7,37,38
Finally, in the 3rd region, the potential increases rapidly to reach 4.2 V. Again, in this region, no significant change can be observed on the Mössbauer spectra. The Mössbauer spectrum obtained at end of the plateau indicates clearly that all the FeII is oxidized to FeIII.
The relative amount of the coexistent phases (Fig. 4) can be directly monitored by the evolution of the spectral areas since the Lamb–Mössbauer factors of these phases have been found to be sensitively identical.39
This 57Fe Mössbauer study confirms the mechanism of lithium deintercalation that is often described as growth of FePO4 at the expense of LiFePO4 as expected by the main models suggested to describe the mechanism.2,4,37,38,40 The reaction can be written as follow:
| LiFePO4 ↔ (1 − x)LiFePO4 + xFePO4 + xLi+ + xe− | (1) |
In the case of the Mn–substituted olivine material an up-shift of the Fe3+/Fe2+ redox potential by 0.1 V was noted on the derivative of its galvanostatic curve. During the first charge of LiMn0.25Fe0.75PO4/C electrode 3 regions can be observed.
In the beginning of the 1st region (0.55 ≤ x < 1) (where x is in LixMn0.25Fe0.75PO4) as for LiFePO4/C the potential increases quickly from 2.75 V to 3.55 V. Fig. 5 depicts the evolution of the operandoXRD patterns and the corresponding galvanostatic curve. For clarity reasons, only the main diffraction peaks are represented (16 ≤ 2θ ≤ 19° and 29 ≤ 2θ ≤ 31°).
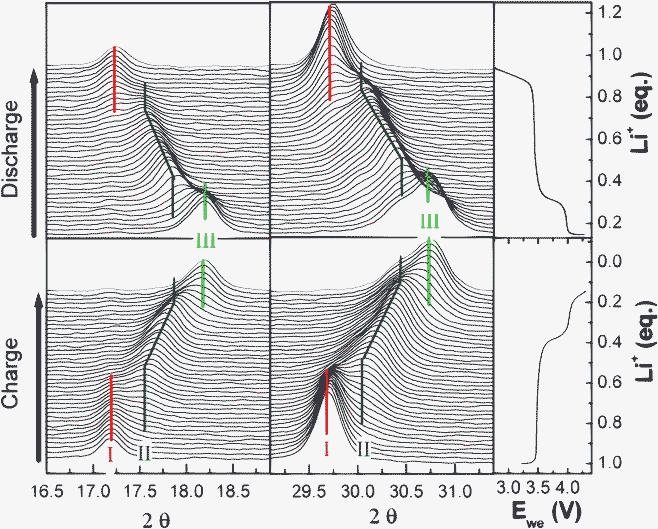 | ||
| Fig. 5 In situ operando X-ray diffractograms of LiMn0.25Fe0.75PO4/C recorded during the electrochemical process at C/40 rate. | ||
For 0.95 ≤ x < 1, the Mössbauer spectrum (Fig. 3b) and XRD pattern (Fig. 5) are similar to those obtained for OCVs. However, significant changes begin to appear in the domain (0.55 ≤ x < 0.95) and confirm the coexistence of two phases, the pristine material and a partially delithiated one.
At x = 0.9, the XRD pattern shows that new peaks of an olivine-like phase appear. At x = 0.55 the (020) peak of the phase LiMnII0.25FeII0.75PO4 disappears in the XRD patterns. From these observations, we propose the coexistence of LiMnII0.25FeII0.75PO4 and Li0.55MnII0.25FeII,III0.75PO4 during this step. The plateau of the first region corresponds to the FeII/FeIII redox reaction which is clearly evidenced from the Mössbauer spectra. In addition to the FeII doublet from the olivine phase, a second doublet appears (δ = 0.42 mm s−1 and Δ = 1.10 mm s−1, (Fig. 4b)) attributed to a FeIII species. At x = 0.9, a third doublet was observed (δ = 1.28 mm s−1 and Δ = 2.75 mm s−1 (Fig. 4b)) and was attributed to a new phase formation. XRD pattern observation allows us to propose the following composition for this new phase : Li0.55MnII0.25FeII,III0.75PO4. The Mössbauer probe permits us to evaluate the composition of this mixed valence phase Li0.55FeII0.3FeIII0.45Mn0.25PO4. Assuming the solid solution Li0.55−zFeII0.3−zFeIII0.45+zMn0.25PO4, the theoretical FeII/FeIII ratio is given by (0.3 − z)/(0.45 + z), with 0 < z < 0.3. This ratio is compared to the experimental one as shown in Fig. 6. A good agreement confirms the presence of this intermediate phase.
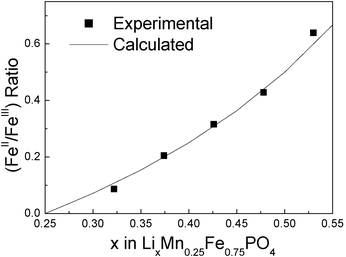 | ||
| Fig. 6 Theoretical and experimental FeII/FeIII ratio deduced from the Mossbauer spectroscopic data assuming the Li0.55−zFeII0.3−zFeIII0.45+zMn0.25PO4 solid solution. | ||
The relative contributions of the two FeII components vary inversely until x = 0.55. The occurring reaction can be written as:
| Li1.0Mn0.25FeII0.75PO4 ↔ (α)Li0.55FeIII0.3FeIII0.45Mn0.25PO4 + (1 − α)Li1.0Mn0.25FeII0.75PO4 + 0.45αLi+ + 0.45αe− (where 0.1 < α ≤ 1) | (2) |
The second region (0.25 ≤ x ≤ 0.55) is characterized by sloppy increase of the potential up to 4.03 V. A systematic shift of the diffraction peak of (020) at 2θ ∼29.5° of the phase Li0.55FeII0.3FeIII0.45Mn0.25PO4 (Fig. 5) suggests a solid solution occurring in this domain. In this region, the isomer shift and quadrupole splitting of FeII as well as the FeIII isomer shift remain unchanged, whereas the quadrupole splitting of FeIII increases gradually (22%) with the oxidation of iron indicating a significant lattice change, confirming the XRD results. In fact, FeIII is more sensitive to lattice distortion than FeII even though the origin of this distortion is due to the second near neighbours. Higher quadrupole splitting variation (48%) has been reported by Yamada et al.41 for a Mn rich phase (y = 0.6) prepared by chemical lithiation. In this domain as the reaction can be described by the following reaction:
| Li0.55FeII0.3FeIII0.45Mn0.25PO4 ↔ Li0.55−αFeII0.3−αFeIII0.45+αMn0.25PO4 + αLi+ + αe− | (3) |
The third region (0.1 ≤ x < 0.25) corresponds to the oxidation of MnII to MnIII which occurs during the short plateau around 4.03 V. The coexistence of the phase Li0.25FeIII0.75Mn0.25PO4 with the totally delithiated phase indicates the occurrence of a biphasic reaction (Fig. 5).
| Li0.25FeIII0.75Mn0.25PO4 ↔ βFeIII0.75MnIII0.25PO4 + (1 − β)Li0.25FeIII0.75Mn0.25PO4 + 0.25βLi+ + 0.25βe− (where 0 < β ≤ 1) | (4) |
The FeII has been almost completely oxidized at the beginning of this plateau, but the Mössbauer spectrum (Fig. 7) continues to evolve indicating that the iron local environment is affected by the oxidation of MnII to MnIII. Spectra for x ≤ 0.25 cannot be fitted using only the same FeIII doublet used for the fit of the spectra recorded in the plateau of the second region. Best fit is only obtained using one more FeIII doublet with higher quadrupole splitting of 1.52 mm s−1 indicating that the Mössbauer probe (Fe) is also sensitive to the oxidation occurring in Mn sites (Table 2).42
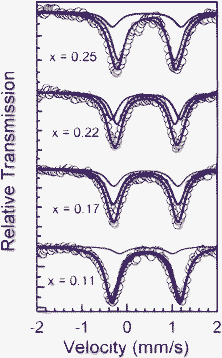 | ||
| Fig. 7 Mössbauer spectra of LixMn0.25Fe0.75PO4/C obtained in the third region at the indicated x values. | ||
| Composition | δ | Δ |
|---|---|---|
| mm s−1 | mm s−1 | |
| LiMn II0.25 Fe II0.75 PO4 | 1.22 | 2.96 |
| Li0.55Mn II0.25 Fe II,III0.75 PO4 | 1.28 | 2.75 |
| 0.42 | 1.10 | |
| Li0.25MnII0.25FeII,III0.75PO4 | 0.41 | 1.30 |
| Mn II0.25 Fe III0.75 PO4 | 0.41 | 1.52 |
| LiFeIIPO4 | 1.22 | 2.96 |
| FeIIIPO4 | 0.41 | 1.52 |
Interestingly, the value of the quadrupole splitting of the second FeIII doublet of FeIII0.75MnIII0.25PO4 is identical to the one of FeIII doublet used for the fit of the FeIII component in the LiFePO4 spectra. This phenomenon can be explained by the similarity of ionic radii of MnIII and FeIIIRMnIII ≈ RFeIII = 0.64 Å. In fact, when all the Fe and Mn atoms are in the trivalent state, the lattice unit volume of FeIII0.75MnIII0.25PO4becomes similar to the volume of FePO4.41 The intensity of the second FeIII doublet increases with the oxidation of MnII and becomes predominant at the end of the charge.
4. Cycling performance
Fig. 8 shows the first 40 cycles obtained at C/10 rate without a sophisticated electrode formulation using Swagelok™cell at room temperature.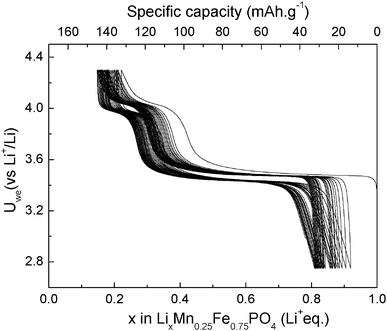 | ||
| Fig. 8 Galvanostatic curve of LiMn0.25Fe0.75PO4/C at C/10 rate. | ||
The specific capacity decreases slightly in the first cycles, and then it becomes constant for further cycling at about 120 mAh.g−1 and is close to the one obtained for LiFePO4 prepared in the same conditions. The efficiency calculated is about 92% at the 10th cycle.
5. Conclusion
In this paper we report a comparative operando study for LiMnyFe1−yPO4/C for y = 0 and y = 0.25 combining XRD and 57Fe Mössbauer spectroscopy. The electrochemical mechanisms have been studied by monitoring the evolution of the local electronic environment (Mössbauer probe) and the lattice changes (XRD). This study confirms the well-known biphasic reaction for LiFePO4/FePO4 couple. The solid solution phase (LiMn0.25Fe0.75PO4) exhibits a more complex three step mechanism during the charge. First a two biphasic reaction in the domain (0.55 ≤ x < 0.95) between LiMnII0.25FeII0.75PO4 and Li0.55FeII0.3FeIII0.45MnII0.25PO4, where the Mössbauer probe helps to determine the composition of this mixed valence phase. Chemical delithiation of the pristine phase is expected to confirm the hypothesis of this new phase. The reaction is followed by a solid solution in the domain (0.25 ≤ x ≤ 0.55). The third step is described by a biphasic reaction between Li0.25FeIII0.75MnII0.25PO4 and FeIII0.75MnIII0.25PO4 until x = 0.1.The LiMn0.25Fe0.75PO4 presents good cycling performances since the capacity of 120 mAh.g−1 has been maintained during 40 cycles without an optimization of electrode formulation.
Better cycling performances are expected by an improvement of the formulation process.
Acknowledgements
The authors would like to thank SAFT Company and CNRS (contract SAFT/CNRS N°029888) through the Ph.D. grant of Alexis Perea and ANR PHOSPHALION (National Research Agency) Stock-E program (ANR-09-STOCK-E-07) for financial support and Manfred Womes for fruitful discussions. Région Languedoc-Roussillon is gratefully acknowledged for the financial support to X-rays and gamma-rays platform (Contracts n° 2006 Q-086 and 2008 094192)References
- C. Delacourt, P. Poizot, M. Morcrette, J. M. Tarascon and C. Masquelier, Chem. Mater., 2004, 16, 93–99 CrossRef CAS.
- A. K. Padhi, K. S. Nanjundaswamy and J. B. Goodenough, J. Electrochem. Soc., 1997, 144, 1188–1194 CrossRef CAS.
- C. Delacourt, L. Laffont, R. Bouchet, C. Wurm, J. B. Leriche, M. Morcrette, J. M. Tarascon and C. Masquelier, J. Electrochem. Soc., 2005, 152, A913–A921 CrossRef CAS.
- C. Delmas, M. Maccario, L. Croguennec, F. Le Cras and F. Weill, Nat. Mater., 2008, 7, 665–671 CrossRef CAS.
- R. Dedryvere, M. Maccario, L. Croguennec, F. Le Cras, C. Delmas and D. Gonbeau, Chem. Mater., 2008, 20, 7164–7170 CrossRef CAS.
- C. Delacourt, J. Rodriguez-Carvajal, B. Schmitt, J. M. Tarascon and C. Masquelier, Solid State Sci., 2005, 7, 1506–1516 CrossRef CAS.
- A. Yamada, H. Koizumi, N. Sonoyama and R. Kanno, Electrochem. Solid-State Lett., 2005, 8, A409–A413 CrossRef CAS.
- F. Zhou, K. S. Kang, T. Maxisch, G. Ceder and D. Morgan, Solid State Commun., 2004, 132, 181–186 CrossRef CAS.
- G. H. Li, H. Azuma and M. Tohda, Electrochem. Solid-State Lett., 2002, 5, A135–A137 CrossRef CAS.
- N. H. Kwon, T. Drezen, I. Exnar, I. Teerlinck, M. Isono and M. Graetzel, Electrochem. Solid-State Lett., 2006, 9, A277–A280 CrossRef CAS.
- C. Wang, S. Lu, S. Kan, J. Pang, W. Jin and X. Zhang, J. Power Sources, 2009, 189, 607–610 CrossRef CAS.
- M. Yonemura, A. Yamada, Y. Takei, N. Sonoyama and R. Kanno, J. Electrochem. Soc., 2004, 151, A1352–A1356 CrossRef CAS.
- A. Yamada, Y. Kudo and K. Y. Liu, J. Electrochem. Soc., 2001, 148, A747–A754 CrossRef CAS.
- J. S. Yang and J. J. Xu, J. Electrochem. Soc., 2006, 153, A716–A723 CrossRef CAS.
- S. W. Kim, J. Kim, H. Gwon and K. Kang, J. Electrochem. Soc., 2009, 156, A635–A638 CrossRef CAS.
- A. Yamada, M. Hosoya, S. C. Chung, Y. Kudo, K. Hinokuma, K. Y. Liu and Y. Nishi, J. Power Sources, 2003, 119, 232–238 CrossRef.
- Y. J. Shin, J. K. Kim, G. Cheruvally, J. H. Ahn and K. W. Kim, J. Phys. Chem. Solids, 2008, 69, 1253–1256 CrossRef CAS.
- J. Xu, G. Chen, H. J. Li and Z. S. Lv, J. Appl. Electrochem., 2010, 40, 575–580 CrossRef CAS.
- X. Y. Chang, Z. X. Wang, X. H. Li, L. Zhang, H. J. Guo and W. J. Peng, Mater. Res. Bull., 2005, 40, 1513–1520 CrossRef CAS.
- G. Kobayashi, A. Yamada, S. Nishimura, R. Kanno, Y. Kobayashi, S. Seki, Y. Ohno and H. Miyashiro, J. Power Sources, 2009, 189, 397–401 CrossRef CAS.
- K. W. Nam, W. S. Yoon, K. Zaghib, K. Y. Chung and X. Q. Yang, Electrochem. Commun., 2009, 11, 2023–2026 CrossRef CAS.
- T. Nedoseykina, M. G. Kim, S. A. Park, H. S. Kim, S. B. Kim, J. Cho and Y. Lee, Electrochim. Acta, 2010, 55, 8876–8882 CrossRef CAS.
- Y. C. Chen, J. M. Chen, C. H. Hsu, J. F. Lee, J. W. Yeh and H. C. Shih, Solid State Ionics, 2009, 180, 1215–1219 CrossRef CAS.
- A. S. Andersson, B. Kalska, L. Haggstrom and J. O. Thomas, Solid State Ionics, 2000, 130, 41–52 CrossRef CAS.
- W. Ojczyk, J. Marzec, J. Dygas, F. Krok, R. S. Liu and J. Molenda, Materials Science-Poland, 2006, 24, 103–113 CAS.
- J. B. Leriche, S. Hamelet, J. Shu, M. Morcrette, C. Masquelier, G. Ouvrard, M. Zerrouki, P. Soudan, S. Belin, E. Elkaim and F. Baudelet, J. Electrochem. Soc., 2010, 157, A606–A610 CrossRef CAS.
- J. Rodríguez-Carvajal, Phys. B, 1993, 192, 55–69 CrossRef.
- J. P. Eberhart, Méthodes physiques d'étude des minéraux et des matériaux solides, 1976 Search PubMed.
- A. A. M. Prince, S. Mylswamy, T. S. Chan, R. S. Liu, B. Hannoyer, M. Jean, C. H. Shen, S. M. Huang, J. F. Lee and G. X. Wang, Solid State Commun., 2004, 132, 455–458 CrossRef CAS.
- F. Menil, J. Phys. Chem. Solids, 1985, 46, 763–789 CrossRef CAS.
- R. D. Shannon, Acta Crystallogr., Sect. A: Cryst. Phys., Diffr., Theor. Gen. Crystallogr., 1976, 32, 751–767 CrossRef.
- A. Losey, J. Rakovan, J. M. Hughes, C. A. Francis and M. D. Dyar, Can. Mineral., 2004, 42, 1105–1115 CrossRef CAS.
- R. Ingalls, Phys. Rev., 1964, 133, A787 CrossRef.
- S. Tarantino, M. Zema, F. Maglia, M. Domeneghetti and M. Carpenter, Phys. Chem. Miner., 2005, 32, 568–577 CrossRef CAS.
- C. Delacourt, P. Poizot, J. M. Tarascon and C. Masquelier, Nat. Mater., 2005, 4, 254–260 CrossRef CAS.
- V. Srinivasan and J. Newman, J. Electrochem. Soc., 2004, 151, A1517–A1529 CrossRef CAS.
- G. Y. Chen, X. Y. Song and T. J. Richardson, Electrochem. Solid-State Lett., 2006, 9, A295–A298 CrossRef CAS.
- L. Laffont, C. Delacourt, P. Gibot, M. Y. Wu, P. Kooyman, C. Masquelier and J. M. Tarascon, Chem. Mater., 2006, 18, 5520–5529 CrossRef CAS.
- L. Aldon, A. Perea, M. Womes, C. M. Ionica-Bousquet and J. C. Jumas, J. Solid State Chem., 2010, 183, 218–222 CrossRef CAS.
- N. Meethong, H. Y. S. Huang, S. A. Speakman, W. C. Carter and Y. M. Chiang, Adv. Funct. Mater., 2007, 17, 1115–1123 CrossRef CAS.
- A. Yamada and S.-C. Chung, J. Electrochem. Soc., 2001, 148, A960–A967 CrossRef CAS.
- L. Aldon and A. Perea, Journal of Power Sources, 2010, 196, 1342–1348 CrossRef.
Footnote |
| † Electronic Supplementary Information (ESI) available. See DOI: 10.1039/c1ra00256b/ |
| This journal is © The Royal Society of Chemistry 2012 |
