DOI:
10.1039/C1PY00419K
(Paper)
Polym. Chem., 2012,
3, 182-189
Received
15th September 2011
, Accepted 15th October 2011
First published on 26th October 2011
Introduction
The complexation of metal ions with polymer chains containing ligand groups leads to advanced materials due to the combination of physical, chemical, and structural properties provided by the two components. The incorporation of metal binding sites into polymers can be achieved either along the polymer main chain1–4 or as side group functionalities.5–8 A large number of coordination polymers with oxygen, sulfur, and nitrogen containing anchoring ligands and polymer–metal complexes have been described. For example, the β-dicarbonyl compounds have high affinity towards metal and metal ions,9 and they are commonly involved in hydrogen-bonding motifs,10 synthetic basis for a large number of technically important dyestuffs,11etc. The homopolymer and copolymer of 2-(acetoacetoxy)ethyl methacrylate (AEMA) are interesting materials, due to the presence of β-carbonyl moieties along the side chain. Furthermore, poly(2-(acetoacetoxy)ethyl methacrylate) (PAEMA) homopolymers were found to self-assemble into a hierarchical superstructure of double-stranded helical tubes.12 The formation of the superstructures was due to the establishment of hydrogen bridges between adjacent acetoacetoxygroups and compensation of dipole moments. The β-carbonyl moieties, which act as strong bidentate ligands, in the PAEMA-based polymers can be coordinated to a wide range of metal ions with different geometries and oxidation states. These kinds of polymers have great potential application in the fields of polymer-based hybrid materials,13biomineralization process,14 waste water treatment for metal recovery,15etc.
Radical polymerization of vinyl monomers in the presence of high oxygen pressure is known as oxidative polymerization. The main product of oxidative polymerization are polyperoxides, which are alternating copolymers of vinyl monomer and molecular oxygen.16 In recent years these polyperoxides are rapidly gaining their importance as coatings,17 dismantlable adhesion,18 curatives in molding composition,17 determining the thermal stability of commercial polymers,19 polymeric radical initiators for vinyl monomers,20etc. Polyperoxides degrade highly exothermically in contrast to common polymers, and exhibit the unusual phenomenon of auto-pyrolysis indicating its potential use as an autocombustible fuel.21 Although polyperoxides have been known22 since 1922 no polyperoxides have been reported with ligand groups for post-polymerization modifications. In the present study, an alternating copolymer of AEMA and molecular oxygen, poly[2-(acetoacetoxy)ethyl methacrylate]peroxide (PAEMAP), has been synthesised and characterized. Thermal degradation in bulk has been studied in detail and the mechanism of exothermic degradation was supplemented by thermochemical calculations. Our recent study indicates vinyl polyperoxides as biodegradable and biocompatible materials.23 So, enzymatic degradation and in vitro biocompatibility of PAEMAP are also assessed.
Experimental
Materials
2-(Acetoacetoxy)ethyl methacrylate (AEMA, Sigma, 95%) was purified prior to polymerization by passing through a column of basic alumina. The 2,2′-azobisisobutyronitrile (AIBN, Sigma, 98%) was recrystallized twice from methanol. The oxygen used was of high purity (BOC, 99.9998%). Peroxidase from horseradish (HRP, Sigma, Type VI-A), CDCl3 (Cambridge Isotope, 99% D), D2O (Cambridge Isotope, 99% D), and dimethylsulfoxide-d6 (DMSO-d6, Cambridge Isotope, 99.9% D) were used as received. The solvents, petroleum ether (boiling range, 60–80 °C), chloroform, etc., were purified by standard procedures. For cytotoxicity test, HeLa cells were grown on Dulbecco's modified eagle medium (DMEM, Gibco) containing 10% foetal bovine serum (Hyclone Labs, Thermo Scientific) and penicillin–streptomycin (Hyclone Labs, Thermo Scientific) solution. Formazan crystals produced from 3-(4,5-dimethylthiazol-2-yl)-2,5-diphenyltetrazolium bromide (MTT, USB Corporation) treatment of the cells were dissolved in DMSO (99.9%, cell culture grade, Amresco). For microscopic imaging, cells were fixed with 4% paraformaldehyde (95%, Sigma-Aldrich) and were subsequently stained with 4′,6-diamidino-2-phenylindole (DAPI, USB Corporation).
Methods
Molecular weights and molecular weight distributions of polyperoxides were determined by gel permeation chromatography (GPC) using a Waters 515 HPLCpump, a Waters 2414 refractive index detector and two columns (Styragel HT4 and Styragel HT3). The eluent was tetrahydrofuran at 30 °C and the flow rate was 0.3 mL min−1. Narrow molecular weight polystyrene standards were used to generate the calibration curve. The 1H NMR spectroscopy was conducted with a Bruker AvanceIII 500 spectrometer operating at 500 MHz. Spectrophotometric analyses were performed using a Beckman Coulter DU-730 UV-VisSpectrophotometer. Fluorescence and phase contrast images of cells were taken with an Olympus IX-81 fluorescence microscope. The thermal analysis was carried out using a Mettler Toledo DSC1 STARedifferential scanning calorimeter (DSC) at different heating rates (3, 6, 10, 15 and 20 °C min−1) with sample sizes of ∼3–5 mg in nitrogen atmosphere. The thermogravimetric analysis (TGA) was accomplished on a Mettler Toledo TGA/SDTA 851e instrument at a heating rate of 10 °C min−1 with a sample weight of ∼4–6 mg in nitrogen atmosphere. The elemental analysis was carried out on a Perkin-Elmer Series-II, CHNO/S Analyzer-2400. The FTIR spectrum was recorded on KBr pellets using a Perkin-Elmer RXI spectrometer. Positive mode electrospray ionization mass spectrometry (ESI-MS) was performed on a Q-Tof Micro YA263 high resolution (Waters Corporation) mass spectrometer.
The bulk polymerizations of AEMA were carried out in the presence of AIBN (0.04 mol L−1) initiator, in a Parr reactor equipped (Parr Instrument Co., USA) with a digital pressure transducer, temperature controller, mechanical stirrer at 50 °C at different oxygen pressures (10, 25, 50, 100, 150, 200 and 300 psi). The O2 consumption was measured as a function of time using a pressure transducer. Polyperoxide was separated from the reaction mixture by precipitating it with petroleum ether. It was isolated as a sticky material after repeated precipitation from chloroform solution followed by the removal of the solvent by vacuum drying at room temperature. As an example, polymerization of AEMA (15.0 g) at 50 °C under 100 psi oxygen pressure in the presence of AIBN (98.5 mg) gave 2.22 g PAEMAP (yield: 14.8%) after 86 h. CAUTION!! Polyperoxide polymers should be handled with extreme care to avoid explosive decomposition and should be stored in the dark and in a refrigerator to minimize degradation.
Horseradish peroxidaseenzyme was dissolved in D2O to yield solutions of known concentrations. PAEMAP (4 mg) was dissolved in 600 μL DMSO-d6 and to this solution 20 μL enzyme solution in D2O was added to obtain a desired PAEMAP/HRP (weight/weight) mixture. Degradation was monitored by 1H NMR spectroscopy at room temperature (26 °C).
Cell toxicity of polyperoxides
The cytotoxicity of PAEMAP was investigated using a MTT reduction assay. HeLa cells were seeded at a density of 1 × 10⁶cells/well in a 24 well plate and incubated for 24 h to reach ∼80% confluency. Cells were treated with various amounts of PAEMAP (15 μg mL−1 to 240 μg mL−1 with two fold serial double dilution and dissolved in 20 μL of DMSO) and incubated for 3 days. A set of untreated control cells and a set of only DMSO treated (20 μL) cells were also incubated for the same time period. While the polyperoxide treatment was performed in triplicates, the untreated control and the only DMSO treatment were done in duplicates. To each well, 100 μL of 5 mg mL−1 MTT solution was added and was incubated for 4 h. After incubation, the cell culture medium was disposed of, and 1 mL of DMSO was added to the cells to dissolve the resulting formazan crystals. After 10 min of incubation, the absorbance at 570 nm was measured with five-fold dilution. For each concentration, untreated control and only DMSO treated cells, one single set was grown on poly-D-lysine (molecular weight: 70![[thin space (1/6-em)]](https://www.rsc.org/images/entities/char_2009.gif) 000 to 150
000 to 150![[thin space (1/6-em)]](https://www.rsc.org/images/entities/char_2009.gif) 000 g mol−1) treated coverslips (Blue Star, 12 mm diameter), inside the 24 well plate. After post incubation, these cells were fixed with 4% paraformaldehyde and then stained with DAPI. Finally, it was used for microscopy (Olympus IX-81).
000 g mol−1) treated coverslips (Blue Star, 12 mm diameter), inside the 24 well plate. After post incubation, these cells were fixed with 4% paraformaldehyde and then stained with DAPI. Finally, it was used for microscopy (Olympus IX-81).
Results and discussion
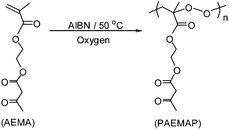
To understand the effect of O2 pressure, oxidation of AEMA (Scheme 1) was carried out in the presence of AIBN as radical source at different O2 pressures (10–300 psi), keeping the temperature constant (50 °C). Fig. 1 displays oxygen uptake (Δp) as a function of time for AEMAoxidation at different O2 pressures (10, 50, 100, and 300 psi) at 50 °C. The rate of polymerization (Rp) was calculated from the slope of the oxygen consumption against time plot and listed in Table 1. All the polymerization starts after an induction period of 18–18.5 h, and thereafter the rate is independent of O2 pressure at the studied pressure range (10–300 psi). For the reaction at 10 psi initial oxygen pressure, we carried out the polymerization until pressure dropped to 1 psi. It was reported earlier that styreneoxidation at 50 °C becomes independent of O2 pressure above 2 psi and the main product is polystyreneperoxide.24 However, the saturation pressure of O2 for α-methylstyrene (AMS) oxidation is 280 psi.25 For AMS, a tertiary radical [–CH2–(C6H5)(CH3)C˙] is formed, and in styrene, a secondary radical [–CH2–(C6H5)CH˙] is formed. The tertiary free radical being more stable than the secondary radical, higher O2 pressure is needed for the oxidation of AMS. In the case of AEMA, the tertiary radical [–CH2–(COOCH2CH2OCOCH2COCH3)(CH3)C˙] formed is even less stable than the secondary radical [–CH2–(C6H5)CH˙] from styrene. This is because of the electron withdrawing group present in the AEMA side chain. As a result, AEMAoxidation at 50 °C does not depend on O2 pressure after 1 psi.
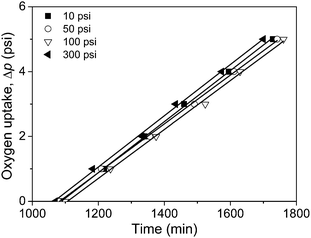 |
| | Fig. 1 Fall of O2 pressure as a function of time for AEMAoxidation at 50 °C under different O2 pressures. | |
Table 1 Characteristics of PAEMAP synthesized at different oxygen pressures at 50 °Ca
| O2 Pressure (psi) |
Time (h) |
Conv.b (%) |
R
p × 107 (mol l−1 s−1) |
M
n
(g mol−1) |
PDIc |
|
[AEMA] = 5.2 mol L−1, [AIBN] = 0.04 mol L−1.
Monomer conversion as determined by gravimetric analysis on the basis of the amount of monomer feed.
Determined by gel permeation chromatography in tetrahydrofuran with conventional calibration based on polystyrene standards.
|
| 10 |
42 |
9.4 |
3.37 |
3220 |
1.9 |
| 25 |
84 |
17.5 |
3.57 |
4030 |
1.8 |
| 50 |
88 |
16.0 |
3.22 |
3800 |
2.1 |
| 100 |
86 |
14.8 |
3.23 |
3360 |
2.0 |
| 150 |
88 |
15.2 |
3.35 |
2800 |
2.0 |
| 200 |
90 |
18.0 |
3.57 |
3760 |
2.2 |
| 300 |
88 |
15.6 |
3.38 |
2950 |
1.9 |
The number average molecular weight (Mn) of PAEMAP was found to be 2800 to 4030 g mol−1. This class of polymers undergo facile degradation during their synthesis and generate chain transfer agents (such as alcohols, aldehydes, ketones), which react with the propagating radicals resulting in low molecular weight.25 The Mn and molecular weight distribution (PDI) values for PAEMAP synthesized at different oxygen pressures at 50 °C are shown in Table 1. Elemental analysis was carried out for PAEMAP. The experimental values (C, 48.30%; H, 5.60%; O, 46.10%) are in good agreement with the calculated values (C, 48.78%; H, 5.73%; O, 45.49%) for C10H14O7 indicating a 1![[thin space (1/6-em)]](https://www.rsc.org/images/entities/char_2009.gif) :
:![[thin space (1/6-em)]](https://www.rsc.org/images/entities/char_2009.gif) 1 copolymeric structure of PAEMAP.
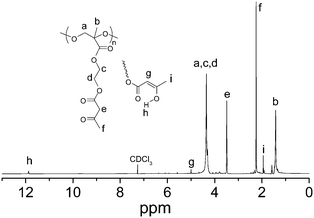
The 1H NMR spectrum of PAEMAP in CDCl3 (Fig. 2) showed resonance signals at 1.29–1.49 and 4.22–4.47 ppm, which were assigned to α-methyl and main chain methyleneprotons, respectively. Methyleneprotons in the side chain (–O–CH2–CH2–O–) also appeared at 4.22–4.47 ppm. The methylene signal in the main chain is shifted to downfield, due to two oxygen atoms directly attached to methyleneprotons. The methylene and methylprotons adjacent to the acetoacetoxygroup of PAEMAP showed resonance signals at 3.48 and 2.24 ppm, respectively. Adjacent acetoacetoxygroups of PAEMAP show two small peaks at δ = 1.94, 5.0 and 11.87 ppm due to the presence of enol tautomer.26 The integration ratio of the peak at 3.48 ppm (2H) to the peak at 5.0 ppm (1H) was 0.93, indicating acetoacetoxygroups of PAEMAP exist in the form of the keto tautomer. PAEMAhomopolymers prepared via reversible addition–fragmentation chain transfer polymerization showed ∼92% keto tautomer.26 Note that the 1H NMR spectrum of PAEMAP in Fig. 2 suggests that the PAEMAhomopolymer impurities are absence (no peaks for backbone α-methyl and main chain –CH2protons from PAEMA)12 during oxidative polymerization of AEMA at 50 °C at 10–300 psi oxygen pressure.
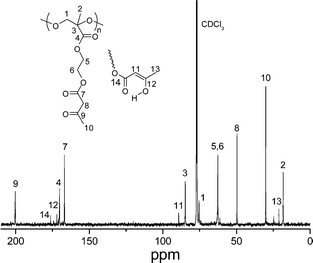
The 13C NMR spectrum of PAEMAP in Fig. 3 shows signals corresponding to the ten carbons present in the polyperoxide. Methylcarbon attached to chiral centre, methylcarbon of acetoacetoxygroup, and methylenecarbon of acetoacetoxygroup appears at 18.2, 30.2, and 49.7 ppm, respectively. Peaks at 62.6–62.8, 75.5, and 85.0 ppm are assigned to the ethylene carbons of ethylene oxide unit, methylenecarbon adjacent to the peroxidegroup, and chiral carbon, respectively. The resonance signals at 167.0, 170.2 and 200.3 ppm corresponds to ketonic carbon of acetoacetoxy attached with ethylene oxide, carbon of keto group adjacent to chiral carbon and ketonic carbon adjacent with methyl group, respectively. We also found signals at 21.2, 89.3, 172.1, and 176.3 ppm due to the presence of enol tautomer. Considerable downfield shift of the backbone carbons is observed due to the two more electronegative oxygen atoms directly bonded to the polymer main chain.
The FTIR spectrum of PAEMAP (Fig. S1 in the supporting information†) shows a strong band near 1744 cm−1 which is assigned to the carbonyl groups (C
1 copolymeric structure of PAEMAP.
The 1H NMR spectrum of PAEMAP in CDCl3 (Fig. 2) showed resonance signals at 1.29–1.49 and 4.22–4.47 ppm, which were assigned to α-methyl and main chain methyleneprotons, respectively. Methyleneprotons in the side chain (–O–CH2–CH2–O–) also appeared at 4.22–4.47 ppm. The methylene signal in the main chain is shifted to downfield, due to two oxygen atoms directly attached to methyleneprotons. The methylene and methylprotons adjacent to the acetoacetoxygroup of PAEMAP showed resonance signals at 3.48 and 2.24 ppm, respectively. Adjacent acetoacetoxygroups of PAEMAP show two small peaks at δ = 1.94, 5.0 and 11.87 ppm due to the presence of enol tautomer.26 The integration ratio of the peak at 3.48 ppm (2H) to the peak at 5.0 ppm (1H) was 0.93, indicating acetoacetoxygroups of PAEMAP exist in the form of the keto tautomer. PAEMAhomopolymers prepared via reversible addition–fragmentation chain transfer polymerization showed ∼92% keto tautomer.26 Note that the 1H NMR spectrum of PAEMAP in Fig. 2 suggests that the PAEMAhomopolymer impurities are absence (no peaks for backbone α-methyl and main chain –CH2protons from PAEMA)12 during oxidative polymerization of AEMA at 50 °C at 10–300 psi oxygen pressure.
The 13C NMR spectrum of PAEMAP in Fig. 3 shows signals corresponding to the ten carbons present in the polyperoxide. Methylcarbon attached to chiral centre, methylcarbon of acetoacetoxygroup, and methylenecarbon of acetoacetoxygroup appears at 18.2, 30.2, and 49.7 ppm, respectively. Peaks at 62.6–62.8, 75.5, and 85.0 ppm are assigned to the ethylene carbons of ethylene oxide unit, methylenecarbon adjacent to the peroxidegroup, and chiral carbon, respectively. The resonance signals at 167.0, 170.2 and 200.3 ppm corresponds to ketonic carbon of acetoacetoxy attached with ethylene oxide, carbon of keto group adjacent to chiral carbon and ketonic carbon adjacent with methyl group, respectively. We also found signals at 21.2, 89.3, 172.1, and 176.3 ppm due to the presence of enol tautomer. Considerable downfield shift of the backbone carbons is observed due to the two more electronegative oxygen atoms directly bonded to the polymer main chain.
The FTIR spectrum of PAEMAP (Fig. S1 in the supporting information†) shows a strong band near 1744 cm−1 which is assigned to the carbonyl groups (C![[double bond, length as m-dash]](https://www.rsc.org/images/entities/char_e001.gif) O stretching) present in the repeat unit. The very intense band at 1150 cm−1 is due to the C–O stretching of PAEMAP. The weak band at 1040 cm−1 is due to the characteristic O–O bond stretching. The absorption bands appearing in the region 2960–3000 cm−1 are assigned to the aliphatic C–H stretching modes. The broad intense band centred at 3460 cm−1 is attributed to the hydroxyl and hydroperoxide end groups. The formation of these end groups (OH and OOH) via various chain transfer mechanisms is known.27
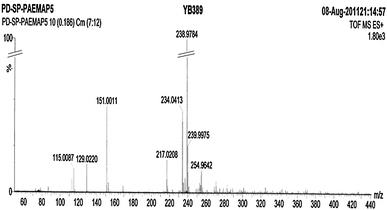
In the literature, the ESI-MS technique was applied for the characterization of polymerdegradation.28 The ESI mass spectrum of PAEMAP (Fig. 4) in the positive mode gives molecular ion peaks presented in Table 2. Like all other vinyl polyperoxides, for the PAEMAP, the initiation of degradation occurs at the weak O–O bond in the backbone. Formation of all the molecular ions could be explained by considering the cleavage of the O–O bond followed by the chain unzipping mechanism (Scheme S1 in the supporting information†).
O stretching) present in the repeat unit. The very intense band at 1150 cm−1 is due to the C–O stretching of PAEMAP. The weak band at 1040 cm−1 is due to the characteristic O–O bond stretching. The absorption bands appearing in the region 2960–3000 cm−1 are assigned to the aliphatic C–H stretching modes. The broad intense band centred at 3460 cm−1 is attributed to the hydroxyl and hydroperoxide end groups. The formation of these end groups (OH and OOH) via various chain transfer mechanisms is known.27
In the literature, the ESI-MS technique was applied for the characterization of polymerdegradation.28 The ESI mass spectrum of PAEMAP (Fig. 4) in the positive mode gives molecular ion peaks presented in Table 2. Like all other vinyl polyperoxides, for the PAEMAP, the initiation of degradation occurs at the weak O–O bond in the backbone. Formation of all the molecular ions could be explained by considering the cleavage of the O–O bond followed by the chain unzipping mechanism (Scheme S1 in the supporting information†).
Table 2 The molecular ions identified in the ESI-MS of PAEMAP
| Structure |
m/z |
|
Observed as MH+.
|

|
115 |

|
129 |

|
152a |

|
216a |

|
234 |

|
239 |

|
255 |
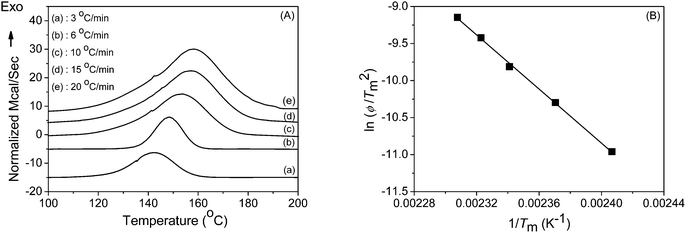
The DSC thermograms of PAEMAP at different heating rates under nitrogen, shown in Fig. 5A, reveal a highly exothermic degradation. The average enthalpy of degradation (ΔHd) at various heating rates (ϕ) was found to be −40.5 kcal mol−1, after applying corrections for the heat of vaporization of formaldehyde and 2-(2-oxopropanoyloxy)ethyl 3-oxobutanoate (A in Scheme 2) by using the thermochemical data given in Table 3. The exothermic degradation is generally observed in all polyperoxides due to the decomposition of the main chain O–O bonds followed by the unzipping to form the degradation products, which have lower enthalpy of formation compared to the parent polymer.29 From the peak temperatures (Tm), using Kissinger's method,30 the activation energy for the degradation (Ed) was determined. From the slope of the plot of ln(ϕ/Tm2) against 1/Tm (Fig. 5B), the Ed value was found to be 36.2 kcal mol−1, which compares well with the dissociation energy of the O–O bond in dialkyl peroxides31 and polyperoxides.32 The glass-transition temperature (Tg) of PAEMAP was measured as −24 °C under nitrogen atmosphere at a heating rate of 10 °C min−1. The lower Tg value of PAEMAP is due to the labile peroxy bonds (–O–O–) in the backbone. The TGA (Fig. S2 in the supporting information†) profile of PAEMAP, performed at the heating rate of 10 °C min−1, showed two major degradation stages. The first stage appearing between 138–190 °C could be attributed to the decomposition of –O–O– links in the polymer backbone. The residual degradation products were then further decomposed at the last stage beyond 190 °C.
 |
| | Fig. 5
DSC studies with PAEMAP; (A) thermograms at different heating rates (3, 6, 10, 15 and 20 °C min−1) and (B) Kissinger's plot of ln(ϕ/Tm2) against 1/Tm. | |
 |
| | Scheme 2 Mechanism of formation of degradation products from PAEMAP. | |
Table 3 Thermochemical data (Joback method35)
| Compound |
ΔH°f (kcal mol−1) |
ΔH°v (kcal mol−1) |
| Value |
Reference |
Value |
Reference |
|
AEMA
|
−180.6 |
This work |
|
|
| A (Scheme 2) |
−225.4 |
This work |
16.1 |
This work |
|
Formaldehyde (g) |
−27.7 |
36,37
|
5.9 |
37
|
|
PAEMAP
|
−201.5 |
This work |
|
|
On the basis of the degradation product analysis by ESI-MS and the Ed values for the degradation process (corresponding to the cleavage of the O–O bond), a radical chain scission mechanism could be proposed (Scheme 2) for the degradation of PAEMAP. The highly exothermic degradation of PAEMAP observed in the DSC is supported by the thermochemical calculations. The heat of degradation (ΔH°d) of PAEMAP was theoretically evaluated, by computing the heat of formation (ΔH°f) of PAEMAP. It was estimated from the heat of polymerization (ΔH°p) of PAEMAP. The PAEMAP is obtained by the polymerization of AEMA with O2 as shown below:| | | n AEMA + n O2 → PAEMAP + ΔH°p | (1) |
During the above polymerization process, one O![[double bond, length as m-dash]](https://www.rsc.org/images/entities/char_e001.gif) O and one C
O and one C![[double bond, length as m-dash]](https://www.rsc.org/images/entities/char_e001.gif) C bond are broken to form one C–C, one O–O and two C–O bonds. The ΔH°p of PAEMAP was calculated to be 20.9 kcal mol−1, using the bond energy data in Table 3. The ΔH°p dependence on structural factors and literature report indicates that experimental ΔH°p values are generally 5–7 kcal mol−1 less than the theoretical ΔH°p.33 Taking into account the structural factors (6.3 kcal mol−1)34 for polymerization of AEMA, we have therefore taken the actual ΔH°p value of PAEMAP as 14.6 kcal mol−1. The calculated ΔH°p of PAEMAP is −201.5 kcal mol−1, using the actual ΔH°p value of PAEMAP and the ΔH°f value of AEMA. The value of ΔH°d for PAEMAP was calculated by two different procedures.
C bond are broken to form one C–C, one O–O and two C–O bonds. The ΔH°p of PAEMAP was calculated to be 20.9 kcal mol−1, using the bond energy data in Table 3. The ΔH°p dependence on structural factors and literature report indicates that experimental ΔH°p values are generally 5–7 kcal mol−1 less than the theoretical ΔH°p.33 Taking into account the structural factors (6.3 kcal mol−1)34 for polymerization of AEMA, we have therefore taken the actual ΔH°p value of PAEMAP as 14.6 kcal mol−1. The calculated ΔH°p of PAEMAP is −201.5 kcal mol−1, using the actual ΔH°p value of PAEMAP and the ΔH°f value of AEMA. The value of ΔH°d for PAEMAP was calculated by two different procedures.
1. The heat change during the degradation (ΔH°d) was theoretically calculated by using (eqn (2)) and ΔH°f values from Table 3. It was found to be −35.9 kcal mol−1 after corrections for the heat of vaporization of the products using the data given in Table 3.
| | ΔH°f(PAEMAP) → ΔH°f(CH3COCOOCH2CH2OCOCH2COCH3) + ΔH°f(CH2![[double bond, length as m-dash]](https://www.rsc.org/images/entities/char_e001.gif) O) + ΔH°d O) + ΔH°d | (2) |
2. The value of ΔH°d was calculated from the bond dissociation energies in Table 4. During the degradation process of PAEMAP, one C–C and one O–O bonds are broken and two C–O bonds are converted into two C![[double bond, length as m-dash]](https://www.rsc.org/images/entities/char_e001.gif) O bonds, and formaldehyde and 2-(2-oxopropanoyloxy)ethyl 3-oxobutanoate are vaporized. The calculated ΔH°d value for PAEMAPdegradation in this process is −37.2 kcal mol−1.
O bonds, and formaldehyde and 2-(2-oxopropanoyloxy)ethyl 3-oxobutanoate are vaporized. The calculated ΔH°d value for PAEMAPdegradation in this process is −37.2 kcal mol−1.
Table 4 Bond energy data
A mean value of −36.55 kcal mol−1 was taken for ΔH°d of PAEMAP from the values of ΔH°d obtained by the above two methods (−35.9 and −37.2 kcal mol−1). The calculated value of ΔH°d for PAEMAP suggests that the degradation process should be exothermic in nature. The calculated ΔH°d for PAEMAP is in good agreement with the experimental value (−40.5 kcal mol−1), demonstrating the acceptability of the proposed degradation mechanism. The small difference between the theoretical and experimental value of ΔH°d may arise from: (a) the approximation involved in the thermochemical input data, and (b) the occurrence of side reactions during the PAEMAPdegradation.
In vitro enzymatic degradation of PAEMAP
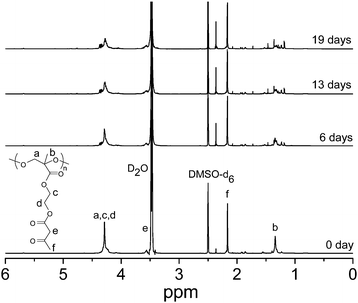
Enzymatic degradation of PAEMAP was carried out using HRP redoxenzyme. The dioxygen bound to HRP has a considerable superoxide character40 and acts on hydrogen peroxide (H2O2) and/or alkyl peroxide as an oxidant.41 Since PAEMAP was not soluble in water, we have studied biodegradation in DMSO at room temperature (26 °C). DMSO has been shown to be a very capable solvent to perform biocatalysis with HRP enzyme at room temperature.42Fig. 6 shows a typical biodegradation profile of PAEMAP by the HRP at different times, which showed the intensity of the degradation product peak (for 2-(2-oxopropanoyloxy)ethyl 3-oxobutanoate in Scheme 2; CH3–C(O)–C(O)–O– peak at 2.37 ppm) increases as the reaction time increases. The main chain –O–O–CH2– protons appeared at 4.20–4.34 ppm along with side chain ethylene oxide –CH2protons. The area under this peak decreases with increasing time because of the decomposition of the main chain. The formation of 2-(2-oxopropanoyloxy)ethyl 3-oxobutanoate after degradation of PAEMAP once again indicates that HRP mediated decomposition of PAEMAP occurs via the cleavage of –O–O– links in the main chain and favours a unimolecular decomposition pathway. The other degradation product, formaldehyde, is a gas at room temperature.
 |
| | Fig. 6
1H NMR spectra of PAEMAP in the presence of HRP at different time intervals: (a) 0 day, (b) 6 days, (c) 13 days, and (d) 19 days; PAEMAP/HRP = 20![[thin space (1/6-em)]](https://www.rsc.org/images/entities/char_2009.gif) : :![[thin space (1/6-em)]](https://www.rsc.org/images/entities/char_2009.gif) 1 by weight. 1 by weight. | |
The % of decomposition for PAEMAP was determined from the comparison of integration values at 4.20–4.34 ppm (a, c, and d protons) in the polymer with respect to integration values of DMSO-d6protons (2.5 ppm) as a standard. As can be seen in Fig. 6 the % decomposition increases with time (PAEMAP/HRP = 20![[thin space (1/6-em)]](https://www.rsc.org/images/entities/char_2009.gif) :
:![[thin space (1/6-em)]](https://www.rsc.org/images/entities/char_2009.gif) 1 by weight); 16.4, 23.7, 36.5, 47.5, and 91.4% decompositions were found after 1, 2, 6, 9 and 19 days, respectively. Our PAEMAPdegradation result matches well with the reported HRP catalyzed decomposition of 1,3-diene derivative based polyperoxides, where ∼46% degradation in ethanol-d6 at 30 °C was observed after 3 days (polyperoxide/HRP = 20
1 by weight); 16.4, 23.7, 36.5, 47.5, and 91.4% decompositions were found after 1, 2, 6, 9 and 19 days, respectively. Our PAEMAPdegradation result matches well with the reported HRP catalyzed decomposition of 1,3-diene derivative based polyperoxides, where ∼46% degradation in ethanol-d6 at 30 °C was observed after 3 days (polyperoxide/HRP = 20![[thin space (1/6-em)]](https://www.rsc.org/images/entities/char_2009.gif) :
:![[thin space (1/6-em)]](https://www.rsc.org/images/entities/char_2009.gif) 1 by weight).43 We also prepared the homopolymer, PAEMA (Mn = 6500 g mol−1, Mw/Mn = 1.47), by reversible addition–fragmentation chain transfer (RAFT) radical polymerization of AEMA as described in the previous literature44 using 4-cyano-4-methyl-4-thiobenzoylsulfanyl butyric acid as RAFT chain transfer agent (supporting information†) at 70 °C in N,N-dimethylformamide. HRP catalyzed reaction of PAEMA (PAEMA/HRP = 10
1 by weight).43 We also prepared the homopolymer, PAEMA (Mn = 6500 g mol−1, Mw/Mn = 1.47), by reversible addition–fragmentation chain transfer (RAFT) radical polymerization of AEMA as described in the previous literature44 using 4-cyano-4-methyl-4-thiobenzoylsulfanyl butyric acid as RAFT chain transfer agent (supporting information†) at 70 °C in N,N-dimethylformamide. HRP catalyzed reaction of PAEMA (PAEMA/HRP = 10![[thin space (1/6-em)]](https://www.rsc.org/images/entities/char_2009.gif) :
:![[thin space (1/6-em)]](https://www.rsc.org/images/entities/char_2009.gif) 1 by weight) at 26 °C did not show any degradation even after 20 days. These results suggest that incorporation of –O–O– links in the main chain favours enzymatic degradation of PAEMAP.
1 by weight) at 26 °C did not show any degradation even after 20 days. These results suggest that incorporation of –O–O– links in the main chain favours enzymatic degradation of PAEMAP.
Cellular cytotoxicity assessment of PAEMAP
It is significant to study the biocompatibility behaviour of PAEMAP, because this type of polymer has potential applications in plastic waste management,16 as curing agents,17etc. We evaluated the cytotoxicity of PAEMAP in HeLa cells by MTT assay. HeLa cells were incubated with various amounts of PAEMAP, a set of untreated control and another set of DMSO treated control for 72 h. Fig. 7 shows the comparison of cytotoxicity between PAEMAP, untreated and DMSO treated control at various concentrations after 72 h indicating an excellent non-toxicity profile of PAEMAP up to 240 μg mL−1 concentration.
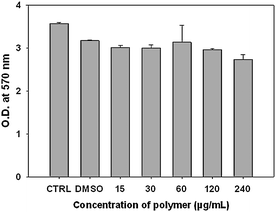 |
| | Fig. 7 Cytotoxicity of PAEMAP on HeLa cells. For each concentration of PAEMAP, the bar height shows the mean value of the three data sets and the error bar indicates the highest of the three values. For untreated control (mentioned as “CTRL” in the graph) and DMSO control (mentioned as DMSO in the graph), the bar height shows the mean value of two data sets and the error bar indicates the highest of the two values. | |
Fig. 8 shows the fluorescence microscopic images of HeLa cells of untreated, DMSO treated and PAEMAP treated cells. DAPI images (column 1 of Fig. 8) show that compared to control sets, there was no change in nuclear structure of the DMSO and compound treated cells. Phase contrast images (column 2 of Fig. 8) of cells confirm the morphological integrity of cells among both sets of control cells and polyperoxide treated cells. It can be seen from Fig. 8 that most of the HeLa cells were living and the cells grew very well in the pure culture media and in the media containing PAEMAP indicating low and negligible cytotoxicity of PAEMAP up to 240 μg mL−1. It may be noted that formaldehyde, one of the degradation products of PAEMAP, is a highly toxic compound to most living organisms.45 Although we did not observe any in vitro cytotoxicity of PAEMAP, in vivo toxicity might be observed under physiological conditions.
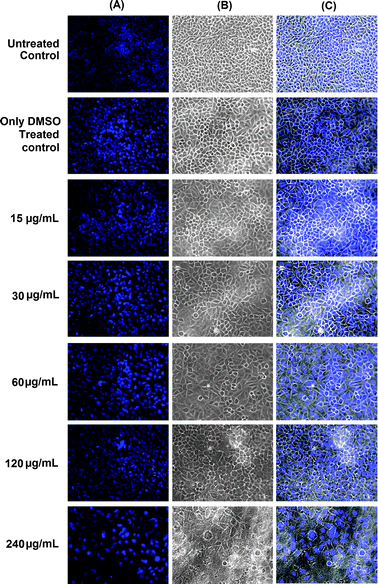 |
| | Fig. 8 Fluorescence and phase contrast micrographs of HeLa cells treated with different concentrations of PAEMAP. Images were taken at 72 h post-incubation of PAEMAP treatment. Column A shows the DAPI stained fluorescence images of the nuclei of the HeLa cells. Column B shows the phase contrast images of the cells and column C shows the merged images of columns A and B. Rows 1 and 2 show the images of untreated control and DMSO treated control, respectively. | |
Conclusions
The oxidation of AEMA at 50 °C becomes independent of O2 pressure above 1 psi and the main product is poly[2-(acetoacetoxy)ethyl methacrylate]peroxide (PAEMAP). The 1![[thin space (1/6-em)]](https://www.rsc.org/images/entities/char_2009.gif) :
:![[thin space (1/6-em)]](https://www.rsc.org/images/entities/char_2009.gif) 1 alternating copolymeric structure of PAEMAP has been elucidated spectroscopically and by elemental analysis. A radical chain-scission mechanism for the degradation of PAEMAP has been proposed based on the analysis of its degradation products by ESI-MS studies and kinetic studies by DSC. PAEMAP shows a highly exothermic heat of degradation, and degradation is controlled by the dissociation of the peroxide (–O–O–) bond in the polymer backbone. The exothermic degradation mechanism has been substantiated by thermochemical calculations. PAEMAP undergoes facile HRP catalysed degradation and the polymer is found to be non-toxic to HeLa cells indicating good biocompatibility of PAEMAP. Polymerization of varieties of vinyl monomers using PAEMAP as radical initiator and preparation of degradable polyperoxide–metal complexes using PAEMAP are under progress.
1 alternating copolymeric structure of PAEMAP has been elucidated spectroscopically and by elemental analysis. A radical chain-scission mechanism for the degradation of PAEMAP has been proposed based on the analysis of its degradation products by ESI-MS studies and kinetic studies by DSC. PAEMAP shows a highly exothermic heat of degradation, and degradation is controlled by the dissociation of the peroxide (–O–O–) bond in the polymer backbone. The exothermic degradation mechanism has been substantiated by thermochemical calculations. PAEMAP undergoes facile HRP catalysed degradation and the polymer is found to be non-toxic to HeLa cells indicating good biocompatibility of PAEMAP. Polymerization of varieties of vinyl monomers using PAEMAP as radical initiator and preparation of degradable polyperoxide–metal complexes using PAEMAP are under progress.
Acknowledgements
This work was supported by grants from Indian Institute of Science Education and Research-Kolkata (IISER-Kolkata) and Council of Scientific and Industrial Research (CSIR), New Delhi [01(2474)/11/EMR-II]. Sunirmal Pal and Amit Das acknowledge CSIR, Government of India for their fellowships.
Notes and references
- C. Guerrero-Sanchez, B. G. G. Lohmeijer, M. A. R. Meier and U. S. Schubert, Macromolecules, 2005, 38, 10388–10396 CrossRef CAS
 .
.
- M. Chiper, M. A. R. Meier, D. Wouters, S. Hoeppener, C.-A. Fustin, J.-F. Gohy and U. S. Schubert, Macromolecules, 2008, 41, 2771–2777 CrossRef CAS
 .
.
- S. Kelch and M. Rehahn, Macromolecules, 1997, 30, 6185–6193 CrossRef CAS
 .
.
- W. E. Jones Jr., S. M. Baxter, G. F. Strouse and T. J. Meyer, J. Am. Chem. Soc., 1993, 115, 7363–7373 CrossRef
 .
.
- K. A. Aamer, W. H. De Jeu and G. N. Tew, Macromolecules, 2008, 41, 2022–2029 CrossRef CAS
 .
.
- J. Serin, X. Schultze, A. Adronov and J. M. J. Fréchet, Macromolecules, 2002, 35, 5396–5404 CrossRef CAS
 .
.
- T. Kajita, R. M. Leasure, M. Devenney, D. Friesen and T. J. Meyer, Inorg. Chem., 1998, 37, 4782–4794 CrossRef CAS
 .
.
- Y. Chujo, K. Sada and T. Saegusa, Macromolecules, 1993, 26, 6320–6323 CrossRef CAS
 .
.
-
R. C. Mehrotra, R. Bohra and D. P. Gaur, Metal β-Diketonates and Allied Derivatives, Academic Press, New York, 1978 Search PubMed
 .
.
- R. Sigel, T. Krasia-Christoforou, I. Below and H. Schlaad, Macromolecules, 2009, 42, 4257–4261 CrossRef CAS
 .
.
- K. Krishnankutty, M. B. Ummathur and P. Ummer, J. Serb. Chem. Soc., 2009, 74, 1273–1282 CrossRef CAS
 .
.
- H. Schlaad, T. Krasia and M. Antonietti, J. Am. Chem. Soc., 2004, 126, 11307–11310 CrossRef CAS
 .
.
- T. Kaliyappan and P. Kannan, Prog. Polym. Sci., 2000, 25, 343–370 CrossRef CAS
 .
.
- H. Cölfen, Macromol. Rapid Commun., 2001, 22, 219–252 CrossRef
 .
.
- K. A. Cychosz and A. J. Matzger, Langmuir, 2010, 26, 17198–17202 CrossRef CAS
 .
.
-
(a) K. Subramanian, Polym. Rev., 2003, 43, 323–383 Search PubMed
 ;
(b) T. Mukundan and K. Kishore, Prog. Polym. Sci., 1990, 15, 475–505 CrossRef CAS
  ;
(c) M. M. Mogilevich, Russ. Chem. Rev., 1979, 48, 199–211 CrossRef
  .
.
- K. Subramanian and K. Kishore, Eur. Polym. J., 1997, 33, 1365–1367 CrossRef CAS
 .
.
- E. Sato, H. Tamura and A. Matsumoto, ACS Appl. Mater. Interfaces, 2010, 2, 2594–2601 CAS
 .
.
- K. S. Minsker, V. V. Lisitsky, S. V. Kolesov and G. E. Zaikov, J. Macromol. Sci. Rev. Macromol. Chem., 1981, 20, 243–308 Search PubMed
 .
.
-
(a) A. K. Nanda and K. Kishore, Macromolecules, 2001, 34, 1558–1563 CrossRef CAS
 ;
(b) K. Subramanian, K. S. Murthy and K. Kishore, Polymer, 1997, 38, 527–533 CrossRef CAS
  ;
(c) T. Mukundan, V. A. Bhanu and K. Kishore, J. Chem. Soc., Chem. Commun., 1989, 780–781 RSC
  .
.
- K. Kishore and T. Mukundan, Nature, 1986, 324, 130–131 CrossRef CAS
 .
.
- H. Staudinger, Angew. Chem., 1922, 35, 657–659 CrossRef CAS
 .
.
- Unpublished results.
- P. De and D. N. Sathyanarayana, Macromol. Chem. Phys., 2002, 203, 2218–2224 CrossRef CAS
 .
.
- K. Kishore, S. Paramasivam and T. E. Sandhya, Macromolecules, 1996, 29, 6973–6978 CrossRef CAS
 .
.
- H. Schlaad, T. Krasia and C. S. Patrickios, Macromolecules, 2001, 34, 7585–7588 CrossRef CAS
 .
.
- K. Ganesh, S. Paramasivam and K. Kishore, Polym. Bull., 1996, 37, 785–790 CrossRef CAS
 .
.
- K. E. Al Ani and A. E. Ramadhan, Polym. Degrad. Stab., 2008, 93, 1590–1596 CrossRef CAS
 .
.
- A. K. Nanda and K. Kishore, Macromol. Chem. Phys., 2001, 202, 2155–2160 CrossRef CAS
 .
.
- H. E. Kissinger, Anal. Chem., 1957, 29, 1702–1706 CrossRef CAS
 .
.
-
G. Scott, Atmospheric Oxidations and Antioxidants, Elsevier, London and New York, 1965, p 37 Search PubMed
 .
.
- P. De and D. N. Sathyanarayana, Macromol. Chem. Phys., 2002, 203, 420–426 CrossRef CAS
 .
.
- P. De, D. N. Sathyanarayana, P. Sadasivamurthy and S. Sridhar, J. Appl. Polym. Sci., 2003, 88, 2364–2368 CrossRef CAS
 .
.
- P. De, D. N. Sathyanarayana, P. Sadasivamurthy and S. Sridhar, Polymer, 2001, 42, 8587–8593 CrossRef CAS
 .
.
- K. G. Joback and R. C. Reid, Chem. Eng. Commun., 1987, 57, 233–243 CrossRef CAS
 .
.
-
R. C. ed.Weast, CRC Handbook of Chemistry and Physics, 59th ed., CRC Press, Cleveland, 1978 Search PubMed
 .
.
-
M. Kh. Karapetyants and M. L. Karapetyants, Thermodynamic Constants of Inorganic and Organic Compounds, translated by J. Schmorak, Ann Arbor-Humphrey Science, Ann Arbor, MI, London, 1970 Search PubMed
 .
.
-
J. D. Roberts and M. C. Caserio, Modern Organic Chemistry, Benjamin, New York, 1967 Search PubMed
 .
.
-
J. A. Dean, Ed. Lange's Handbook of Chemistry, 11th ed., McGraw-Hill, New York, 1973 Search PubMed
 .
.
- H. E. Van Wart and J. Zimmer, J. Biol. Chem., 1985, 260, 8372–8377 CAS
 .
.
- G. R. Schonbaum and S. Lo, J. Biol. Chem., 1972, 247, 3353–3360 CAS
 .
.
- A. M. Azevedo, D. M. F. Prazeres, J. M. S. Cabral and L. P. Fonseca, J. Mol. Catal. B: Enzym., 2001, 15, 147–153 CrossRef CAS
 .
.
- A. Matsumoto and S. Taketani, Chem. Lett., 2004, 33, 732–733 CrossRef CAS
 .
.
- T. Krasia, R. Soula, H. G. Börner and H. Schlaad, Chem. Commun., 2003, 538–539 RSC
 .
.
- R. Mitsui, M. Omori, H. Kitazawa and M. Tanaka, J. Biosci. Bioeng., 2005, 99, 18–22 CrossRef CAS
 .
.
Footnote |
| † Electronic Supplementary Information (ESI) available: Synthesis and characterization of PAEMA, FTIR spectrum (Fig. S1), TGA curve at a heating rate of 10 °C min−1 (Fig. S2) of PAEMAP and thermal degradation mechanism of PAEMAP (Scheme S1). See DOI: 10.1039/c1py00419k |
|
| This journal is © The Royal Society of Chemistry 2012 |
Click here to see how this site uses Cookies. View our privacy policy here. ![[thin space (1/6-em)]](https://www.rsc.org/images/entities/char_2009.gif) 000 to 150
000 to 150![[thin space (1/6-em)]](https://www.rsc.org/images/entities/char_2009.gif) 000 g mol−1) treated coverslips (Blue Star, 12 mm diameter), inside the 24 well plate. After post incubation, these cells were fixed with 4% paraformaldehyde and then stained with DAPI. Finally, it was used for microscopy (Olympus IX-81).
000 g mol−1) treated coverslips (Blue Star, 12 mm diameter), inside the 24 well plate. After post incubation, these cells were fixed with 4% paraformaldehyde and then stained with DAPI. Finally, it was used for microscopy (Olympus IX-81).

![[thin space (1/6-em)]](https://www.rsc.org/images/entities/char_2009.gif) :
:![[thin space (1/6-em)]](https://www.rsc.org/images/entities/char_2009.gif) 1 copolymeric structure of PAEMAP.
1 copolymeric structure of PAEMAP.
![[double bond, length as m-dash]](https://www.rsc.org/images/entities/char_e001.gif) O stretching) present in the repeat unit. The very intense band at 1150 cm−1 is due to the C–O stretching of PAEMAP. The weak band at 1040 cm−1 is due to the characteristic O–O bond stretching. The absorption bands appearing in the region 2960–3000 cm−1 are assigned to the aliphatic C–H stretching modes. The broad intense band centred at 3460 cm−1 is attributed to the hydroxyl and hydroperoxide end groups. The formation of these end groups (OH and OOH) via various chain transfer mechanisms is known.27
O stretching) present in the repeat unit. The very intense band at 1150 cm−1 is due to the C–O stretching of PAEMAP. The weak band at 1040 cm−1 is due to the characteristic O–O bond stretching. The absorption bands appearing in the region 2960–3000 cm−1 are assigned to the aliphatic C–H stretching modes. The broad intense band centred at 3460 cm−1 is attributed to the hydroxyl and hydroperoxide end groups. The formation of these end groups (OH and OOH) via various chain transfer mechanisms is known.27


![[double bond, length as m-dash]](https://www.rsc.org/images/entities/char_e001.gif) O and one C
O and one C![[double bond, length as m-dash]](https://www.rsc.org/images/entities/char_e001.gif) C bond are broken to form one C–C, one O–O and two C–O bonds. The ΔH°p of PAEMAP was calculated to be 20.9 kcal mol−1, using the bond energy data in Table 3. The ΔH°p dependence on structural factors and literature report indicates that experimental ΔH°p values are generally 5–7 kcal mol−1 less than the theoretical ΔH°p.33 Taking into account the structural factors (6.3 kcal mol−1)34 for polymerization of AEMA, we have therefore taken the actual ΔH°p value of PAEMAP as 14.6 kcal mol−1. The calculated ΔH°p of PAEMAP is −201.5 kcal mol−1, using the actual ΔH°p value of PAEMAP and the ΔH°f value of AEMA. The value of ΔH°d for PAEMAP was calculated by two different procedures.
C bond are broken to form one C–C, one O–O and two C–O bonds. The ΔH°p of PAEMAP was calculated to be 20.9 kcal mol−1, using the bond energy data in Table 3. The ΔH°p dependence on structural factors and literature report indicates that experimental ΔH°p values are generally 5–7 kcal mol−1 less than the theoretical ΔH°p.33 Taking into account the structural factors (6.3 kcal mol−1)34 for polymerization of AEMA, we have therefore taken the actual ΔH°p value of PAEMAP as 14.6 kcal mol−1. The calculated ΔH°p of PAEMAP is −201.5 kcal mol−1, using the actual ΔH°p value of PAEMAP and the ΔH°f value of AEMA. The value of ΔH°d for PAEMAP was calculated by two different procedures.
![[double bond, length as m-dash]](https://www.rsc.org/images/entities/char_e001.gif) O) + ΔH°d
O) + ΔH°d![[double bond, length as m-dash]](https://www.rsc.org/images/entities/char_e001.gif) O bonds, and formaldehyde and 2-(2-oxopropanoyloxy)ethyl 3-oxobutanoate are vaporized. The calculated ΔH°d value for PAEMAPdegradation in this process is −37.2 kcal mol−1.
O bonds, and formaldehyde and 2-(2-oxopropanoyloxy)ethyl 3-oxobutanoate are vaporized. The calculated ΔH°d value for PAEMAPdegradation in this process is −37.2 kcal mol−1.
![[thin space (1/6-em)]](https://www.rsc.org/images/entities/char_2009.gif) :
:![[thin space (1/6-em)]](https://www.rsc.org/images/entities/char_2009.gif) 1 by weight.
1 by weight.![[thin space (1/6-em)]](https://www.rsc.org/images/entities/char_2009.gif) :
:![[thin space (1/6-em)]](https://www.rsc.org/images/entities/char_2009.gif) 1 by weight); 16.4, 23.7, 36.5, 47.5, and 91.4% decompositions were found after 1, 2, 6, 9 and 19 days, respectively. Our PAEMAPdegradation result matches well with the reported HRP catalyzed decomposition of 1,3-diene derivative based polyperoxides, where ∼46% degradation in ethanol-d6 at 30 °C was observed after 3 days (polyperoxide/HRP = 20
1 by weight); 16.4, 23.7, 36.5, 47.5, and 91.4% decompositions were found after 1, 2, 6, 9 and 19 days, respectively. Our PAEMAPdegradation result matches well with the reported HRP catalyzed decomposition of 1,3-diene derivative based polyperoxides, where ∼46% degradation in ethanol-d6 at 30 °C was observed after 3 days (polyperoxide/HRP = 20![[thin space (1/6-em)]](https://www.rsc.org/images/entities/char_2009.gif) :
:![[thin space (1/6-em)]](https://www.rsc.org/images/entities/char_2009.gif) 1 by weight).43 We also prepared the homopolymer, PAEMA (Mn = 6500 g mol−1, Mw/Mn = 1.47), by reversible addition–fragmentation chain transfer (RAFT) radical polymerization of AEMA as described in the previous literature44 using 4-cyano-4-methyl-4-thiobenzoylsulfanyl butyric acid as RAFT chain transfer agent (supporting information†) at 70 °C in N,N-dimethylformamide. HRP catalyzed reaction of PAEMA (PAEMA/HRP = 10
1 by weight).43 We also prepared the homopolymer, PAEMA (Mn = 6500 g mol−1, Mw/Mn = 1.47), by reversible addition–fragmentation chain transfer (RAFT) radical polymerization of AEMA as described in the previous literature44 using 4-cyano-4-methyl-4-thiobenzoylsulfanyl butyric acid as RAFT chain transfer agent (supporting information†) at 70 °C in N,N-dimethylformamide. HRP catalyzed reaction of PAEMA (PAEMA/HRP = 10![[thin space (1/6-em)]](https://www.rsc.org/images/entities/char_2009.gif) :
:![[thin space (1/6-em)]](https://www.rsc.org/images/entities/char_2009.gif) 1 by weight) at 26 °C did not show any degradation even after 20 days. These results suggest that incorporation of –O–O– links in the main chain favours enzymatic degradation of PAEMAP.
1 by weight) at 26 °C did not show any degradation even after 20 days. These results suggest that incorporation of –O–O– links in the main chain favours enzymatic degradation of PAEMAP.

![[thin space (1/6-em)]](https://www.rsc.org/images/entities/char_2009.gif) :
:![[thin space (1/6-em)]](https://www.rsc.org/images/entities/char_2009.gif) 1 alternating copolymeric structure of PAEMAP has been elucidated spectroscopically and by elemental analysis. A radical chain-scission mechanism for the degradation of PAEMAP has been proposed based on the analysis of its degradation products by ESI-MS studies and kinetic studies by DSC. PAEMAP shows a highly exothermic heat of degradation, and degradation is controlled by the dissociation of the peroxide (–O–O–) bond in the polymer backbone. The exothermic degradation mechanism has been substantiated by thermochemical calculations. PAEMAP undergoes facile HRP catalysed degradation and the polymer is found to be non-toxic to HeLa cells indicating good biocompatibility of PAEMAP. Polymerization of varieties of vinyl monomers using PAEMAP as radical initiator and preparation of degradable polyperoxide–metal complexes using PAEMAP are under progress.
1 alternating copolymeric structure of PAEMAP has been elucidated spectroscopically and by elemental analysis. A radical chain-scission mechanism for the degradation of PAEMAP has been proposed based on the analysis of its degradation products by ESI-MS studies and kinetic studies by DSC. PAEMAP shows a highly exothermic heat of degradation, and degradation is controlled by the dissociation of the peroxide (–O–O–) bond in the polymer backbone. The exothermic degradation mechanism has been substantiated by thermochemical calculations. PAEMAP undergoes facile HRP catalysed degradation and the polymer is found to be non-toxic to HeLa cells indicating good biocompatibility of PAEMAP. Polymerization of varieties of vinyl monomers using PAEMAP as radical initiator and preparation of degradable polyperoxide–metal complexes using PAEMAP are under progress.
.
.
.
.
.
.
.
.
.
.
.
.
.
.
.
; (b) T. Mukundan and K. Kishore, Prog. Polym. Sci., 1990, 15, 475–505 CrossRef CAS
; (c) M. M. Mogilevich, Russ. Chem. Rev., 1979, 48, 199–211 CrossRef
.
.
.
.
; (b) K. Subramanian, K. S. Murthy and K. Kishore, Polymer, 1997, 38, 527–533 CrossRef CAS
; (c) T. Mukundan, V. A. Bhanu and K. Kishore, J. Chem. Soc., Chem. Commun., 1989, 780–781 RSC
.
.
.
.
.
.
.
.
.
.
.
.
.
.
.
.
.
.
.
.
.
.
.
.
.


