Graphene oxide as a promising photocatalyst for CO2 to methanol conversion†
Hsin-Cheng
Hsu
ab,
Indrajit
Shown
*a,
Hsieh-Yu
Wei
b,
Yu-Chung
Chang
b,
He-Yun
Du
a,
Yan-Gu
Lin
a,
Chi-Ang
Tseng
a,
Chen-Hao
Wang
*b,
Li-Chyong
Chen
c,
Yu-Chuan
Lin
d and
Kuei-Hsien
Chen
*ac
aInstitute of Atomic and Molecular Sciences, Academia Sinica, Taipei 10617, Taiwan. E-mail: indrajit25@gmail.com; chenkh@pub.iams.sinica.edu.tw
bDepartment of Materials Science and Engineering, National Taiwan University of Science and Technology, Taipei 10607, Taiwan. E-mail: chwang@mail.ntust.edu.tw
cCenter for Condensed Matter Sciences, National Taiwan University, Taipei 10617, Taiwan
dDepartment of Chemical Engineering and Materials Science, Yuan Ze University, Taoyuan 320, Taiwan
First published on 26th October 2012
Abstract
Photocatalytic conversion of carbon dioxide (CO2) to hydrocarbons such as methanol makes possible simultaneous solar energy harvesting and CO2 reduction, two birds with one stone for the energy and environmental issues. This work describes a high photocatalytic conversion of CO2 to methanol using graphene oxides (GOs) as a promising photocatalyst. The modified Hummer's method has been applied to synthesize the GO based photocatalyst for the enhanced catalytic activity. The photocatalytic CO2 to methanol conversion rate on modified graphene oxide (GO-3) is 0.172 μmol g cat−1 h−1 under visible light, which is six-fold higher than the pure TiO2.
1 Introduction
It is widely accepted that carbon dioxide accounts for the largest share of the anthropogenic greenhouse-gas emission.1 Not only the reduction of fossil-fuel consumption, but also CO2 capturing and sequestration are needed to counter the inevitable threat.2–4 Unfortunately, most of the thermochemical processes for CO2 valorization require an extraneous energy input, which may result in the net growth of CO2 emission. In this regard, photocatalytic conversion of CO2 to hydrocarbons under solar excitation becomes a viable approach to solve the energy and environmental crisis by recycling CO2 to fuels.5 Concurrently, the low-cost production of hydrocarbon-based fuels promises an attractive solution to the energy issues. Bio-mimetic processes based on photosynthesis allowing simultaneous solar energy harvesting and CO2 reduction thus become highly desirable.6The development of environmentally friendly materials has taken a great perspective for photocatalytic applications. Scientists in this field are always concerned in finding a new photocatalyst with some noble properties to enhance the photocatalytic performance. Among various photocatalysts,7 TiO2 is widely used for CO2 photoreduction because of its comparatively low cost, low toxicity and photocorrosion resistance.8 In order to enhance the photocatalytic activity several approaches, including doping with transition metals and noble metals,9–11 and mixing with another metal oxide with TiO2, have been considered.12 However, the reported methanol conversion rate for TiO2 in vapor phase CO2 photoreduction is only 0.02 μmol g cat−1 h−1,13 which is far below the actual requirement. While few selected TiO2-based catalysts like enzyme modified TiO2,14 Ti-SBA-15,15 Ag-loaded ALa4Ti4O15 (A = Ca, Sr and Ba)16 and Pt-NP loaded TiO4 (ref. 17) were reported to have a high hydrocarbon formation rate in gas phase CO2 photocatalytic reduction.
Graphene oxide (GO) is a newly emerging material of solution-dispersible polyaromatic, two-dimensional carbon sheets produced from acid exfoliation of graphite.18 It is like an insulating material with a wide bandgap, though its electronic structure depends on the stoichiometric carbon-to-oxygen atomic ratio. The basal plane of GO was covalently surrounded by the epoxide and hydroxyl groups, while edges were decorated with carboxyl functional groups.19 Due to the presence of several types of oxygen containing functional groups on the basal plane and sheet edges the aromatic GO can undergo a complex interplay of covalent and noncovalent interactions with different molecules. GO based hybrids and composite materials with improved properties have been synthesized with a range of organic and inorganic molecules via covalent, noncovalent and ionic interactions.20 The oxygenated functional groups provide a 2D network of sp2 and sp3 bonded atoms in GO, which leads to the presence of a finite bandgap depending on isolated sp2 domains.20 Tunability of the ratio of the sp2 and sp3 fractions by reduction chemistry can therefore controllably transform the insulating GO to a semiconductor and to a graphene-like semi-metal.21
In the last few years, graphene-based semiconductor photocatalysts have fascinated cosmic interest for improved photocatalytic performance.22,23 Among those photocatalysts graphene has been demonstrated as an efficient electron acceptor to enhance the charge transfer and effectively reduce recombination of the electron–hole pairs in the composite to improve the photocatalytic activity. In 2010, Kamat and co-workers pioneered the enhancement of the photocatalytic activity of graphene based semiconductor–metal composites.24 Zhang et al. showed that the TiO2–graphene nanocomposite leads to the enhanced photocatalytic degradation of organic pollutants.25 Xiang et al. studied different photocatalysts such as graphene–C3N4 composite, graphene modified TiO2 nanosheet and MoS2–graphene modified TiO2 nanoparticles for the enhanced photocatalytic hydrogen production under visible light.26–28 Most recently, Yeh et al. have shown that GO could act as an active photocatalyst for water splitting.29 The inherent wide bandgap of GO opens up the possibilities for photocatalytic applications such as CO2 to methanol conversion, which simultaneously performs solar energy harvesting and CO2 reduction. In this article, systematic investigation of GO for the photocatalytic CO2 reduction process has been performed based on various GOs synthesized under different conditions. Morphological and elemental characterizations of GOs have been applied to correlate with the photoreduction result to provide better understanding. The quantitative and qualitative determinations of the methanol formation were performed by gas chromatography (GC) and gas chromatography-mass spectrometry (GC-MS).
2 Experimental section
2.1 Materials
Graphite powder was purchased from Sigma-Aldrich (cat. #332461). All solvents and chemicals were of analytical grade and used without any purification.2.2 Synthesis of graphene oxide (GO)
Graphene oxide (GO-1) was first prepared using the modified Hummer's method.30 In a typical procedure, 0.5 g graphite powder and 0.375 g NaNO3 were placed in a 500 ml reaction flask and immersed in an ice bath. Then, 37.5 ml concentrated H2SO4 was added into the above mixture and stirred for 20 min. Subsequently, 2.25 g of KMnO4 was added slowly into the solution and continuously stirred for another five days at ambient temperature. After that 70 ml diluted H2SO4 (5 wt%) was added into the mixture and heated upto 90 °C under continuous stirring for 2 h. Then 3 ml H2O2 was added into the solution and stirred for another 2 h under ambient conditions. On completion of the reaction, the mixture was centrifuged (6000 rpm, 10 min) and washed with 400 ml of 3 wt% H2SO4 (3 wt%), H2O2 (0.5 wt%), and HCl (3 wt%), and then repeatedly washed with distilled water until the pH of the filtrate became neutral. Finally, the prepared GO was dispersed in distilled water and the homogeneous GO dispersion was then centrifuged and filtered. The as-prepared GO-1 in the filtrates was then collected and dried in a vacuum oven at 40 °C overnight prior to the storage in the powder form for further use.In the modified process, for synthesis of GO-2 and GO-3, a 0.5 g graphite powder was suspended in 37.5 ml of H2SO4 by stirring the mixture for 20 min. Subsequently, 85% H3PO4 of desired volume (for GO-2 = 5 ml and GO-3 = 10 ml) was then added, and the mixture was allowed to stir for another 15 min before the addition of KMnO4 (4.5 g). The reaction mixture was allowed to stir at room temperature for 5 days. After that we followed the similar procedure, as described previously.
2.3 Instrumentations
UV-visible absorption spectra for various GO dispersions were collected with a Jasco V-670 spectrophotometer using a 10 mm quartz cell. The microstructure of the GO samples on a gold substrate was investigated by a field emission scanning electron microscopy (FE-SEM, JEOL JSM-6700F). Atomic force microscopy (AFM) images of GO-1 and GO-3 were obtained using an AFM-Nano Wizard in tapping mode with a Si tip on the Si/SiO2 substrate. X-ray photoelectron spectroscopy (XPS) analysis was performed on a theta probe ESCA VG Scientific (2002) using monochromatic AlKα as the exciting source. The peak positions of the XPS were adjusted carefully with respect to the Au 4f peak because of the insulating character of GO. Finally, the XPS spectra were deconvoluted by using the Voigt fitting function after a Shirley background subtraction procedure. Gas chromatography (GC) analyses were performed on a GC-FID-CHINA CHROMATOGRAPHY 9800 system (glass column Porapak Q (80–100 mesh), inj. temp. 110 °C, FID temp. 150 °C and oven temp. 130 °C). GC-MS analyses were performed on a GC (HP 6890)/MS (HP 5973) system (column-Agilent DB-624, inj. temp. 250 °C and oven temp. 40 °C).2.4 Photocatalytic CO2 reduction experiment
The photocatalytic experiment for the reduction of CO2 was performed at ambient temperature (25 ± 5 °C) in a continuous gas flow reactor. The volume of the cylindrical reactor which was made of stainless steel and covered with quartz-glass was 300 ml (11 cm × 4 cm). One sample dish containing 0.2 g of catalyst powder was placed in the middle of the reactor. A 300 W commercial halogen lamp was used as the simulated solar-light source. The lamp was vertically placed outside the reactor above the sample dish. Two mini fans were fixed around the lamp to avoid the temperature rise of the flow system. The catalyst powder spread onto a glass disc, with a diameter of 7.5 cm. Initially nitrogen gas was purged inside the reactor to remove the air with other gases. After that CO2 was purged inside the reactor for another 1 hour and the flow rate was controlled at 4 sccm. CO2 was flowing through water to control the desired humidity level for the entire experiment. The halogen lamp was turned on after one hour while adsorption and desorption of the gas and the photocatalyst reached the equilibrium. The concentration of methanol was continuously measured by a GC-FID in the vapor phase. The detailed schematic drawing of the experimental setup is shown in Fig. S1.†3 Results and discussion
3.1 Synthesis and characterization of graphene oxide
The most conventional way for GO synthesis follows the modified Hummer's method,30 where the strong oxidant KMnO4 induces the oxygenated functional groups on well exfoliated graphite to produce highly dispersible graphene oxide sheets (GO-1). In our modified method GO-2 was prepared in the presence of excess KMnO4 with H3PO4 as expected; the excess KMnO4 would raise the level of oxidation and could lead to the overoxidation of the initially produced oxygenated functional groups. Furthermore, the excessive oxidation could result in hole formation and uncontrollable breaking of the edges and basal planes. The mild oxidizer H3PO4 reacts with a small amount of the surface hydroxyl groups via ester formation and hence prevents the GO basal plane from further oxidation. Sequentially, the GO-3 preparation with excess H3PO4 improved the protection of the GO basal plane. A similar phenomenon has been reported by Higginbotham et al. while using the mild oxidizing agent H3PO4 to fabricate graphene oxide nanoribbons from multiwall carbon nanotubes.31To clarify the properties of the synthesized GO-based materials, UV-visible spectra (normalized) were plotted as shown in Fig. 1. The observed absorption near 200 nm suggests that all the synthesized GO samples possess an ordered graphitic structure with a π → π* transition of C![[double bond, length as m-dash]](https://www.rsc.org/images/entities/char_e001.gif) C. A small shoulder near 300 nm was observed in all GOs spectra, which is attributed to the n → π* transition of C
C. A small shoulder near 300 nm was observed in all GOs spectra, which is attributed to the n → π* transition of C![[double bond, length as m-dash]](https://www.rsc.org/images/entities/char_e001.gif) O. The optical band gaps of the three samples, GO-1, GO-2 and GO-3, were determined by using a Tauc plot with a linear extrapolation (Fig. 1). The amorphous GO sheet having a non-uniform oxidation level cannot exhibit sharp adsorption edges in the Tauc plot. We observed an approximate band gap ranges over 2.9–3.7, 3.1–3.9 and 3.2–4.4 for GO-1, GO-2 and GO-3 respectively. These observed approximate band gaps of all the GOs, showing an intrinsic semiconductor like absorption in the blue optical region, are adequately large to overcome the endothermic energy required for the CO2 reduction (−0.38 V) under solar energy excitation.
O. The optical band gaps of the three samples, GO-1, GO-2 and GO-3, were determined by using a Tauc plot with a linear extrapolation (Fig. 1). The amorphous GO sheet having a non-uniform oxidation level cannot exhibit sharp adsorption edges in the Tauc plot. We observed an approximate band gap ranges over 2.9–3.7, 3.1–3.9 and 3.2–4.4 for GO-1, GO-2 and GO-3 respectively. These observed approximate band gaps of all the GOs, showing an intrinsic semiconductor like absorption in the blue optical region, are adequately large to overcome the endothermic energy required for the CO2 reduction (−0.38 V) under solar energy excitation.
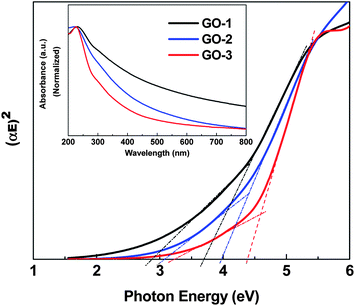 | ||
| Fig. 1 Tauc plots of the graphene oxide samples (GO-1, GO-2 and GO-3). Inset: UV-vis spectra of GO-1, GO-2 and GO-3. | ||
The morphology and structure of as-prepared graphene oxide samples (GO-1 and GO-3) were investigated via scanning electron microscopy (SEM) and transmission electron microscopy (TEM). As presented in Fig. 2, the scanning electron microscopy (SEM) images of GO sheets were cast on a gold coated (∼100 nm) Si/SiO2 substrate. All the GO samples were well-exfoliated with a majority of the flakes being only a few layers thick and several micrometers in diameter. In the GO-3 sample, we found that the graphene flakes have rough surfaces than the GO-1 samples. Furthermore, in the TEM observation (inset, Fig. 2), GO-1 shows a layer-by-layer stacked structure, while GO-3 has wrinkled paper like morphology. Such morphological changes can be attributed to the increased formation of phenolic and epoxy functional groups on the basal plane of GO-3. Topographic images of the GOs are shown in Fig. 3 together with the height profiles. AFM images confirm that GO-1 and GO-3 are comprised of isolated few-layer sheets. GO-1 and GO-3 have lateral dimensions of several micrometers and a thickness of 1–3 nm, which is characteristic of a fully exfoliated graphene oxide sheet. Furthermore, we clearly observed from the AFM images that the GO-3 sheet has rougher edges than GO-1. Typical AFM analyses disclose the same morphology of GO-1 and GO-3 as that obtained from the SEM and TEM measurements.
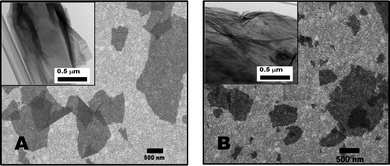 | ||
| Fig. 2 SEM images of graphene oxide sheets laying over a gold substrate: (A) GO-1, and (B) GO-3. Insets show the corresponding TEM images. | ||
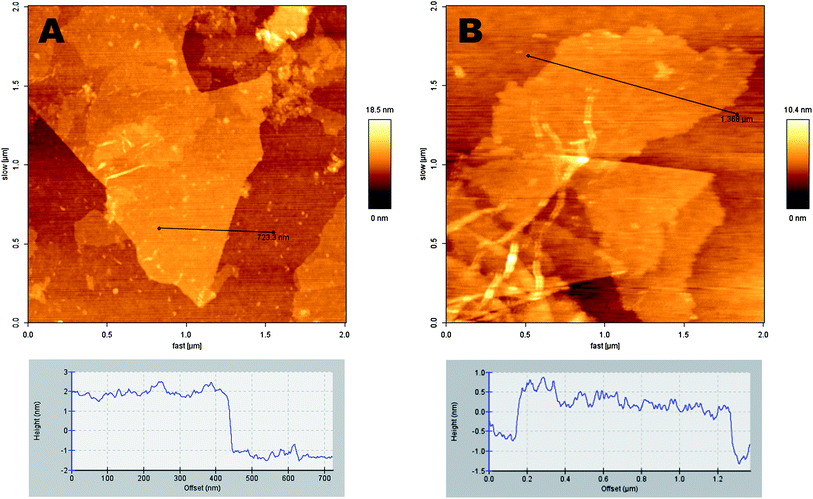 | ||
| Fig. 3 AFM images of graphene oxide sheets laying over a Si/SiO2 substrate: (A) GO-1, and (B) GO-3. The corresponding height profiles are shown at the bottom. | ||
The Raman spectroscopic study of three GO samples was conducted using the 514 nm laser. The Raman spectra (Fig. 4) of all the three GO samples exhibited two strong peaks: the G mode, a doubly degenerate phonon mode at the Brillouin zone observed at ∼1590 cm−1, originating from in-plane vibration of the sp2 domain; the D mode arising from the doubly resonant disorder-induced mode at ∼1341 cm−1. Moreover, for all the GOs synthesized by the modified Hummer's method, stronger D bands appear in the Raman spectra. Moreover, a very small decrease in the IG/ID intensity ratio (from ∼0.74 for GO-1 to ∼0.67 for GO-3) indicates a slight decrease in the in-plane domain size with a minute increase in the sp3 domain (defect density) with oxygenated functional groups on the GO basal plane of GO. Therefore, the Raman analysis result clearly supports previous microscopic analysis.
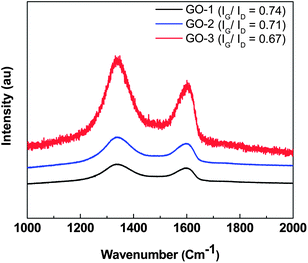 | ||
| Fig. 4 Raman spectra of GO-1, GO-2 and GO-3. | ||
X-ray photoelectron spectroscopy (XPS) measurement was performed to determine detail compositions and the nature of the functional groups in the as-synthesized GOs. Fig. S2† shows the wide-scan survey spectra for GO-1, GO-2 and GO-3 on silicon wafer. C KLL, O KLL and Si LMM Auger peaks and XPS spectra peaks of C, O and Si were recorded for all GO samples. The wide-scan XPS analysis reveals that other than C and O, no other elemental contaminants were present in the graphene oxide materials. It was observed that all GO C1s spectra, as shown in Fig. 5a–c, contain four components corresponding to sp2-hybridized (C![[double bond, length as m-dash]](https://www.rsc.org/images/entities/char_e001.gif) C), C–O, C
C), C–O, C![[double bond, length as m-dash]](https://www.rsc.org/images/entities/char_e001.gif) O and –COOH functional groups. The sp2-hybridized (C
O and –COOH functional groups. The sp2-hybridized (C![[double bond, length as m-dash]](https://www.rsc.org/images/entities/char_e001.gif) C) carbon peak appeared near 284.8 eV with a well-known asymmetric line shape in GO-1 as displayed in Fig. 5a. Additionally, the other peaks with significant intensities at 286.7 and 288.2 are related to oxidation developed C–O and C
C) carbon peak appeared near 284.8 eV with a well-known asymmetric line shape in GO-1 as displayed in Fig. 5a. Additionally, the other peaks with significant intensities at 286.7 and 288.2 are related to oxidation developed C–O and C![[double bond, length as m-dash]](https://www.rsc.org/images/entities/char_e001.gif) O (aromatic) functional groups. The C–OH (phenolic) and C–O–C (epoxy) functional groups on the basal plane are associated with the C–O component, assigned at 286.7–286.9 eV. A distinct shoulder at 289.1 eV is assigned to the –COOH groups. All the above-mentioned assignment of peak energies are in agreement with the literature values.32 The correlation between the relative peak intensities of the three components (normalized with sp2), as illustrated in Fig. 5d, provides better understanding of the differences in the synthesis process of GO. The inadequate addition of H3PO4 in the preparation of GO-2 could not protect the GO basal plane from over-oxidation as evidenced from the reduced C–O (component 1) intensity, while in GO-3 increasing amounts of H3PO4 improved the protection of the GO basal plane and increased the C–O (component 1) intensity significantly. On the other hand, the C
O (aromatic) functional groups. The C–OH (phenolic) and C–O–C (epoxy) functional groups on the basal plane are associated with the C–O component, assigned at 286.7–286.9 eV. A distinct shoulder at 289.1 eV is assigned to the –COOH groups. All the above-mentioned assignment of peak energies are in agreement with the literature values.32 The correlation between the relative peak intensities of the three components (normalized with sp2), as illustrated in Fig. 5d, provides better understanding of the differences in the synthesis process of GO. The inadequate addition of H3PO4 in the preparation of GO-2 could not protect the GO basal plane from over-oxidation as evidenced from the reduced C–O (component 1) intensity, while in GO-3 increasing amounts of H3PO4 improved the protection of the GO basal plane and increased the C–O (component 1) intensity significantly. On the other hand, the C![[double bond, length as m-dash]](https://www.rsc.org/images/entities/char_e001.gif) O and –COOH functional groups associated with components 3 and 4, respectively, were little lower in GO-3 as compared with GO-2.
O and –COOH functional groups associated with components 3 and 4, respectively, were little lower in GO-3 as compared with GO-2.
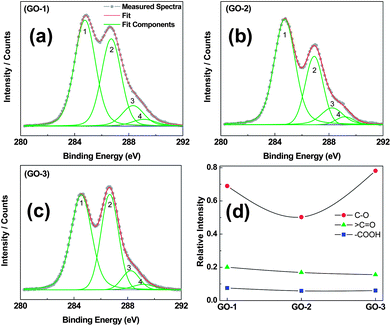 | ||
Fig. 5 XPS spectra (C1s) with deconvoluted peaks of graphene oxide samples (GO-1, GO-2 and GO-3). Peaks 1 to 4 represent C![[double bond, length as m-dash]](https://www.rsc.org/images/entities/char_e001.gif) C (or sp2), C–O, >C C (or sp2), C–O, >C![[double bond, length as m-dash]](https://www.rsc.org/images/entities/char_e001.gif) O and –COOH components, respectively. Relative areal intensity of –C–O, >C O and –COOH components, respectively. Relative areal intensity of –C–O, >C![[double bond, length as m-dash]](https://www.rsc.org/images/entities/char_e001.gif) O and –COOH, normalized with the sp2 component. O and –COOH, normalized with the sp2 component. | ||
3.2 Photocatalytic study of graphene oxide
Gas phase photocatalytic reduction of CO2 was carried out on the synthesized GO materials under ambient conditions using a halogen lamp as the light source. The commercial TiO2 was separately tested for gas phase photocatalytic CO2 reduction under the similar conditions. According to the procedure described in the Experimental section, the methanol (MeOH) formation rate, RMeOH (μmol g cat−1 h−1), was calculated and plotted in Fig. 6 as a function of reaction time. Activity of the methanol formation was found to follow the order: GO-3 > GO-1 > GO-2 > TiO2 (P-25). GO-3 displays a moderate methanol conversion rate of 0.172 μmol g cat−1 h−1 at a four-hour reaction time with a better stability. In GO-1 and GO-2 samples, the RMeOH initially increased very fast until it reached the maximum of 0.110 and 0.089 μmol g cat−1 h−1, respectively, and then it leveled off after 2 hours of testing, whereas a methanol conversion rate of only 0.03 μmol g cat−1 h−1 was observed with pure TiO2 (P-25). Additionally, to eliminate the surface area effect on the methanol formation rate, we calculated the methanol conversation rate (μmol per surface cat−1 h−1) based on the active sites of GO-3 (53.7 m2 g−1) and TiO2 (55 m2 g−1). The calculated methanol formation rates were 3.2 × 10⁻³ and 0.54 × 10⁻³ μmol per surface cat−1 h−1 for GO-3 and TiO2, respectively. This analysis supports the previous observation that the photocatalytic CO2 to methanol conversion rate of the modified graphene oxide (GO-3) is six-fold higher than that of the pure TiO2. Using RMeOH as a measure of performance, as-synthesized GO-3 has definitely outplayed the TiO2, as observed in Fig. 6.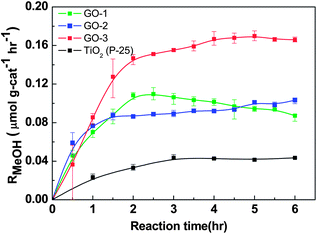 | ||
| Fig. 6 Photocatalytic methanol formation (RMeOH) on different graphene oxide samples (GO-1, GO-2, GO-3) and TiO2, using a simulated solar-light source. | ||
Among all GOs, GO-3 exhibits the highest efficiency as a photocatalyst for CO2 reduction. In general the overall photocatalytic CO2 reduction mechanism is a sequential combination of H2O oxidation and CO2 reduction. Particularly the valence band (VB) energy position of the photocatalyst for H2O oxidation must be greater than the potential for theoretical H2O oxidation (0.82 V vs. NHE at pH = 7). Furthermore, the conduction band (CB) position of the photocatalyst for H2O oxidation should be lower than the valance band position of the photocatalyst for CO2 reduction. The position of the conduction band of GO was calculated according to the cyclic voltammetry data shown in the ESI, Fig. S3.†
Moreover, the possible photocatalytic mechanism of the GO has been demonstrated for the better understanding of the CO2 photoreduction process. Chhowalla and Eda20 have reported that in GO isolated sp2 clusters with the oxygenated functional groups (C–OH or C–O–C) lead to localization of electron (e−)–hole (h+) pairs on its basal plane. Similarly, we assumed in our modified GO with surplus oxygenated components on the basal plane stretching the bandgap energy that helps the electrons excite from the valence band to the conduction band. We propose that in the photocatalytic reduction, the photogenerated electrons (e−) and holes (h+) would migrate to the GO surface and serve as the oxidizing and reducing sites, respectively, to react with absorbed reactants. The reduction potential of e− in the graphene oxide (GO) conduction band was determined to be −0.79 V (vs. NHE), which is lower than the potential of CO2/CH3OH (−0.38 V vs. NHE) and act as a donor. Whereas the oxidation potential of the h+ in the GO valance band was estimated (with optical band potential) to be around 4 V (vs. NHE), which is higher than the potential of H2O/O2, H+ (E = 0.82 V vs. NHE) and acts as an acceptor. This indicates that the photogenerated electrons and holes on the irradiated GO can react with the adsorbed CO2 and H2O to produce CH3OH via six-electron reaction, as described in eqn (1)–(3) in Fig. 7. The conduction band position (−0.79 V) of GO supports that the photocatalytic CO2 reduction on GO is less feasible for the one electron reduction process (E = −1.90 V) as compared to a multi-electron process. In our CO2 photo-reduction process, only CH3OH was detected, although there are possibilities for the formation of other products such as CO, HCHO and CH4. The photocatalytic performance data, herein, potentially support our hypothetical interpretations of the CO2 reduction mechanism.
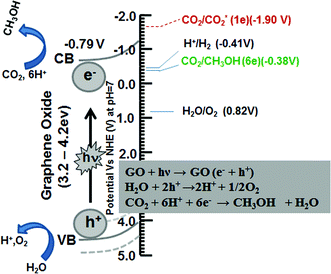 | ||
| Fig. 7 Schematic illustration of the photocatalytic CO2 reduction mechanism on graphene oxide. | ||
To confirm the chemical stability of GOs we conducted XPS analysis of GO-1, GO-2 and GO-3 after photocatalytic reaction as shown in Fig. S4.† XPS spectra of GOs showed negligible changes in the oxygenated functional groups as a result of irradiation. It was observed that all GO C1s spectra contain three components corresponding to sp2-hybridized (C![[double bond, length as m-dash]](https://www.rsc.org/images/entities/char_e001.gif) C), C–O and C
C), C–O and C![[double bond, length as m-dash]](https://www.rsc.org/images/entities/char_e001.gif) O functional groups. During the photocatalytic process, the oxygenated –COOH groups were removed from the GO edges, narrowing the bandgap. The correlation between the relative peak intensities of the C–O and C
O functional groups. During the photocatalytic process, the oxygenated –COOH groups were removed from the GO edges, narrowing the bandgap. The correlation between the relative peak intensities of the C–O and C![[double bond, length as m-dash]](https://www.rsc.org/images/entities/char_e001.gif) O components (normalized with sp2), as illustrated in Fig. S4d,† shows negligible changes in the GO samples after photocatalytic reaction as compared with the pristine samples before the photocatalytic reaction. Moreover, major parts of the oxygenated functional groups remain chemically stable during irradiation to sustain the critical bandgap of the GO for the photocatalytic reaction. Under these circumstances, the loss of a small number of oxygenated functional groups from the GO during irradiation only affect initial (upto 2 h) methanol formation, after that the catalyst became stable during the photocatalytic reaction. Additionally, to eliminate the possibility of GO as one of the major methanol source, we conducted the isotope tracer analyses of GOs with 13CO2 as described below.
O components (normalized with sp2), as illustrated in Fig. S4d,† shows negligible changes in the GO samples after photocatalytic reaction as compared with the pristine samples before the photocatalytic reaction. Moreover, major parts of the oxygenated functional groups remain chemically stable during irradiation to sustain the critical bandgap of the GO for the photocatalytic reaction. Under these circumstances, the loss of a small number of oxygenated functional groups from the GO during irradiation only affect initial (upto 2 h) methanol formation, after that the catalyst became stable during the photocatalytic reaction. Additionally, to eliminate the possibility of GO as one of the major methanol source, we conducted the isotope tracer analyses of GOs with 13CO2 as described below.
3.3 Isotope tracer analyses of GOs with 13CO2
In order to confirm the methanol formation through CO2 reduction, instead of photo-dissociation of GOs, isotope tracer analyses with 13CO2 was performed. We observed the distinct peak associated with 13CH3OH (m/z 33) instead of 12CH3OH (m/z 32), while replacing 12CO2 by 13CO2, for photocatalytic reduction with GO-3 in a closed system under irradiation for two hours (mass chromatography results, Fig. 8). These data confirmed that methanol was produced directly from the photocatalytic reduction of CO2 instead of any photo-dissociation of the carbon containing catalyst.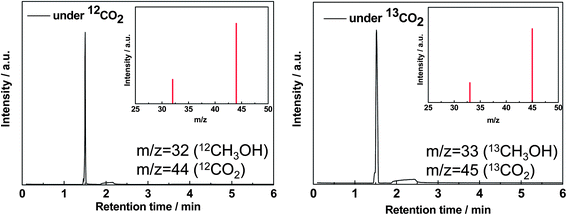 | ||
| Fig. 8 MS chromatograms and spectra of methanol produced by photocatalytic reduction of 13CO2 or 12CO2 with 0.2 g GO-2. (a) MS chromatogram at m/z 32 under 12CO2 and (b) MS chromatogram at m/z 33 under 13CO2. | ||
4 Conclusions
In conclusion, we have identified graphene oxide as an effective, low cost photocatalyst for simultaneous CO2 reduction and solar energy harvesting. Our studies show that by modulating the oxygenated functional groups, the methanol conversion rate can be achieved up to 0.172 μmol g cat−1 h−1 on graphene oxide (GO-3), under 300-Watt halogen lamp irradiation. These conversion rates are much higher than that of TiO2. We believe that our finding would be widely applicable to the graphene oxide based composites with metal or metal oxide nanoparticles to develop a cost effective technique for simultaneous solar energy harvesting and CO2 reduction.Acknowledgements
We thank National Science Council, Academia Sinica, National Taiwan University and Ministry of Education (MOE), Taiwan and AOARD of AFOSR for financial support and experimental facility. Technical support from the Core facilities for Nanoscience and Nanotechnology, Academia Sinica, Taiwan is acknowledged.References
- A. Yamasaki, J. Chem. Eng. Jpn., 2003, 36, 361 CrossRef CAS
.
- H. Yang, Z. Xu, M. Fan, R. Gupta, R. B. Slimane, A. E. Bland and I. Wright, J. Environ. Sci., 2008, 20, 14 CrossRef CAS
.
- R. E. Morris and P. S. Wheatley, Angew. Chem., Int. Ed., 2008, 47, 4966 CrossRef CAS
.
- D. Aaron and C. Tsouris, Sep. Sci. Technol., 2005, 40, 321 CrossRef CAS
.
- T. Inoue, A. Fujishima, S. Konishi and K. Honda, Nature, 1979, 277, 637 CrossRef CAS
.
- S. S. Tan, L. Zou and E. Hu, Catal. Today, 2006, 115, 269 CrossRef CAS
.
- M. R. Hoffmann, S. T. Martin, W. Y. Choi and D. W. Bahnemann, Chem. Rev., 1995, 95, 69 CrossRef CAS
.
- S. S. Tan, L. Zou and E. Hu, Sci. Technol. Adv. Mater., 2007, 8, 89 CrossRef
.
- O. K. Varghese, M. Paulose, T. J. LaTempa and C. A. Grimes, Nano Lett., 2009, 9, 731 CrossRef CAS
.
- K. Adachi, K. Ohta and T. Mizuno, Sol. Energy, 1994, 53, 187 CrossRef CAS
.
- J. C. S. Wu, T.-H. Wu, T. Chu, H. Huang and D. Tsai, Top. Catal., 2008, 47, 131 CrossRef CAS
.
- M. Subrahmanyam, S. Kaneco and N. Alonso-Vante, Appl. Catal., B, 1999, 23, 169 CrossRef CAS
.
- J. C. S. Wu and H. M. Lin, Int. J. Photoenergy, 2005, 7, 115 CrossRef CAS
.
- T. W. Woolerton, S. Sheard, E. Reisner, E. Pierce, S. W. Ragsdale and F. A. Armstrong, J. Am. Chem. Soc., 2010, 132, 2132 CrossRef CAS
.
- C.-C. Yang, J. Vernimmen, V. Meynen, P. Cool and G. Mul, J. Catal., 2011, 284, 1 CrossRef CAS
.
- K. Iizuka, T. Wato, Y. Miseki, K. Saito and A. Kudo, J. Am. Chem. Soc., 2011, 133, 20863 CrossRef CAS
.
- X. Feng, J. D. Sloppy, T. J. LaTemp, M. Paulose, S. Komarneni, N. Bao and C. A. Grimes, J. Mater. Chem., 2011, 21, 13429 RSC
.
- S. Park and R. S. Ruoff, Nat. Nanotechnol., 2009, 4, 217 CrossRef CAS
.
- D. R. Dreyer, S. Park, C. W. Bielawski and R. S. Ruoff, Chem. Soc. Rev., 2010, 39, 228 RSC
.
- G. Eda and M. Chhowalla, Adv. Mater., 2010, 22, 2392 CrossRef CAS
.
- G. Eda, C. Mattevi, H. Yamaguchi, H. Kim and M. Chhowalla, J. Phys. Chem. C, 2009, 113, 15768 CAS
.
- Q. Li, B. Gue, J. Yu, J. Ran, B. Zhang, H. Yan and J. R. Gong, J. Am. Chem. Soc., 2011, 133, 10878 CrossRef CAS
.
- Q. Xiang, J. Yu and M. Jaroniec, Chem. Soc. Rev., 2012, 41, 782 RSC
.
- I. V. Lightcap, T. H. Kosel and P. V. Kamat, Nano Lett., 2010, 10, 577 CrossRef CAS
.
- H. Zhang, X. J. Lv, Y. M. Li, Y. Wang and J. H. Li, ACS Nano, 2010, 4, 380 CrossRef CAS
.
- Q. Xiang, J. Yu and M. Jaroniec, J. Phys. Chem. C, 2011, 115, 7355 CAS
.
- Q. Xiang, J. Yu and M. Jaroniec, Nanoscale, 2011, 3, 3670 RSC
.
- Q. Xiang, J. Yu and M. Jaroniec, J. Am. Chem. Soc., 2012, 134, 6575 CrossRef CAS
.
- T.-F. Yeh, J.-M. Syu, C. Cheng, T.-H. Chang and H. Teng, Adv. Funct. Mater., 2010, 20, 2255 CrossRef CAS
.
- M. Hirata, T. Gotou, S. Horiuchi, M. Fujiwara and M. Ohba, Carbon, 2004, 42, 2929 CAS
.
- A. L. Higginbotham, D. V. Kosynkin, A. Sinitskii, Z. Sun and J. M. Tour, ACS Nano, 2010, 4, 2059 CrossRef CAS
.
- C. Mattevi, G. Eda, S. Agnoli, S. Miller, K. A. Mkhoyan, O. Celik, D. Mostrogiovanni, G. Granozzi, E. Garfunkel and M. Chhowalla, Adv. Funct. Mater., 2009, 19, 2577 CrossRef CAS
.
Footnote |
| † Electronic supplementary information (ESI) available: Additional figures are provided including electrochemical determination of the conduction band potential, photocatalytic experimental setup. See DOI: 10.1039/c2nr31718d |
| This journal is © The Royal Society of Chemistry 2013 |
