DOI:
10.1039/C2NR33130F
(Paper)
Nanoscale, 2013,
5, 253-261
Poly(acrylic acid) modified lanthanide-doped GdVO4 hollow spheres for up-conversion cell imaging, MRI and pH-dependent drug release
Received
11th October 2012
, Accepted 1st November 2012
First published on 5th November 2012
Abstract
In this study, multifunctional poly(acrylic acid) modified lanthanide-doped GdVO4 nanocomposites [PAA@GdVO4: Ln3+ (Ln = Yb/Er, Yb/Ho, Yb/Tm)] were constructed by filling PAA hydrogel into GdVO4 hollow spheres via photoinduced polymerization. The up-conversion (UC) emission colors (green, red and blue) can be tuned by changing the codopant compositions in the matrices. The composites have potential applications as bio-probes for cell imaging. Meanwhile, the hybrid spheres can act as T1 contrast agents for magnetic resonance imaging (MRI) owing to the existence of Gd3+ ions on the surface of composites. Due to the nature of PAA, DOX-loaded PAA@GdVO4:Yb3+/Er3+ system exhibits pH-dependent drug releasing kinetics. A lower pH offers a faster drug release rate. Such character makes the loaded DOX easily released at cancer cells. The cell uptake process of drug-loaded composites was observed by using confocal laser scanning microscopy (CLSM). The results indicate the potential application of the multifunctional composites as theragnostics (effective bimodal imaging probes and pH-responsive drug carriers).
1 Introduction
To thoroughly cure cancer, many anti-cancer chemotherapy drugs have been developed and used for cancer treatment and tumor suppression.1 However, most of the drugs have severe side effects to healthy tissues/organs, such as kidney, liver, bone marrow and heart.2 Hence, it is profound to design and fabricate sustained drug delivery platforms due to the possibility of reducing the frequency of drug administration, consequently relieving patient discomfort.3 The usefulness of specific stimuli-responsive systems is more pronounced because anti-cancer drugs would rarely leak during the delivery process and may be released at the targeted cells in response to external stimuli such as temperature, light irradiation, redox reagents, pH, enzymes, ionic strength, etc.4 Among these “smart” vehicles, a pH-responsive system for encapsulating anti-cancer drugs has been a hot research topic in view of the fact that the interstitial fluids of a number of solid tumors have lower pH compared with the surrounding normal tissue.4i,5 Although pure polymeric micelles as drug delivery systems (DDS) have attracted plenty of attention in the past few decades, some inextricable problems such as premature release and drug leakage occur because of its poor micelle stability.4j,5c,6 Meanwhile, unmodified inorganic porous materials do not respond to specific external triggers. Therefore, construction of organic–inorganic composites combining their respective advantages is significant in bio-applications.
Size and structure have been demonstrated to be two important characteristics for nanoparticles acting as drug carriers.7 They determine the in vivo distribution, biological fate, toxicity, and targeting ability of these DDS and also influence drug loading and release.8 For example, due to the large fraction of voids in their inner space, hollow materials show a much higher drug loading capacity than particles with a porous structure.9 Drug delivery devices occur in a wide range of sizes, from the nanoscale to macroscopic devices. In general, only small particles (diameter below 200 nm) can be accumulated in tumor cells by virtue of enhanced permeation and retention (EPR) effect, known as passive targeting.10 Moreover, only nanoscale devices are suitable for systemic (usually intravenous) distribution, as larger ones can induce embolic phenomenon.11 So hollow architectures below 200 nm are preferred to be applied in DDS.
Recently, researchers have endeavored to design multifunctional composites that would simultaneously possess diagnosis, target and therapy functions.12 Zhang et al. synthesized nanorattles consisting of a magnetic core and an up-conversion luminescent shell and utilized the free volume of composites to seal the anti-cancer drug doxorubicin hydrochloride (DOX).13 Chen and coworkers prepared magnetic mesoporous composites modified with positively charged polyelectrolyte and negatively charged fluorescent quantum dots.14 However, the fabrication process of introducing several kinds of particles into one system is tedious and complicated.12b,15 GdVO4 is an attractive single-phase bio-probe that presents a combination of magnetic and optical properties within one particle. On the one hand, GdVO4 particles can act as T1-positive contrast agents owing to the existence of Gd3+ ions.16 On the other hand, GdVO4 is also a promising host for lanthanide ions (Ln3+) to fabricate down-conversion (DC) or UC phosphors.17 From the view of bioimaging application, UC phosphors excited by continuous-wave near-infrared (NIR) light have considerable advantages over the conventionally used organic dyes and quantum dots. Compared with these traditional fluorescent labels, UC phosphors are less harmful to cells, minimize autofluorescence from biological tissues and penetrate tissues to a greater extent.18
Herein, multifunctional PAA-modified UC luminescent GdVO4:Ln3+ (Ln = Yb/Er, Yb/Ho, Yb/Tm) hollow nanospheres were successfully prepared. A facile hydrothermal process was developed to obtain GdVO4:Ln3+ (Ln = Yb/Er, Yb/Ho, Yb/Tm) hollow nanospheres via a self-sacrificing templated method. Some reported pH-responsive organic–inorganic composites were prepared by grafting-from approaches, which need tedious process.19 And the guest molecules entrapped into DDS were released at a high pH value.19a As we mentioned, the cancer cells have a more acidic environment compared with the normal cells, so the anti-cancer drug is expected to be released at acidic conditions. In this paper, a pH-sensitive polymer was introduced into the cavity of spheres via the “ship-in-a-bottle” method, and the photoinduced polymerization process just takes several minutes.20 Based on this rational design and fabrication of the multifunctional composites, simultaneous anti-cancer drug loading, fluorescent cellular imaging and MRI become a reality. The morphology, structure, luminescence properties, and the related bio-application of the obtained composites were investigated in detail.
2 Experimental
2.1 Materials
The rare earth oxides Ln2O3 (99.99%) Ln = (Gd, Yb, Er, Ho, Tm) were purchased from Science and Technology Parent Company of Changchun Institute of Applied Chemistry. Rare earth chloride stock solutions were obtained by dissolving the corresponding metal oxide in hydrochloric acid under heating with agitation. Polyvinylpyrrolidone (PVP, K30), urea [CO(NH2)2], diethylene glycol (DEG) and ammonium metavanadate (NH4VO3) were purchased from Beijing Chemical Co. Acrylic acid (AA) and N,N-methylenebiacrylamide (BIS) were acquired from Aladdin Company. Diphenyl(2,4,6-trimethylbenzoyl)-phosphine oxide (TPO) was purchased from Tokyo Kasei Kogyo Co., Ltd. Doxorubicin hydrochloride (DOX) was obtained from the Nanjing Duodian Chemical Limited Company. All the initial chemicals in this work were used without further purification.
2.2 Preparation of monodisperse Gd(OH)CO3:Ln3+ (Ln = Yb/Er, Yb/Ho, Yb/Tm) spheres
The monodisperse Gd(OH)CO3:Ln3+ (Ln = Yb/Er, Yb/Ho, Yb/Tm) spheres were prepared via a urea-based homogenous precipitation process according to the literature with some modifications.21 In a typical process, the Gd(OH)CO3:20%Yb3+/2%Er3+ spheres were synthesized as follows. A total of 3 mmol of GdCl3, YbCl3 and ErCl3 (molar ratio Gd![[thin space (1/6-em)]](https://www.rsc.org/images/entities/char_2009.gif) :
:![[thin space (1/6-em)]](https://www.rsc.org/images/entities/char_2009.gif) Yb
Yb![[thin space (1/6-em)]](https://www.rsc.org/images/entities/char_2009.gif) :
:![[thin space (1/6-em)]](https://www.rsc.org/images/entities/char_2009.gif) Er = 78
Er = 78![[thin space (1/6-em)]](https://www.rsc.org/images/entities/char_2009.gif) :
:![[thin space (1/6-em)]](https://www.rsc.org/images/entities/char_2009.gif) 20
20![[thin space (1/6-em)]](https://www.rsc.org/images/entities/char_2009.gif) :
:![[thin space (1/6-em)]](https://www.rsc.org/images/entities/char_2009.gif) 2) and urea (1.5 g) were added into a mixed solvent of H2O–DEG. PVP (3 g) was dissolved into the above solution under magnetic stirring until a transparent solution was formed. The total volume of the solution was about 300 mL. The resultant solution was then reacted at 90 °C for 3 h in the oil bath. The obtained suspension was separated by centrifugation and collected after washing with deionized water and ethanol several times. The Gd(OH)CO3:20%Yb3+/0.4%Ho3+, Gd(OH)CO3:20%Yb3+/0.2%Tm3+ spheres were prepared by the same synthesis procedure for the Gd(OH)CO3:20%Yb3+/2%Er3+ sample.
2) and urea (1.5 g) were added into a mixed solvent of H2O–DEG. PVP (3 g) was dissolved into the above solution under magnetic stirring until a transparent solution was formed. The total volume of the solution was about 300 mL. The resultant solution was then reacted at 90 °C for 3 h in the oil bath. The obtained suspension was separated by centrifugation and collected after washing with deionized water and ethanol several times. The Gd(OH)CO3:20%Yb3+/0.4%Ho3+, Gd(OH)CO3:20%Yb3+/0.2%Tm3+ spheres were prepared by the same synthesis procedure for the Gd(OH)CO3:20%Yb3+/2%Er3+ sample.
2.3 Preparation of monodisperse GdVO4:Ln3+ (Ln = Yb/Er, Yb/Ho, Yb/Tm) hollow spheres
In a typical experiment, the as-prepared Gd(OH)CO3:Yb3+/Er3+ sample was dispersed into deionized water by ultrasonication for 0.5 h to obtain solution A. Then, NH4VO3 (0.0351 g) and 2 M HCl (30 μL) were added into deionized water to form solution B. After stirring for 10 min, solution B was introduced into solution A. After additional agitation for 0.5 h, the mixing solution was transferred into a Teflon bottle (18 mL) held in a stainless steel autoclave, sealed, and maintained at 180 °C for 10 h. After allowing the autoclave to cool to room temperature naturally, the precipitates were separated by centrifugation, washed with deionized water and ethanol in sequence, and then dried in air at 80 °C for 12 h. The synthesis of GdVO4:Yb3+/Ho3+ and GdVO4:Yb3+/Tm3+ hollow spheres was similar to the above procedure. In order to increase the crystallization of the samples, the products were heated to 700 °C with a heating rate of 2 °C min−1, and held at this temperature for 2 h.
2.4 Preparation of PAA@GdVO4:Yb3+/Er3+
GdVO4:Yb3+/Er3+ (20 mg) was added to a conical flask (25 mL) and then vacuumed at room temperature for 0.5 h. Subsequently, AA (2 mL) was mixed with BIS (116 mg) and TPO (105.2 mg) for 12 h in the dark. Then, the above mixture was injected into the flask under magnetic stirring. After 0.5 h, the vacuum pump was turned off and air was allowed to refill into the system. The sample was stirred for another 12 h at ambient atmosphere in the dark. After that, the particles were separated by centrifugation and rinsed with ethanol to remove the surface-adsorbed monomers. The monomer-contained composites were exposed to UV light (200 W cm−2, LAMP, PHILIPS) for 5 min to make the photo-initiated polymerization take place. After that, the collected solid was washed with ethanol and dried in a vacuum at 50 °C to obtain the final samples, denoted as PAA@GdVO4:Yb3+/Er3+.
2.5 Up-conversion luminescence microscopy (UCLM) observation of the PAA@GdVO4:Yb3+/Er3+ composite
The instrument of UCLM was rebuilt on an inverted fluorescence microscope (Nikon Ti-S) and an external CW 980 nm diode laser was illuminated onto the samples. UC luminescence (UCL) imaging of HeLa cells (5 × 10⁴ per well) were seeded in 6-well culture plates and grown overnight as a monolayer, and were incubated with PAA@GdVO4:Yb3+/Er3+ with a concentration of 100 μg mL−1 at 37 °C for 6 h. Thereafter, the cells were washed with phosphate buffered saline (PBS) three times, fixed with 2.5% formaldehyde (1 mL per well) at 37 °C for 10 min, and then washed with PBS three times.
2.6 MRI measurements
The MRI measurements were performed in a 0.5 T MRI magnet (Shanghai Niumai Corporation Ration NM120-Analyst). PAA@GdVO4:Yb3+/Er3+ samples were dispersed in water at various Gd concentrations. T1 was acquired using an inversion recovery sequence. T1 measurements were performed using a nonlinear fit to changes in the mean signal intensity within each well as a function of TR using the provided quantification software. Finally, the r1 relaxivity value was determined through the curve fitting of 1/T1 relaxation time (s−1) vs. the Gd concentration (mM).
2.7
In vitro DOX loading and release
To measure the loading capacities of PAA@GdVO4:Yb3+/Er3+, PAA@GdVO4:Yb3+/Er3+ sample (10 mg) was added into DOX aqueous solution (4 mL, 1 mg mL−1). The mixture was shaken for 24 h at room temperature to reach the equilibrium state. Then the solution was centrifuged to collect the DOX-loaded PAA@GdVO4:Yb3+/Er3+ sample. The supernatant solutions were collected, and the content of DOX was determined by UV-vis spectral measurement at the wavelength of 480 nm. To study the drug release kinetics, the DOX-loaded PAA@GdVO4:Yb3+/Er3+ sample was immersed in PBS (1 mL, pH 7.4 or pH 4.0) at 37 °C, and shaken at 100 rpm. At selected time intervals, buffer solution was taken and replaced with fresh buffer solution. The amounts of released DOX in the supernatant solutions were measured by UV-vis spectrophotometer.
2.8
In vitro cytotoxicity of DOX-loaded PAA@GdVO4:Yb3+/Er3+ spheres and cell viability
In vitro cytotoxicity of PAA@GdVO4:Yb3+/Er3+ spheres were assayed against human cervical cell line (HeLa cells). HeLa cells were seeded in a 96-well plate at a density of 8000 cells per well and cultured in 5% CO2 at 37 °C for 24 h. Then free DOX, DOX-loaded PAA@GdVO4:Yb3+/Er3+ and PAA@GdVO4:Yb3+/Er3+ were added to the medium, and the cells were incubated in 5% CO2 at 37 °C for 48 h. The concentrations of DOX were 1.5625, 3.125, 6.25, 12.5, 25 and 50 μg mL−1, respectively. The concentrations of the nanospheres were 9, 18, 36, 72, 144 and 288 μg mL−1, respectively. At the end of the incubation, 3-[4,5-dimethylthiazol-2-yl]-2,5-diphenyltetrazolium bromide (MTT, 20 μL) solution was added into each cell and incubated for another 4 h. After that, the medium containing MTT was removed and dimethyl sulfoxide (DMSO, 150 μL) was added to each well to dissolve the MTT formazan crystals. Finally, the plates were shaken for 10 min, and the absorbance of formazan product was measured at 490 nm by a microplate reader (Therom Multiskan MK3). Meanwhile, the biocompatibility of the sample was also determined using MTT assay on L929 fibroblast cells, which was the same as the procedure for cytotoxicity assay for PAA@GdVO4:Yb3+/Er3+ spheres.
2.9 Cellular uptake of DOX-loaded PAA@GdVO4:Yb3+/Er3+ spheres
The HeLa cells were seeded in 6-well culture plates (a clean cover slip was put in each well) and grown overnight as a monolayer, and were incubated with DOX-loaded PAA@GdVO4:Yb3+/Er3+ at 37 °C for 10 min, 1 h, and 6 h. Thereafter, the cells were washed with PBS three times, fixed with 2.5% formaldehyde (1 mL per well) at 37 °C for 10 min, and then rinsed with PBS three times again. For nucleus labeling, the nuclei was stained with Hoechst 33342 solution (from Molecular Probes, 20 μg mL−1 in PBS, 1 mL per well) at 37 °C for 10 min and then rinsed with PBS three times. The cover slips were placed on a glass microscope slide, and the samples were visualized using CLSM (FV10-ASW).
2.10 Characterization
The X-ray diffraction (XRD) measurements were performed on a D8 Focus diffractometer (Bruker) with Cu Kα radiation (λ = 0.15405 nm). The morphologies of the samples were obtained using a field emission scanning electron microscope (FE-SEM, S-4800, Hitachi) equipped with an energy-dispersive X-ray spectrum (EDX, JEOL JXA-840). Transmission electron microscopy (TEM) was performed using FEI Tecnai G2 S-Twin with a field emission gun operating at 200 kV. The Fourier transform infrared spectra were measured on a Vertex Perkin-Elmer 580BIR spectrophotometer (Bruker) with the KBr pellet technique. Thermogravimetry (TG) was carried out on a Netzsch Thermoanalyzer STA 409 instrument in an atmospheric environment with a heating rate of 10 °C min−1 from room temperature to 800 °C. Nitrogen adsorption/desorption analysis was performed with a Micromeritics ASAP 2020M apparatus. The specific surface area was determined by the Brunauer–Emmett–Teller (BET) method. The UV-vis absorption spectral values were measured on a U-3100 spectrophotometer (Hitachi). The UC emission spectra were obtained by using a 980 nm laser diode as the excitation source and the emission spectra were dispersed by a monochromator of the Acton SpectraPro-2758 equipped with R928 PMT, and the data were recorded from 400 to 900 nm. CLSM images were observed by confocal laser scanning microscope (Olympus, FV 1000).
3 Results and discussion
The XRD patterns (Fig. 1A) affirm that the precursor is amorphous whilst the hydrothermal product is a tetragonal GdVO4 phase (XRD data matched well with the standard data; JCPDS no. 17-0260).22 Furthermore, decoration of hollow spheres with pH-sensitive polymer has not changed the phase structure of GdVO4:Yb3+/Er3+. Compared with the individual elements (i.e. Gd, Yb, O, and C) in the EDX of precursors (Fig. 1B, a), the presence of Gd, Yb, V, and O elements in the EDX of hydrothermal products (Fig. 1B, b) indicate that the precursors have been entirely converted into GdVO4 phase (the absence of Er signal is due to the low content of erbium). The reappearance of C signal and enhanced intensity of O signal prove the successful functionalization of GdVO4:Yb3+/Er3+ with PAA polymer (Fig. 1B, c). The FTIR spectra of Gd(OH)CO3:Yb3+/Er3+, GdVO4:Yb3+/Er3+ and PAA@GdVO4:Yb3+/Er3+ are depicted in Fig. 1C. The spectra prove the formation of the GdVO4:Yb3+/Er3+ owing to the disappearance of the peak at 1515 cm−1 (O–C–O) ascribed to Gd(OH)CO3:Yb3+/Er3+ precursor and the appearance of peaks at 802 cm−1 and 448 cm−1 attributed to the vibration of V–O bond and Gd–O band.23 After photopolymerization, a new peak assigned to C![[double bond, length as m-dash]](https://www.rsc.org/images/entities/char_e001.gif) O stretching vibration in the carboxyl group at 1720 cm−1 and two peaks ascribed to C–H stretching vibrations at 2927 and 2856 cm−1 appeared, which further validated the formation of inorganic–organic hybrid materials.14 Quantitative determination of the polymer content was executed by TG analyses, as shown in Fig. 2. A comparison of TG data for GdVO4:Yb3+/Er3+ and PAA@GdVO4:Yb3+/Er3+, suggested that 18 wt% of PAA is impregnated into hollow spheres.
O stretching vibration in the carboxyl group at 1720 cm−1 and two peaks ascribed to C–H stretching vibrations at 2927 and 2856 cm−1 appeared, which further validated the formation of inorganic–organic hybrid materials.14 Quantitative determination of the polymer content was executed by TG analyses, as shown in Fig. 2. A comparison of TG data for GdVO4:Yb3+/Er3+ and PAA@GdVO4:Yb3+/Er3+, suggested that 18 wt% of PAA is impregnated into hollow spheres.
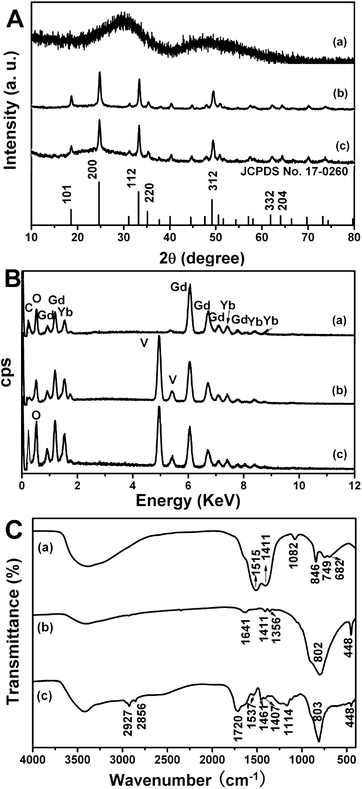 |
| | Fig. 1 XRD patterns (A), EDX spectra (B), and FT-IR spectra (C) of Gd(OH)CO3:Yb3+/Er3+ (a), GdVO4:Yb3+/Er3+ (b) and PAA@GdVO4:Yb3+/Er3+ (c). | |
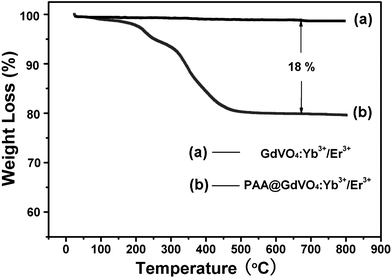 |
| | Fig. 2 TG curves of GdVO4:Yb3+/Er3+ hollow spheres (a) and PAA@GdVO4:Yb3+/Er3+ composites (b). | |
A schematic representation of the rational design employed to obtain PAA@GdVO4:Yb3+/Er3+ composites and subsequently drug storage/release process is shown in Scheme 1. The monodisperse Gd(OH)CO3:Yb3+/Er3+ spheres with a diameter of 130 nm, shown in Fig. 3a and b, were synthesized via a facile urea-based homogenous precipitation.21 These solid spheres acted as a template for the GdVO4:Yb3+/Er3+ hollow spheres. As the template was in weak acidic conditions, a part of the precursors were dissolved and the free Gd3+ cations could react with VO43− anions to form GdVO4 particles. During this ion exchange process, the Gd3+ cation is supposed to move faster than the VO43− anion, so the inner dissolved Gd3+ cation could easily diffuse outside. This conversion leads to an outward growth of the hollow shell. Hence, the final products consist of large numbers of 180 nm hollow spheres, as shown in Fig. 3c. The enlarged TEM image in Fig. 3d clearly present the building blocks of individual hollow spheres as rice-like nanoparticles with a length of 25 nm and a diameter of 15 nm. As disclosed by the HRTEM image (Fig. 3e), the interplanar distance between the adjacent lattice fringes is 0.270 nm. This plane can be indexed as the d spacing of the (112) plane of the GdVO4 crystal. The monomer (AA) was impregnated into the interior of GdVO4:Yb3+/Er3+ hollow spheres with the aid of vacuum suction owing to the wetting action and capillary force. Through photoinduced polymerization the pH-sensitive polymer formed rapidly. Fig. 3f displays the TEM image of PAA@GdVO4:Yb3+/Er3+ composites. The hollow structure still remains intact. We can not find the difference between GdVO4:Yb3+/Er3+ and PAA@GdVO4:Yb3+/Er3+ from TEM images due to the PAA polymerized into the hollow part and the low contrast of PAA with respect to GdVO4:Yb3+/Er3+. The obtained composites can be applied as pH-responsive drug carriers by virtue of their large space and features of the PAA polymer.
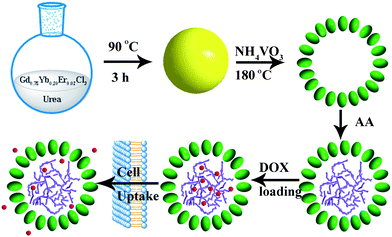 |
| | Scheme 1 Schematic for the preparation process of PAA@GdVO4:Yb3+/Er3+ and subsequent loading and release of DOX. | |
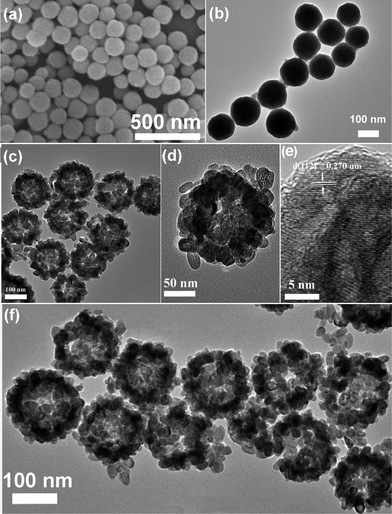 |
| | Fig. 3 SEM (a) and TEM (b) images of Gd(OH)CO3:Yb3+/Er3+ precursor; TEM (c and d) and HRTEM (e) images of GdVO4:Yb3+/Er3+ hollow spheres; TEM (f) image of PAA@GdVO4:Yb3+/Er3+ composites. | |
Under 980 nm NIR laser excitation, the PAA@GdVO4:Yb3+/Er3+, PAA@GdVO4:Yb3+/Ho3+ and PAA@GdVO4:Yb3+/Tm3+ samples exhibit green, red and blue emissions respectively, as confirmed by the corresponding luminescent photographs (insets in Fig. 4). Fig. 4a shows the UC emission spectrum of the PAA@GdVO4:Yb3+/Er3+ sample excited at 980 nm. Two primary bands in the green emission region with maxima at 518 and 545 nm are assigned to the 2H11/2 → 4I15/2 and 4S3/2 → 4I15/2 transitions of the Er3+ ions, respectively, and a weak band at about 660 nm is assigned to the 4F9/2 → 4I15/2 transitions of the Er3+ ions.16b Hence, the green emission plays a dominant role in luminescence color output. In the case of PAA@GdVO4:Yb3+/Ho3+ composites in Fig. 4b, one green emission peak at 542 nm and two intense red emission peaks at 650, 660 nm were observed. The green and red emissions were caused by 5S2 → 5I8 and 5F5 → 5I8 transitions of Ho3+, respectively.24 According to the energy level diagram shown Fig. 4f, the blue emission band of the Tm3+ is attributed to the electronic 1G4 → 3H6 transition. The UC emissions were also detected in the red-NIR region (640–830 nm), which can be ascribed to the 1G4 → 3F4, 3F3 → 3H6, and 3H4 → 3H6 transitions of Tm3+ ions (Fig. 4c).25 These results indicate that the UC fluorescence properties are still preserved when the polymer is impregnated into hollow UC phosphors.
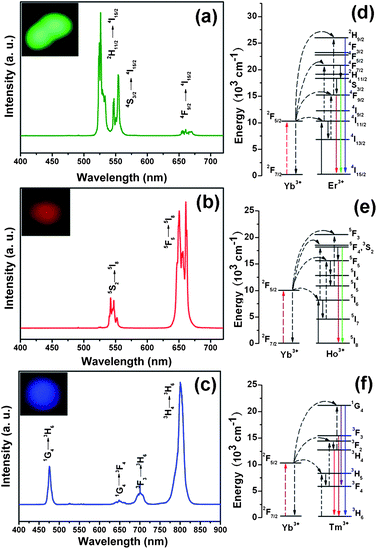 |
| | Fig. 4 Up-conversion emission spectra of PAA@GdVO4:Yb3+/Er3+ (a) PAA@GdVO4:Yb3+/Ho3+ (b), and PAA@GdVO4:Yb3+/Tm3+ (c). Inset is the corresponding photographs of the samples under 980 nm IR light irradiation. Schematic illustration of the transition energy levels for the Yb3+–Er3+ (d), Yb3+–Ho3+ (e), and Yb3+–Tm3+ (f) systems. | |
The study on biocompatibility of the sample is very important for bio-applications, such as cell imaging and drug delivery. Hence, in vitro cytotoxicity of pure GdVO4:Yb3+/Er3+ and PAA@GdVO4:Yb3+/Er3+ composites against L929 cells were characterized by a standard MTT assay. The results shown in Fig. 5 indicate that no significant cytotoxic activity for both of samples could be observed for 24 h even at a high concentrations (up to 100 μg mL−1). These data confirm that the composites can be applied in the biomedical field with good biocompatibility.
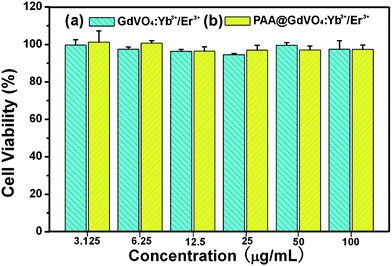 |
| | Fig. 5 The L929 fibroblast cells viabilities after incubation with GdVO4:Yb3+/Er3+ hollow spheres (a) and PAA@GdVO4:Yb3+/Er3+ composites (b) for 24 h measured by MTT assay. | |
In order to evaluate their effectiveness for fluorescent imaging, the PAA@GdVO4:Yb3+/Er3+ composites were incubated with HeLa cells (Fig. 6). After 6 h exposure, extensive UC fluorescence was clearly observed with high signal-to-background ratio. The internalized green-emitting PAA@GdVO4:Yb3+/Er3+ composites were in the cytoplasm of HeLa cells but not in the nucleus. The results indicated that the obtained composites have potential for cellular imaging. In addition, the multifunctional capability of the composites was extended to the study of their magnetic properties using a 0.5 T MR imaging system. Fig. 7a shows T1-weighted MR images of the composites at different Gd3+ concentrations in the range of 0–5 mM. As the Gd3+ concentration increased, it can be seen that the composites brightened the T1-weighted images and enhanced the r1 of water protons. The specific relaxivity values (r1) were measured to be 0.763 mM−1 s−1, demonstrating that Gd3+-containing composites could be an effective T1 MRI contrast agent.
![Inverted fluorescence microscope images of HeLa cells incubated with PAA@GdVO4:Yb3+/Er3+ ([PAA@GdVO4:Yb3+/Er3+] = 100 μg mL−1) for 6 h. Each image can be classified to the bright-field (a), the nuclei of cells being dyed in blue by Hoechst 33324 (b), up-conversion luminescent images (c) in dark, and overlay of above (d). All scale bars are 20 μm.](/image/article/2013/NR/c2nr33130f/c2nr33130f-f6.gif) |
| | Fig. 6 Inverted fluorescence microscope images of HeLa cells incubated with PAA@GdVO4:Yb3+/Er3+ ([PAA@GdVO4:Yb3+/Er3+] = 100 μg mL−1) for 6 h. Each image can be classified to the bright-field (a), the nuclei of cells being dyed in blue by Hoechst 33324 (b), up-conversion luminescent images (c) in dark, and overlay of above (d). All scale bars are 20 μm. | |
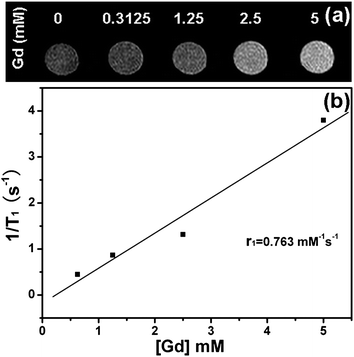 |
| | Fig. 7 (a) T1-weighted images for various Gd concentrations (0, 0.3125, 1.25, 2, and 5 mM) of PAA@GdVO4:Yb3+/Er3+ composites. Deionized water (0 mM) was used as the reference. (b) T1 relaxivity plot of aqueous suspension of PAA@GdVO4:Yb3+/Er3+ composites. | |
Fig. 8 shows the N2 adsorption/desorption isotherms of GdVO4:Yb3+/Er3+ and PAA@GdVO4:Yb3+/Er3+ samples, which are both Type IV with a typical H1 hysteresis loop, indicating the presence of mesopores. Although the specific surface area and pore volume of composites dropped to 31.36 m2 g−1 and 0.332 cm3 g−1, the samples still possess adequate space to load guest molecules. DOX, an anti-cancer drug, was selected as a model drug to examine the drug release, uptake behavior and therapeutic effects of samples. A large number of DOX molecules can be encapsulated into carriers due to the large cavity and the ionic bonds between drugs and PAA polymer. The loading amount of DOX could be determined by the characteristic DOX absorption peak at 480 nm, and the loading efficiency was 15 wt% (Fig. 9A). The in vitro release of DOX from the DOX-loaded PAA@GdVO4:Yb3+/Er3+ could be controlled by changing pH values. In neutral PBS (pH 7.4) to simulate normal physiological conditions, DOX was released from composites in a very slow fashion and the cumulative release of DOX was only about 13% within 72 h (Fig. 9B). With an increased acidity to pH 4.0 to simulate the intracellular conditions of cancer cells, the release rate of DOX became much faster. This pH-responsive feature is very important because the microenvironments in the extracellular tissues of tumors and intracellular lysosomes and endosomes are acidic.26
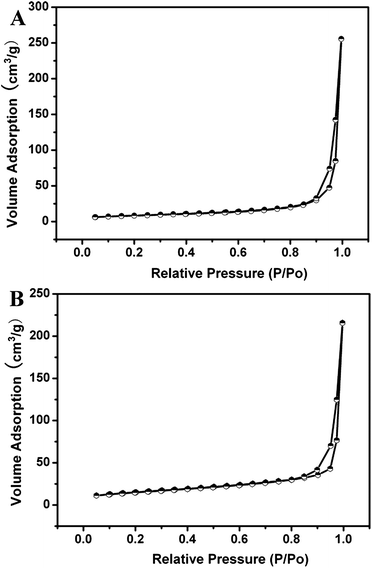 |
| | Fig. 8 N2 adsorption/desorption isotherms for GdVO4:Yb3+/Er3+ hollow spheres (A) and PAA@GdVO4:Yb3+/Er3+ composites (B). | |
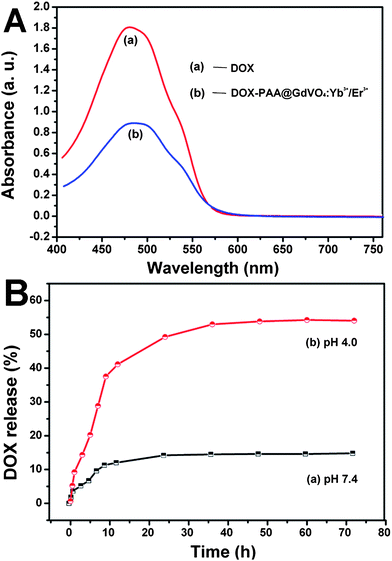 |
| | Fig. 9 (A): UV-vis spectra of free DOX and DOX-loaded PAA@GdVO4:Yb3+/Er3+ solutions. (B): cumulative DOX release from PAA@GdVO4:Yb3+/Er3+ composites in PBS buffer at pH 7.4 (a) and pH 4.0 (b) versus release time. | |
We incubated the HeLa cells with free DOX and DOX-loaded PAA@GdVO4:Yb3+/Er3+ to demonstrate the cancer killing ability. PAA@GdVO4:Yb3+/Er3+ composites alone show negligible cytotoxic effect, while DOX-loaded PAA@GdVO4:Yb3+/Er3+ samples exhibit a dose-dependent cytotoxic effect, which was similar to that observed with equivalent doses of free DOX when the concentration of DOX is over 6.25 μg mL−1 (Fig. 10). This is crucial because DOX-loaded PAA@GdVO4:Yb3+/Er3+ samples have fairish anti-cancer capacity while the side effects of DOX can be weakened to some extent. In addition, the fluorescent nature of DOX (red fluorescence) molecules facilitates the observation of intracellular delivery and release of anti-cancer drugs from the PAA@GdVO4:Yb3+/Er3+ carriers. CLSM photographs of HeLa cells incubated with DOX-loaded PAA@GdVO4:Yb3+/Er3+ for 10 min, 1 h, and 6 h are shown in Fig. 11. In the first 10 min (Fig. 11a–c), only a few of the composite particles could be uptaken by HeLa cells and localized in the cytoplasm. Compared with normal tissue, solid tumors have a weakly acidic extracellular enviroment.27 The pH-sensitive feature of the carriers impels the loaded drug molecules release in the cytoplasm of cancer cells. With the increase of the incubation time (1 h and 6 h), the intensities of red signal increase, that is, more and more DOX molecules were released and localized in both the cytoplasm and the cell nucleus (Fig. 11d–i). The time course CLSM images indicate that the intracellular pathway that the DOX-loaded PAA@GdVO4:Yb3+/Er3+ used to deliver DOX consisted of rapid internalization, composites localization in the cytoplasm, and DOX localization in the cell nucleus. Hence, the effective therapy may result from the enhanced intracellular delivery, the pH-responsive release and the protection of DOX extracellular by DOX-loaded PAA@GdVO4:Yb3+/Er3+.
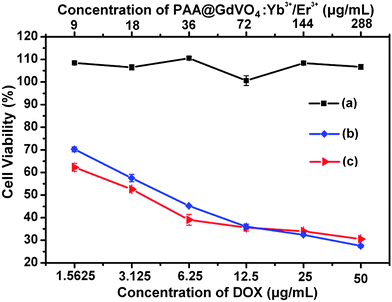 |
| | Fig. 10
In vitro HeLa cell viabilities after incubation 24 h with bare GdVO4:Yb3+/Er3+ hollow spheres (a), DOX-loaded PAA@GdVO4:Yb3+/Er3+ composites (b), and free DOX (c) at different concentrations. | |
![CLSM images of HeLa cells incubated with DOX-loaded PAA@GdVO4:Yb3+/Er3+ sample ([DOX] = 20 μg mL−1) for 10 min (a–c), 1 h (d–f), 6 h (g–i) at 37 °C. Each series can be classified to the nuclei of cells (being dyed in blue by Hoechst 33324 for visualization), DOX-loaded PAA@GdVO4:Yb3+/Er3+ sample, and a merge of the two channels of both above, respectively. All scale bars are 40 μm. The excitation wavelength of Hoechst 33324 and DOX are 405 and 543 nm, respectively. The red emission (572 nm) is from DOX.](/image/article/2013/NR/c2nr33130f/c2nr33130f-f11.gif) |
| | Fig. 11 CLSM images of HeLa cells incubated with DOX-loaded PAA@GdVO4:Yb3+/Er3+ sample ([DOX] = 20 μg mL−1) for 10 min (a–c), 1 h (d–f), 6 h (g–i) at 37 °C. Each series can be classified to the nuclei of cells (being dyed in blue by Hoechst 33324 for visualization), DOX-loaded PAA@GdVO4:Yb3+/Er3+ sample, and a merge of the two channels of both above, respectively. All scale bars are 40 μm. The excitation wavelength of Hoechst 33324 and DOX are 405 and 543 nm, respectively. The red emission (572 nm) is from DOX. | |
4 Conclusions
In summary, lanthanide-doped GdVO4 hollow spheres were fabricated and subsequently pH-sensitive PAA polymer was impregnated into their inner cavity. MTT assays demonstrate the composites possess good biocompatibility. The PAA@GdVO4:Yb3+/Er3+ composites can be served as bio-probes for cell imaging and effective T1-weighted MRI contrast deriving from Gd3+ ions. In addition, the DOX-loaded samples exhibit pH-dependent drug releasing kinetics. These PAA-modified GdVO4:Ln3+ (Ln = Yb/Er, Yb/Ho, Yb/Tm) composites offer unique opportunities to simultaneously detect and treat tumor tissues by a combination of analytical (optical and MR imaging) and chemotherapeutic methods.
Acknowledgements
This project is financially supported by National Basic Research Program of China (2010CB327704), National High Technology Program of China (2011AA03A407), and the National Natural Science Foundation of China (NSFC 51172228, 21101149, 51172227, 51272248, 20921002).
Notes and references
- P. K. Jain, Adv. Drug Delivery Rev., 2001, 46, 149 CrossRef.
- L. H. Reddy, J. Pharm. Pharmacol., 2005, 57, 1231 CrossRef CAS.
-
(a) D. D. Li, J. H. Yu and R. R. Xu, Chem. Commun., 2011, 47, 11077 RSC;
(b) Z. Y. Hou, C. M. Zhang, C. X. Li, Z. H. Xu, Z. Y. Cheng, G. G. Li, W. X. Wang, C. Peng and J. Lin, Chem.–Eur. J., 2010, 16, 14513 CrossRef CAS;
(c) M. Vallet-Regi, A. Rámila, P. R. del Real and J. Pérez-Pariente, Chem. Mater., 2001, 13, 308 CrossRef CAS;
(d) M.-Y. Ma, Y.-J. Zhu, L. Li and S.-W. Cao, J. Mater. Chem., 2008, 18, 2722 RSC.
-
(a) E. Aznar, L. Mondragón, J. V. Ros-Lis, F. Sancenón, M. D. Macros, R. Martínez-Máñez, J. Soto, E. Pérez-Payá and P. Amorós, Angew. Chem., Int. Ed., 2011, 50, 11172 CrossRef CAS;
(b) X. J. Kang, Z. Y. Cheng, D. M. Yang, P. A. Ma, M. M. Shang, C. Peng, Y. L. Dai and J. Lin, Adv. Funct. Mater., 2012, 22, 1470 CrossRef CAS;
(c) N. Liu, D. R. Dunphy, P. Atanassov, S. D. Bunge, Z. Chen, G. P. Lopez, T. J. Boyle and C. J. Brinker, Nano Lett., 2004, 4, 551 CrossRef CAS;
(d) N. K. Mal, M. Fujiwara and Y. Tanaka, Nature, 2003, 421, 350 CrossRef CAS;
(e) T. D. Nguyen, Y. Liu, S. Saha, K. C. -F. Leung, J. F. Stoddart and J. I. Zink, J. Am. Chem. Soc., 2007, 129, 626 CrossRef CAS;
(f) Y. Yan, Y. J. Wang, J. K. Heath, E. C. Nice and F. Caruso, Adv. Mater., 2011, 23, 3916 CrossRef CAS;
(g) E. S. G. Choo, B. Yu and J. M. Xue, J. Colloid Interface Sci., 2011, 358, 462 CrossRef CAS;
(h) Y. L. Dai, C. M. Zhang, Z. Y. Cheng, P. A. Ma, C. X. Li, X. J. Kang, D. M. Yang and J. Lin, Biomaterials, 2012, 33, 2583 CrossRef CAS;
(i) Y. H. Ma, L. Zhou, H. Q. Zheng, L. Xing, C. G. Li, J. H. Cui and S. A. Che, J. Mater. Chem., 2011, 21, 9483 RSC;
(j) J. -B. Qu, L. -Y. Chu, M. Yang, R. Xie, L. Hu and W. -M. Chen, Adv. Funct. Mater., 2006, 16, 1865 CrossRef CAS;
(k) A. Curcio, R. Marotta, A. Riedinger, D. Palumberi, A. Falqui and T. Pellegrino, Chem. Commun., 2012, 48, 2400 RSC;
(l) Y. F. Zhu, W. J. Meng and N. Hanagata, Dalton Trans., 2011, 40, 10203 RSC;
(m) R. Casasús, M. D. Marcos, R. Martínez-Máñez, J. V. Ros-Lis, J. Soto, L. A. Villaescusa, P. Amorós, D. Beltrán, C. Guillem and J. Latorre, J. Am. Chem. Soc., 2004, 126, 8612 CrossRef.
-
(a) Q. Yang, S. C. Wang, P. W. Fan, L. F. Wang, Y. Di, K. F. Lin and F. -S. Xiao, Chem. Mater., 2005, 17, 5999 CrossRef CAS;
(b) M. Guo, Y. Yan, H. K. Zhang, H. S. Yan, Y. J. Cao, K. L. Liu, S. R. Wan, J. S. Huang and W. Yue, J. Mater. Chem., 2008, 18, 5104 RSC;
(c) E. S. Lee, K. Na and Y. H. Bae, J. Controlled Release, 2005, 103, 405 CrossRef CAS;
(d) W. P. Guo, J. Wang, S. -J. Lee, F. P. Dong, S. S. Park and C. -S. Ha, Chem.–Eur. J., 2010, 16, 8641 CrossRef CAS.
-
(a) G. L. Li, G. Liu, E. T. Kang, K. G. Neoh and X. L. Yang, Langmuir, 2008, 24, 9050 CrossRef CAS;
(b) N. Rapoport, Prog. Polym. Sci., 2007, 32, 962 CrossRef CAS.
- W. Jiang, B. Y. S. Kim, J. T. Rutka and W. C. W. Chan, Nat. Nanotechnol., 2008, 3, 145 CrossRef CAS.
- R. Singh and J. W. Lillard, Exp. Mol. Pathol., 2009, 86, 215 CrossRef CAS.
-
(a) S. H. Tang, X. Q. Huang, X. L. Chen and N. F. Zheng, Adv. Funct. Mater., 2010, 20, 2442 CrossRef CAS;
(b) T. T. Wang, F. Chai, Q. Fu, L. Y. Zhang, H. Y. Liu, L. Li, Y. Liao, Z. M. Su, C. G. Wang, B. Y. Duan and D. X. Ren, J. Mater. Chem., 2011, 21, 5299 RSC;
(c) Y. Zhao, L.-N. Lin and Y. Lu, Adv. Mater., 2010, 22, 5255 CrossRef CAS.
-
(a) L. Li, K. M. Hun, Y. -K. Lee and S. Y. Kim, J. Mater. Chem., 2011, 21, 15288 RSC;
(b) W. X. Chen, Y. F. Cheng and B. H. Wang, Angew. Chem., Int. Ed., 2012, 51, 5293 CrossRef CAS.
- B. P. Timko, T. Dvir and D. S. Kohane, Adv. Mater., 2010, 22, 4925 CrossRef CAS.
-
(a) Z. J. Zhang, L. M. Wang, J. Wang, X. M. Jiang, X. H. Li, Z. J. Hu, Y. L. Ji, X. C. Wu and C. Y. Chen, Adv. Mater., 2012, 24, 1418 CrossRef CAS;
(b) Y. L. Dai, P. A. Ma, Z. Y. Cheng, X. J. Kang, X. Zhang, Z. Y. Hou, C. X. Li, D. M. Yang, X. F. Zhai and J. Lin, ACS Nano, 2012, 6, 3327 CrossRef CAS;
(c) W. W. Wang, D. Cheng, F. M. Gong, X. M. Miao and X. T. Shuai, Adv. Mater., 2012, 24, 115 CrossRef CAS.
- F. Zhang, G. B. Braun, A. Pallaoro, Y. C. Zhang, Y. F. Shi, D. X. Cui, M. Moskovits, D. Y. Zhao and G. D. Stucky, Nano Lett., 2012, 12, 61 CrossRef CAS.
- Y. Chen, H. R. Chen, S. J. Zhang, F. Chen, L. X. Zhang, J. M. Zhang, M. Zhu, H. X. Wu, L. M. Guo, J. W. Feng and S. J. Lin, Adv. Funct. Mater., 2011, 21, 270 CrossRef CAS.
- Y. -S. Lin, S. -H. Wu, Y. Hung, W. -H. Chou, C. Chang, M.-L. Lin, C.-P. Tsai and C. -Y. Mou, Chem. Mater., 2006, 18, 5170 CrossRef CAS.
-
(a) G. Tian, Z. J. Gu, X. X. Liu, L. J. Zhou, W. Y. Yin, L. Yan, S. Jin, W. L. Ren, G. M. Xing, S. J. Li and Y. L. Zhao, J. Phys. Chem. C, 2011, 115, 23790 CrossRef CAS;
(b) Q. Ju, D. T. Tu, Y. S. Liu, R. F. Li, H. M. Zhu, J. C. Chen, Z. Chen, M. D. Huang and X. Y. Chen, J. Am. Chem. Soc., 2012, 134, 1323 CrossRef CAS;
(c) Q. Ju, Y. S. Liu, D. T. Tu, H. M. Zhu, R. F. Li and X. Y. Chen, Chem.–Eur. J., 2011, 17, 8549 CrossRef CAS;
(d) Y. S. Liu, D. T. Tu, H. M. Zhu, R. F. Li, W. Q. Luo and X. Y. Chen, Adv. Mater., 2010, 22, 3266 CrossRef CAS.
-
(a) Y. H. Zheng, H. P. You, G. Jia, K. Liu, Y. H. Song, M. Yang and H. J. Zhang, Cryst. Growth Des., 2009, 9, 5101 CrossRef CAS;
(b) X. Q. Su, B. Yan and H. H. Huang, J. Alloys Compd., 2005, 399, 251 CrossRef CAS;
(c) Y. H. Wang, Y. S. Liu, Q. B. Xiao, H. M. Zhu, R. F. Li and X. Y. Chen, Nanoscale, 2011, 3, 3164 RSC;
(d) R. Liu, D. T. Tu, Y. S. Liu, H. M. Zhu, R. F. Li, W. Zheng, E. Ma and X. Y. Chen, Nanoscale, 2012, 4, 4485 RSC.
-
(a) Z.-L. Wang, J. H. Hao and H. L. W. Chan, J. Mater. Chem., 2010, 20, 3178 RSC;
(b) F. Wang, R. R. Deng, J. Wang, Q. X. Wang, Y. Han, H. M. Zhu, X. Y. Chen and X. G. Liu, Nat. Mater., 2011, 10, 968 CrossRef CAS;
(c) J. Zhou, M. X. Yu, Y. Sun, X. Z. Zhang, X. J. Zhu, Z. H. Wu, D. M. Wu and F. Y. Li, Biomaterials, 2011, 32, 1148 CrossRef CAS;
(d) D. T. Tu, L. Q. Liu, Q. Ju, Y. S. Liu, H. M. Zhu, R. F. Li and X. Y. Chen, Angew. Chem., Int. Ed., 2011, 50, 6306 CrossRef CAS;
(e) Z. L. Wang, J. H. Hao, H. L. W. Chan, W. T. Wong and K. L. Wong, Small, 2012, 8, 1863 CrossRef CAS;
(f) F. Wang, D. Banerjee, Y. S. Liu, X. Y. Chen and X. G. Liu, Analyst, 2010, 135, 1839 RSC;
(g) Q. Ju, D. T. Tu, Y. S. Liu, H. M. Zhu and X. Y. Chen, Comb. Chem. High Throughput Screening, 2012, 15, 580 CrossRef CAS.
-
(a) C.-Y. Hong, X. Li and C.-Y. Pan, J. Mater. Chem., 2009, 19, 5155 RSC;
(b) C. L. Lay, H. R. Tan, X. H. Lu and Y. Liu, Chem.–Eur. J., 2011, 17, 2504 CAS.
- L. Dähne, S. Leporatti, E. Donath and H. Möhwald, J. Am. Chem. Soc., 2001, 123, 5431 CrossRef.
- J.-G. Li, Q. Zhu, X. D. Li, X. D. Sun and Y. Sakka, Acta Mater., 2011, 59, 3688 CrossRef CAS.
-
(a) Z. H. Xu, Y. Cao, C. X. Li, P. A. Ma, X. F. Zhai, S. S. Huang, X. J. Kang, M. M. Shang, D. M. Yang, Y. L. Dai and J. Lin, J. Mater. Chem., 2011, 21, 3686 RSC;
(b) S. Lechevallier, P. Lecante, R. Mauricot, H. Dexpert, J. Dexpert-Ghys, H. K. Kong, G. L. Law and K. L. Wong, Chem. Mater., 2010, 22, 6153 CrossRef CAS.
- H. Xin, L.-X. Lin, J.-H. Wu and B. Yan, J. Mater. Sci.: Mater. Electron., 2011, 22, 1330 CrossRef CAS.
- W. Y. Yin, L. J. Zhou, Z. J. Gu, G. Tian, S. Jin, L. Yan, X. X. Liu, G. M. Xing, W. L. Ren, F. Liu, Z. W. Pan and Y. L. Zhao, J. Mater. Chem., 2012, 22, 6974 RSC.
- S. J. Zeng, J. J. Xiao, Q. B. Yang and J. H. Hao, J. Mater. Chem., 2012, 22, 9870 RSC.
-
(a) N. Ž. Knežević, B. G. Trewyn and V. S. -Y. Lin, Chem.–Eur. J., 2011, 17, 3338 CrossRef;
(b) L. Yuan, Q. Q. Tang, D. Yang, J. Z. Zhang, F. Y. Zhang and J. H. Hu, J. Phys. Chem. C, 2011, 115, 9926 CrossRef CAS;
(c) E. S. Lee, K. Na and Y. H. Bae, Nano Lett., 2005, 5, 325 CrossRef CAS;
(d) Y. Bae, N. Nishiyama and K. Kataoka, Bioconjugate Chem., 2007, 18, 1131 CrossRef CAS;
(e) Q. J. He, Y. Gao, L. X. Zhang, Z. W. Zhang, F. Gao, X. F. Ji, Y. P. Li and S. J. Shi, Biomaterials, 2011, 32, 7711 CrossRef CAS.
-
(a) M. Stubbs, P. M. J. Mcsheehy, J. R. Griffiths and C. L. Bashford, Mol. Med. Today, 2000, 6, 15 CrossRef CAS;
(b) G. O. Liu, X. L. Li, S. D. Xiong, L. Li, P. K. Chu, K. W. K. Yeung, S. L. Wu and Z. S. Xu, Colloid Polym. Sci., 2011, 290, 349 CrossRef.
|
| This journal is © The Royal Society of Chemistry 2013 |
Click here to see how this site uses Cookies. View our privacy policy here. ![[thin space (1/6-em)]](https://www.rsc.org/images/entities/char_2009.gif) :
:![[thin space (1/6-em)]](https://www.rsc.org/images/entities/char_2009.gif) Yb
Yb![[thin space (1/6-em)]](https://www.rsc.org/images/entities/char_2009.gif) :
:![[thin space (1/6-em)]](https://www.rsc.org/images/entities/char_2009.gif) Er = 78
Er = 78![[thin space (1/6-em)]](https://www.rsc.org/images/entities/char_2009.gif) :
:![[thin space (1/6-em)]](https://www.rsc.org/images/entities/char_2009.gif) 20
20![[thin space (1/6-em)]](https://www.rsc.org/images/entities/char_2009.gif) :
:![[thin space (1/6-em)]](https://www.rsc.org/images/entities/char_2009.gif) 2) and urea (1.5 g) were added into a mixed solvent of H2O–DEG. PVP (3 g) was dissolved into the above solution under magnetic stirring until a transparent solution was formed. The total volume of the solution was about 300 mL. The resultant solution was then reacted at 90 °C for 3 h in the oil bath. The obtained suspension was separated by centrifugation and collected after washing with deionized water and ethanol several times. The Gd(OH)CO3:20%Yb3+/0.4%Ho3+, Gd(OH)CO3:20%Yb3+/0.2%Tm3+ spheres were prepared by the same synthesis procedure for the Gd(OH)CO3:20%Yb3+/2%Er3+ sample.
2) and urea (1.5 g) were added into a mixed solvent of H2O–DEG. PVP (3 g) was dissolved into the above solution under magnetic stirring until a transparent solution was formed. The total volume of the solution was about 300 mL. The resultant solution was then reacted at 90 °C for 3 h in the oil bath. The obtained suspension was separated by centrifugation and collected after washing with deionized water and ethanol several times. The Gd(OH)CO3:20%Yb3+/0.4%Ho3+, Gd(OH)CO3:20%Yb3+/0.2%Tm3+ spheres were prepared by the same synthesis procedure for the Gd(OH)CO3:20%Yb3+/2%Er3+ sample.
![[double bond, length as m-dash]](https://www.rsc.org/images/entities/char_e001.gif) O stretching vibration in the carboxyl group at 1720 cm−1 and two peaks ascribed to C–H stretching vibrations at 2927 and 2856 cm−1 appeared, which further validated the formation of inorganic–organic hybrid materials.14 Quantitative determination of the polymer content was executed by TG analyses, as shown in Fig. 2. A comparison of TG data for GdVO4:Yb3+/Er3+ and PAA@GdVO4:Yb3+/Er3+, suggested that 18 wt% of PAA is impregnated into hollow spheres.
O stretching vibration in the carboxyl group at 1720 cm−1 and two peaks ascribed to C–H stretching vibrations at 2927 and 2856 cm−1 appeared, which further validated the formation of inorganic–organic hybrid materials.14 Quantitative determination of the polymer content was executed by TG analyses, as shown in Fig. 2. A comparison of TG data for GdVO4:Yb3+/Er3+ and PAA@GdVO4:Yb3+/Er3+, suggested that 18 wt% of PAA is impregnated into hollow spheres.


![Inverted fluorescence microscope images of HeLa cells incubated with PAA@GdVO4:Yb3+/Er3+ ([PAA@GdVO4:Yb3+/Er3+] = 100 μg mL−1) for 6 h. Each image can be classified to the bright-field (a), the nuclei of cells being dyed in blue by Hoechst 33324 (b), up-conversion luminescent images (c) in dark, and overlay of above (d). All scale bars are 20 μm.](/image/article/2013/NR/c2nr33130f/c2nr33130f-f6.gif)


![CLSM images of HeLa cells incubated with DOX-loaded PAA@GdVO4:Yb3+/Er3+ sample ([DOX] = 20 μg mL−1) for 10 min (a–c), 1 h (d–f), 6 h (g–i) at 37 °C. Each series can be classified to the nuclei of cells (being dyed in blue by Hoechst 33324 for visualization), DOX-loaded PAA@GdVO4:Yb3+/Er3+ sample, and a merge of the two channels of both above, respectively. All scale bars are 40 μm. The excitation wavelength of Hoechst 33324 and DOX are 405 and 543 nm, respectively. The red emission (572 nm) is from DOX.](/image/article/2013/NR/c2nr33130f/c2nr33130f-f11.gif)
