Modulation of an IDP binding mechanism and rates by helix propensity and non-native interactions: association of HIF1α with CBP†‡
David
De Sancho
and
Robert B.
Best
*
Cambridge University, Department of Chemistry, Lensfield Road, Cambridge CB2 1EW, UK. E-mail: rbb24@cam.ac.uk; Tel: +44-1223-336470
First published on 2nd September 2011
Abstract
Intrinsically disordered proteins that acquire their three dimensional structures only upon binding to their targets are very important in cellular signal regulation. While experimental studies have been made on the structures of both bound (structured) and unbound (disordered) states, less is known about the actual folding–binding transition. Coarse grained simulations using native-centric (i.e.Gō) potentials have been particularly useful in addressing this problem, given the large search space for IDP binding, but have well-known deficiencies in reproducing the unfolded state structure and dynamics. Here, we investigate the interaction of HIF1α with CBP using a hierarchy of coarse-grained models, in each case matching the binding affinity at 300 K to the experimental value. Starting from a pure Gō-like model based on the native structure of the complex we go on to consider a more realistic model of helix propensity in the HIF1α, and finally the effect of non-native interactions between binding partners. We find structural disorder (i.e. “fuzziness”) in the bound state of HIF1α in all models which is supported by the results of atomistic simulations. Correcting the over-stabilized helices in the unbound state gives rise to a more cooperative folding–binding transition (destabilizing partially bound intermediates). Adding non-native contacts lowers the free energy barrier for binding to an almost barrierless scenario, leading to higher binding/unbinding rates relative to the other models, in better agreement with the near diffusion-limited binding rates measured experimentally. Transition state structures for the three models are highly disordered, supporting a fly-casting mechanism for binding.
1 Introduction
The coupled folding and binding of intrinsically disordered proteins (IDPs) to their targets has generated much recent interest,1,2 because of their roles in biological signal transduction. In the simplest scenario for the binding mechanism, an initially disordered protein adopts a specific structure to form an ordered complex. Being sensitive to populated states, experimental methods have yielded important insights into the stable endpoints of the reaction. For ordered complexes conventional structural biology techniques have been used to determine the bound structures of IDPs (sometimes in combination with different targets). This has made it possible to establish the predominant types of chemical interactions that stabilize the protein–protein complexes at their interfaces3 and to identify molecular recognition sites that allow for IDP promiscuity.4 On the other end of the process, the unfolded/unbound state has also been characterized extensively.5–7 Biophysical techniques have provided a general understanding of the polymer properties of disordered states and their response to changes of conditions in the cellular milieu.8,9 Bioinformatic analyses have correlated the results from experiments with details on IDP sequences and accurate predictors of disorder in the unbound state have been developed.10 In spite of the success in studying the bound and unbound states, understanding the actual conformational transition between the free and bound forms (i.e. the folding/binding step) remains a more challenging goal for experiments. The binding kinetics of a few systems have now been extensively characterized,11–16 often through NMR relaxation-dispersion,17 but also recently through laser temperature-jump experiments.16 However, many qualitative aspects, such as when an induced fit or conformational selection mechanism best describes binding, are still being discussed.18–20Molecular simulations provide information complementary to experiment, namely an atomically resolved description of the binding process at very high time resolution. However state-of-the-art molecular dynamics simulations either in an implicit or explicit solvent, that have been attempted in a few cases for IDPs,21–26 are generally too expensive computationally for system sizes of interest (typically two proteins comprising a total of more than 100 amino acids). This is especially true if, as is desirable, we want to observe a large number of binding events in order to obtain meaningful statistics. As an alternative, theorists have turned to coarse-grained simulation models based on the native conformation of the complex, that have been very successful in the last two decades for the study of the related process of protein folding.27–33
Simple topology based (i.e.Gō) models embody some of the predictions of energy landscape theory,34,35i.e. that the folding energy landscape is funneled and the free energy minimum corresponds to the native conformation. For binding, the topology of protein–protein complexes has also been shown to be the major determinant of the mechanism, at least for dimers of single domain globular proteins.36 Therefore the application of this type of model to IDP binding seems justified. Nonetheless, structure-based models usually rely only on the native contact map and they may lack some details that are expected to be important in IDPs, especially if we consider the importance of the unfolded state description.
Here we investigate the binding of the C-TAD domain of HIF1α to the TAZ1 domain of CBP, resulting in a high affinity complex (with KD reported to be between 7 nM for the dehydroxylated HIF1α and 143 nM for HIF1α-OH).13,37 This system is especially important for its involvement in the response to hypoxia during tumour growth.38HIF1α is actually expressed as a long 826 residue protein with several functional domains (see Fig. 1a), which are tightly regulated by O2 concentration. Under normoxic conditions HIF1α is hydroxylated and degraded by the proteasome.39 However, when the oxygen pressure decreases HIF1α is not hydroxylated and accumulates in the nucleus, where it binds to the TAZ1 domain of CBP through the C-TAD domain, triggering the hypoxic response. Although the binding of HIF1α to CBP is clearly of great interest for therapeutic applications,40 it has been studied using biophysical techniques only recently.13,37
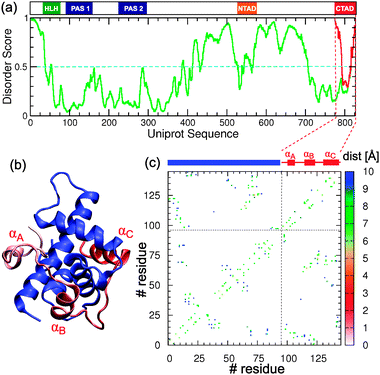 | ||
| Fig. 1 (a) Domain structure of the full sequence HIF1α (Uniprot: Q16665) and disorder score for the full sequence (green) and the isolated C-TAD domain (red) calculated from PONDR-FIT.41 The cyan dashed line marks the threshold in the disorder score (0.5) over which residues are predicted to be disordered. (b) Cartoon representation of the experimental NMR structure of the complex formed by the TAZ-1 domain of CBP in blue and the CAD domain of HIF1α in different shades of red (PDB id: 1L8C). (b) Contact map with the inter-Cα distances for the HIF1α–CBP complex. The blue and red segments mark the limits of CBP and helices αA, αB and αC of HIF1α. | ||
In the context of the natural sequence the C-TAD domain of HIF1α is predicted to be disordered in its C-terminus by a state-of-the-art disorder meta-predictor41 (see Fig. 1a), while in isolation the C-TAD domain is predicted to become more disordered. C-TAD is also predicted to have a very small population of α-helix by Agadir42 (only 1.76%), with the region corresponding to helix αC of the CBP-bound state being the most helical (11%). In fact the C-TAD domain of HIF1α has been shown to exhibit random-coil properties in CD and NMR experiments.37 Relaxation dispersion experiments have shown that HIF1α binds to CBP in a coupled folding and binding reaction with on-rates that are as fast as ≃109 M−1 s−1.13 The structure of the bound complex is also intriguing, consisting of the IDP wrapping completely around the TAZ1 domain, and forming three helices (αA, αB and αC; see Fig. 1b and c). This distinguishes it from most of the previous IDPs studied using molecular simulation, which generally form a more localized binding interface involving only one or two helices. Examples include pKID-KIX,28–32 p53/S100Bβ32 and recently the protein inhibitor IA3.16,33 The extensive binding interface raises obvious questions about possible alternative binding mechanisms and the role of “fly-casting”43 (i.e. rate enhancement due to an increased capture radius) in locating the folded complex.
The paper is organized as follows. We first describe a series of models, starting with a well-established “flavoured” Gō model44 (i.e. one that includes sequence effects), and progressively including more detail: (i) we correct the torsional description so that it resembles that obtained from atomistic simulations from an accurate force field,45 in order to better capture the helical population in the unbound state; (ii) we consider the effects of non-native interactions and electrostatic terms, combining the Gō model with a transferable coarse grained model for protein–protein binding.46 In all cases, we balance the energies to match the KD in the experimental range at 300 K. By comparing the different models under conditions where the KD is similar, we remove the effects of differing stability in the comparison of energy landscapes, free-energy barriers and binding rates. From this we are able to assess the effect of more realistic descriptions of molecular interactions in the binding scenarios as produced from coarse-grained simulation models.
2 Materials and methods
In this study we use a protein model coarse grained to a single bead per residue located at the Cαcarbon atom, based on the NMR structure for the HIF1α–CBP complex (PDB ID: 1L8C).37 Although topology based simulations of folding with different NMR models for the same structure have shown that they may result in somewhat different characteristics for the transition,47 here we limit our analysis to the model considered by the authors of the original structure as the most representative (see Fig. 1).2.1 Structure based model
In the Karanicolas and Brooks “flavoured” Gō model the potential energy function is a sum of harmonic terms for bonds and angles, a statistical potential for the pseudo-dihedrals and terms for non-bonded interactions.44 Favourable non-bonded interactions are limited to those residue pairs that are in contact in the native conformation of the complex (i.e. have at least one side-chain heavy atom pair at a distance shorter than 4.5 Å).44 For one such pair of residues (i, j) the interaction is expressed using a Lennard-Jones type potential | (1) |
2.2 Adjustment of backbone potential
As has been observed earlier32 the Gō model we use here strongly favours helical unfolded states. This is due to the fact that the pseudo-dihedral potential is a statistical potential based on the PDB,44 and all such potentials have a strong α-helical bias due to the frequency of helical residues in the database. A previous strategy to correct for this helical propensity involved scaling the intramolecular contacts so that helical contacts are less favoured.32 Here we instead modify the dihedral term that causes the problem. In atomistic MD simulations with force-fields optimized against helix–coil transition data45 we have found that the bias is actually 1.5 kBT (0.9 kcal mol−1) in favour of “coil” conformations (versus 1.5 kBT in favour of helix in the statistical backbone potential). We therefore adjust the Gō torsion potential empirically by adding a term V(ϕ) = kϕ cos[ϕ − δ], with kϕ = −1.16 kcal mol−1 and δ = 297.35° to all the pseudo torsion angles. This raises the alpha minimum with respect to the extended (β/ppII) minimum by a fixed amount (see details in the Results section).2.3 Non-native interactions and electrostatics
In addition to the correction to the pseudo-dihedrals, we introduce electrostatic effects and non-native interactions using the description of these terms in the Kim–Hummer model,46 a sequence-based potential for defining protein–protein interactions. The electrostatic contribution is given by a Debye–Hückel form | (2) |
In this version of the model, all (originally repulsive) non-native interactions are replaced by a transferable (sequence-based) potential which can be either attractive or repulsive, depending on the value of the interaction strength εij in the Miyazawa–Jernigan-derived contact potential between residues i and j.46,48 These contact energies accurately reflect the strength of inter-residue interactions due to the different hydrophobicity of amino-acid pairs.48 This description is therefore suitable for IDPs, that typically have less hydrophobic sequences than globular proteins.49 For attractive pairs (εij < 0) the energy is calculated using a standard Lennard-Jones potential
 | (3) |
 | (4) |
2.4 Coarse grained simulations
For the different versions of the coarse grained model we run long equilibrium simulations at temperatures ranging from 270 to 400 K. We propagate the dynamics using a Langevin integrator as implemented in the Gromacs 4.0.5 simulation package50 with an integration time-step of 10 fs. For each model we obtain an aggregate simulation time of ∼130 μs. We apply periodic boundary conditions to a cubic box of 94 Å, resulting in a protein concentration of 2 mM. We set a low external friction coefficient of 0.2 ps−1 to accelerate the dynamics. Bond constraints are imposed using LINCS and simulation snapshots are collected every 100 ps.Since we are mainly interested in the dynamics of HIF1α upon binding, we restrain CBP so that it remains folded at all temperatures. We do this by imposing a biasing potential on the fraction of intramolecular contacts (QCBP ≃ 0.9, see below). This bias is necessary to mimic the stabilizing effect of the bound Zn+2 ions on CBP, since the ions are not explicitly present in our model.
2.5 Atomistic simulations
To check some of the predictions from the coarse-grained model we run atomistic MD simulations of the bound state of the HIF1α–CBP complex using Gromacs 4.5.3.50 We use a force field optimized to reproduce equilibrium observables for short peptides45 and an accurate model for water.51 We prepare the simulation using the first model structure from the PDB coordinate file (PDB: 1L8C). The Zn binding sites have been modeled on the deprotonated CYM residue in the force field, with the charge on the Zn chosen to provide an overall charge of −1 for each site (with Zn liganded by three Cys and one His). Bond and angle parameters were taken from a published study of similar zinc finger binding sites.52 The protein is solvated by 4729 water molecules in an octahedral simulation box with 4.9 nm between closest walls. The resulting system is then energy minimized and Cl− anions added to preserve electroneutrality. We run constant pressure molecular dynamics with a time-step of 2 fs using the Berendsen thermostat and Parrinello–Rahman barostat. Simulations were run at 300 and 350 K and pressure 1 bar. Long range electrostatics are treated using a particle mesh Ewald method using a grid spacing of 0.12 nm and a real space cut-off of 0.9 nm. A cutoff of 1.4 nm was used for Van der Waals interactions. We use the equilibrated structure after 1 ns as a reference for the RMSD calculations.2.6 Data analysis
We monitor folding and binding using, respectively, the fraction of intra and intermolecular native contacts, Q, with the continuous definition: | (5) |
To estimate the degree of residual structure in the unbound state we calculate the fraction helix, fhelix, using a Lifson–Roig type of definition.55 Since in the coarse-grained model there is no access to the Ramachandran angles, we base our definition on the dihedral angle θi between beads (i, i + 4). A dihedral is considered to be helical if the value of θi is between −35° and 145°, corresponding to the helical well. A helical segment is then the one that has at least three contiguous dihedrals which are helical.
We calculate the dissociation constant from the fraction of bound (pb) and free (pu) states of the molecule, and the total protein concentration ([Protein], including bound and unbound) as:
 | (6) |
 and pb = (1 − pu), with Q* = 0.1 being the value of a dividing line in the PMF between the bound and unbound states.
To calculate rates we use time correlation functions for the minimum distance between the two proteins (dmin),
 | (7) |
To analyze reaction coordinates for binding and identify transition states, we use a Bayesian criterion.56,57 Transition paths are defined for the projection on an order parameter r as those fragments of the trajectory connecting the unbound state (with r = rU) and the bound state (r = rN). From the observed transitions we obtain the conditional probability density of r for transition paths, p(r|TP), and using Bayes' theorem we obtain the probability of being on a transition path given the value of the order parameter r.
 | (8) |
3 Results and discussion
3.1 Calibration of coarse grained models
We first examine the thermodynamics of binding obtained from the different coarse-grained models: the “off-the-shelf” Gō model (Fig. 2a and b), the Gō model with torsional corrections (hereafter, Gō-fixα; Fig. 2c and d) and the Gō model with non-native interactions and electrostatics (Gō-nonnative; Fig. 2e and f). Our aim is to calibrate the three models so that they match the KD in the range of experimental values (7 nM–143 nM).13,37 This is important not only for being able to compare with experiment, but also because it allows us to factor out stability effects in our analysis of the dynamics of the different simulation models.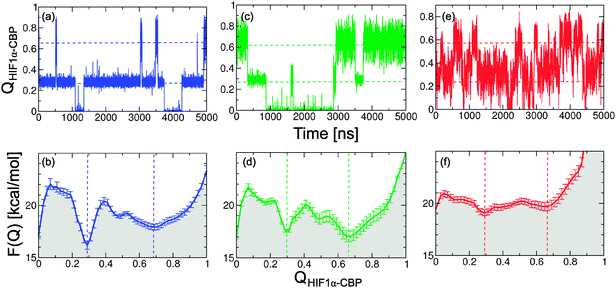 | ||
| Fig. 2 Description of the binding process from the structure-based models. Time series for the fraction of native contacts, QHIF1α–CBP, at 310 K (top) and corresponding potentials of mean force (bottom). (a, b) Gō model; (c, d) Gō-fixα model; and (e, f) Gō-nonnative model. The dashed lines mark the positions in QHIF1α–CBP of the intermediate and bound free energy wells. | ||
We first show the projection of the simulation data on the fraction of native intermolecular contacts (QHIF1α–CBP; see Fig. 2a, c and e) and the corresponding PMFs (panels b, d and f). At 310 K we see that in all three models the system hops between three different states: the unbound state (U) at QHIF1α–CBP ≃ 0, a broad fully bound state at high values of QHIF1α–CBP (B) and an intermediate (I). To calculate KD we lump together the intermediate and fully bound states into a single bound state B–I, separated from the unbound by Q* = 0.1 and obtain KD using eqn (6) (see Fig. 3). We note that the resulting value is not very sensitive to small changes in Q*. The same type of calculation using the projection on the distance between protein centers of mass yields very similar results (Fig. 3, dashed lines), confirming the robustness of our estimate of KD for the simulation models.
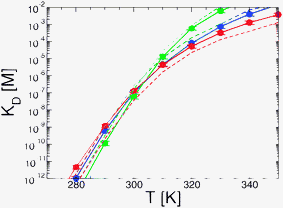 | ||
| Fig. 3 Dissociation constant (KD) as a function of temperature for the three coarse grained models: Gō (blue), Gō-fixα (green) and Gō-nonnative (red). Note that the experimental KD at room temperature is in the range of 10−9–10−7 M. Straight lines and circles correspond to the calculation by integrating over the PMFs on the fraction of native intermolecular contacts QHIF1α–CBP. Dashed lines are the values of KD obtained using the projection on the distance between centers of mass of HIF1α and CBP. | ||
Remarkably, given its simplified nature, the Gō model is able to produce a KD in the experimental range (1.03 ± 0.24 × 10⁻⁷ M) without any adjustment. The Gō-fixα and Gō-nonnative models however require some fine-tuning of the potential. This may be justified since the stability of the Gō model is set by balancing the total native contact energy against the loss of entropy on folding, which for an N-residue protein is approximated by Nωres, where ωres is a per-residue folding entropy.44 The value of ωres has been calibrated with the original torsion potential, and a different value may need to be used in conjunction with the Gō-fixα model, for example. We use uniform scaling of the interaction strengths as an efficient and unbiased way to calibrate the potential.32 We introduce these changes using the Gō model as a reference for the parametrization, because we would ultimately like to compare all models at similar stability.
For the Gō-fixα model to reproduce the experimental KD we uniformly increase the strength of all native contacts by 6% (see Fig. 3). The Gō-fixα model produces a very similar overall picture of binding with three distinct states (Fig. 2c and d), although the system spends less time in intermediate values of QHIF1α–CBP. In the Gō-nonnative model the additional terms from the Kim–Hummer model for non-native interactions would result in too high an affinity for the complex. The Kim–Hummer model was carefully parameterized to reproduce low affinity protein–protein interactions, using experimental second virial coefficients and protein–protein dissociation constants in the micromolar range.46 Therefore, we instead tune the strength of the native contacts, which produce binding specificity. We recover the experimental KD reducing the strength of all intermolecular native interactions by 10% with reference to the Gō model (Fig. 3). Interestingly, in the resulting Gō-nonnative model the transitions seem much more frequent than in the Gō and Gō-fixα versions (Fig. 2e), as we discuss further below. Furthermore, the bound state appears to be no longer split into two metastable states but now consists in a very broad free energy basin (Fig. 2f). This suggests that the inclusion of non-native interactions causes a substantial shift of binding mechanism, as we investigate in detail below.
3.2 “Fuzziness” and stability of the bound complex
While at 310 K we see the bound (B) and unbound (U) states interconvert through an intermediate (I, see Fig. 2a) at lower temperatures almost only the intermediate and fully bound states are significantly populated, corresponding to high affinity binding (see Fig. 5). In state I, HIF1α remains bound to CBP by helix αC while the remainder of the protein is unbound and disordered (see Fig. 5c). No specific evidence for intermediates in the HIF1α–CBP transition has been reported experimentally. However, we note that in the relaxation dispersion experiments by Sugase and co-workers only helix αC was probed.13Further insight into the contributions of the different helices to the stability of the bound state has been obtained from experiments on different shorter constructs of HIF1α. These showed that the fragment comprising helices αB and αC (790–826) was able to bind with a KD only 5 fold larger than that of the full sequence (776–826).37 We have run simulations on this fragment and we observe the same change in the affinity (KD increases from 1.03 × 10⁻⁷ M to 6.74 × 10⁻⁷ M), confirming that αA contributes little to the total affinity. However, a shorter fragment (808–826) which had a much decreased affinity in the experiments retains approximately the same affinity as the longer fragment in our simulations (KD = 6.39 × 10⁻⁷ M). This suggests that the Gō model over-stabilizes helix αC and therefore the intermediate state with only αC bound.
An interesting prediction of the Gō model is a very heterogeneous bound state, as revealed by the broad free energy basin in the projection on QHIF1α–CBP (see Fig. 5d). The protein shifts rapidly between highly ordered native-like conformations (with QHIF1α–CBP ≃ 0.8) and less ordered conformations (with QHIF1α–CBP as low as 0.4), where helix αA is not perfectly packed against CBP. Other regions that transiently dissociate from the complex are helix αB and the loop between αB and αC (QHIF1α–CBP ≃ 0.7). This seems consistent with the observation of a poorly defined N-terminal region in the NMR structure37 and the heterogeneity in the NMR models between helices αB and αC. However the NMR models are clearly much less heterogeneous than the bound state in the coarse grained simulations as seen when we calculate the RMSD from the initial structure (see Fig. 5e).
In order to test the prediction of a heterogeneous bound state we have run a set of atomistic MD simulations of the HIF1α–CBP complex with a force field45 optimized to match experimental data on short peptides when combined with an accurate model for water (TIP4P/2005)51 (see Methods). We examine the dynamics of the bound state in 20 ns runs at 300 K and 350 K from the RMSD of the energy minimized structure (see Fig. 5e). We use the run at higher temperature to enhance sampling of the bound conformation and provide an upper bound to the expected fluctuations at a lower temperature. We compare the results of the atomistic MD runs with the conformations sampled at 280 K, where only the B basin is populated.
We find that the structures from the atomistic MD simulations both at 300 K and 350 K are considerably more heterogeneous than the experimental NMR models, regardless of the short time-scales explored in these simulations (see Fig. 5e and f). In fact, the fluctuations observed in the atomistic simulations at 300 K are remarkably close to those obtained with the Gō model under stabilizing conditions, with the exception of residues 20–35 where larger fluctuations are observed for the Gō model. However, these larger fluctuations are nonetheless within the range sampled by the atomistic models at 350 K, which we use to estimate an upper bound for likely fluctuations in the bound state (since atomistic simulations cannot be run for the length of time which may be needed to sample larger bound state fluctuations). Taken together, these results suggest that HIF1α forms a fuzzy complex with CBP, i.e. one that retains a significant degree of disorder even in the bound state.58
3.3 Backbone correction to balance helix and extended structure in the unbound state
While the overall consistency between the dissociation constant and the fluctuations in the structure of bound HIF1α gives some confidence in the picture provided by the structure-based model, there are experimental signatures that the Gō model fails to reproduce (see Fig. 6). From equilibrium simulations of isolated HIF1α at 300 K we obtain the distributions of the radius of gyration (Rg) and the fraction of helix (fhelix) in the Gō model (Fig. 6a and b, top). Both clearly show that even in isolation HIF1α remains highly structured, a common deficiency of native-centric models. The average fraction of helix 〈fhelix〉 is 0.48, very close to that of HIF1α in the experimental structure of the complex (fhelix = 0.5). This is due to the secondary structure elements that remain formed to a large extent in the unbound state. As a result, in the presence of CBP the binding transition occurs mostly from a state where the helical segments in HIF1α are largely folded (i.e. binding starts from large QHIF1α values; see Fig. 4a). These results are in conflict with the observation from CD and NMR spectroscopy measurements that HIF1α exhibits largely random coil properties in the unbound state.37 Obtaining an accurate representation of the unbound state is important for the resulting picture of the binding mechanism because excessive helix propensity may impose a conformational selection scenario.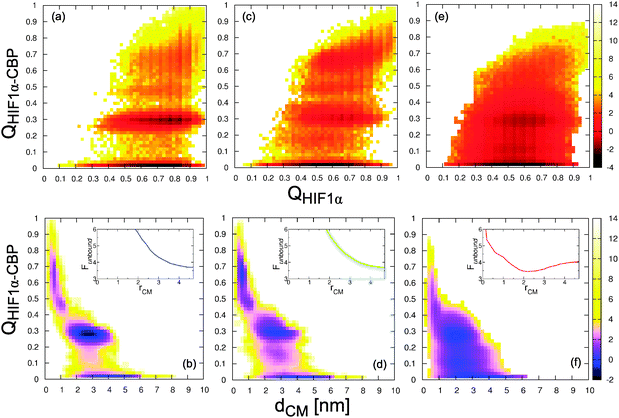 | ||
| Fig. 4 Two dimensional PMFs for the fraction of native intermolecular contacts QHIF1α–CBPvs. the intramolecular contacts in the IDP, QHIF1 (top), and the distance between centers of mass, dCM (bottom). The insets show the effective pair potential between the protein centres of mass in the unbound state (defined as QHIF1α–CBP < 0.1). (a, b) Gō model; (c, d) Gō-fixα; (e, f) Gō-nonnative. All energies are in kcal mol−1. | ||
Previous studies have noted that Gō-like models result in a large amount of preformed helical structure32 in unfolded or unbound proteins. In our model, this is a consequence of the statistical nature of the pseudo-dihedral potential, built from an analysis of a subset of structures of the (predominantly helical) PDB.44 Ganguly and Chen have corrected this bias by introducing weaker helical contacts in the IDP.32 Here we adopt an alternative approach in which we rebalance the backbone potential to obtain a more realistic helix–coil equilibrium. We use as a guide the relative weights of helical and extended states in atomistic molecular dynamics (MD) simulations59 carried out with an energy function specifically optimized to reproduce the helix–coil transition.45
In Fig. 6(d) we compare the distribution in the pseudo-dihedral angle in the isolated HIF1α in the Gō model simulation with that of the Ala5peptide obtained from atomistic MD. While in the atomistic model the minimum corresponding to the α-helical population (ϕ ≃ 45) has a higher free energy than the β/coil well (ϕ ≃ −120), the statistical potential in the Gō model produces the opposite effect. In the Gō-fixα model we introduce a uniform correction for all dihedrals (see Methods). We see that with this subtle change we approximately recover the correct balance between the α and β wells obtained from atomistic simulations (see Fig. 6d). In turn the amount of preformed structure in the unbound state is considerably reduced, with 〈fhelix〉 decreasing to 0.08 (see Fig. 6b). The distribution of the radius of gyration is also shifted to slightly higher distances (see Fig. 6a).
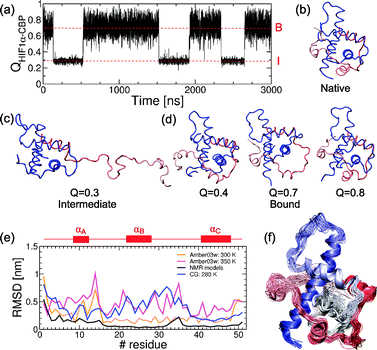 | ||
| Fig. 5 Bound state description from the Gō model, atomistic simulations and experiments. (a) Time series for the fraction of intermolecular contacts QHIF1α–CBP at 300 K. The red dashed lines mark the mean values for the intermediate (I) and bound (B) states. We show snapshots for the reference structure for the native complex (b), the intermediate (c) and the heterogeneous bound state found in the simulations (d). (e) Heterogeneity of the bound state in the experimental NMR models, atomistic simulations and coarse grained simulations. The reference for the Cα-RMSD calculations is the first experimental NMR model but for the atomistic simulations, where we use the energy minimized structure after 1 ns dynamics (see text). The positions of the different helices in the sequence are shown schematically in red. (f) Representative snapshots of the heterogeneous bound state in the atomistic simulations at 300 K. | ||
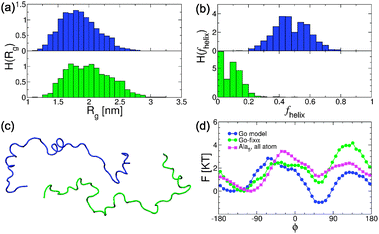 | ||
| Fig. 6 Effects of the dihedral potential correction in the unfolded state description. Probability distributions of the radius of gyration Rg (a) and the fraction helix fhelix (b) in the Gō and Gō-fixα. (c) Representative snapshots from the simulations of isolated HIF1α. (d) Comparison of the PMFs of the pseudo-dihedral angle distribution for HIF1α from coarse grained simulations with the Gō and Gō-fixα models and that of Ala5 from atomistic simulations. In all panels blue and green correspond to the Gō and Gō-fixα models, respectively. | ||
3.4 The backbone correction results in higher cooperativity of binding
The changes in helix propensity in the isolated HIF1α have marked consequences for the binding mechanism. First, the unbound state is centered at slightly lower values of QHIF1α, from which the binding event occurs (see Fig. 4c). Second, the simulation spends much less time at intermediate values of QHIF1α–CBP compared to the Gō model (see Fig. 2a and c), due to an overall loss of stability of the intermediates; i.e. the binding is more cooperative since a stable bound complex requires a larger binding interface. Third, we now observe the formation of two different intermediate states (although they are lumped together in the PMF, being in the same range of values of QHIF1α–CBP: Fig. 2d). This can be clearly seen by examining in detail a projection of a simulation trajectory at 310 K (Fig. 7), where the intermediates IA and IC, with either helix-αA or helix-αC bound forms being possible, and where both can potentially lead to the fully bound state.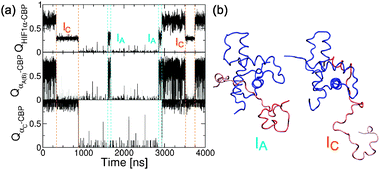 | ||
| Fig. 7 Effects of the dihedral correction in the binding mechanism. (a) Projection of the simulation at 310 K on the fraction of native contacts for the whole HIF1α, QHIF1α–CBP (top), for helix αA (center) and for helix αC (bottom). The projection for helix αB (center, gray lines) is shown with that of αA since they occur simultaneously. (b) Snapshots from the simulation trajectory of the two intermediate states IA and IC. | ||
These new features of the Gō-fixα models are in fact all interconnected. The change of mechanism, with flux going through two different channels, is a by-product of the rebalancing of the α and β/coil wells. The correction in the dihedrals destabilizes the more helical IC intermediate, that in the Gō model was very stable due to the larger helicity of helix αC (8 helical residues compared to only 4 for αA, according to DSSP assignment).60 In the Gō-fixα model both intermediates can form because of the increased requirement for intermolecular contacts to stabilize secondary structure elements. Native inter-protein contacts are very similar in number in the interface of CBP with helix αA (25 contacts) and αC (20). This also explains that αB with high helicity in the bound state (7 helical residues) but few contacts (only 14) is not observed to bind independently of the other helices.
Therefore we find that small modulations in the structure of the unbound state can have a strong effect on binding mechanism, emphasizing the importance of carefully constructing coarse-grained simulation models for the study of IDPs. We note however that the changes in the torsional potential also decrease the helicity in the bound state, since contacts can form without the need to populate helical torsion angles. A desirable future development of structure based models would be a potential for hydrogen bonded interactions that allows us to better recover the geometry of α-helices without artificially biasing the torsional potential.61
3.5 Non-native interactions result in a lowering of the barrier and accelerated kinetics for binding
Although Gō-like models have been relatively successful in describing the coupled folding–binding of IDPs, there is evidence of transient encounter complexes involving non-native interactions,12 which clearly will never be captured by such models. We therefore also consider adding, in conjunction with the modified backbone potential, a transferable potential for protein–protein interactions, in order to describe non-native binding. The model includes a sequence-specific pair potential applied to all residue pairs which do not form native interactions, and an electrostatic potential applied to all residues. A clear advantage of the parametrization that we use, by Kim and Hummer,46 is that it allows us to consider the effects of charges and the low hydrophobicity that is typically characteristic of IDPs.In the simulations with the resulting Gō-nonnative model we find that the additional non-native terms have important consequences for the folding/binding energy landscapes (see Fig. 2e, f and 4e, f). First, the bound ensemble can no longer be easily divided into different microstates (i.e. IA, IC, B) as for the Gō and Gō-fixα models. Now we find a very broad free energy basin that spans the whole range of bound values for QHIF1α–CBP. Second, the binding transition appears less cooperative, with the proteins spending much more time at intermediate values of QHIF1α–CBP (see Fig. 2e). This translates into a marginal apparent free energy barrier between unbound and bound states for the Gō-nonnative model in this projection (Fig. 2f). At midpoint conditions the barriers decrease from the ∼5 kcal mol−1 (i.e. ∼7 kBT) for the Gō model to less than ∼2 kcal mol−1 (i.e. ∼3 kBT), reminiscent of a “downhill” scenario proposed for protein folding.35,62–65
The two-dimensional projection on dCM and QHIF1α–CBP (Fig. 4) also suggests very low free energy barriers between the different minima, and significant differences from the other two models explored. Unlike the situation for Gō and Gō-fixα models, in which the decrease in dCM is strongly correlated with formation of intermolecular contacts (QHIF1α–CBP), we observe that binding can now occur from non-specific bound conformations (i.e. those with low dCM and low QHIF1α–CBP in Fig. 4f). We illustrate the formation of these encounter complexes in more detail by zooming in a binding transition path between unbound and fully bound states (Fig. 8). From the unbound state (high dCM, t ≃ 30–40 ns) HIF1α binds by forming a contact between the C-terminal region (i.e. that corresponding to helix αC) and a pocket in CBP that in the native structure is bound to helix αA (t ≃ 50 ns). Importantly, non-native contacts start to form first in this transition path, and only later do native interactions take over. Specifically, contacts between the αA region are established (t ≃ 50 ns). The inclusion of the non-native contacts results in a much longer transition path length (more than 200 ns in this instance) due to the frustration induced by the non-native contacts. At t = 150 ns helix αA is tightly bound to CBP, with the binding being completed by the formation of native contacts with αB and αC (the corresponding increase in the fraction of non-native contacts is due to interactions in the vicinity of native pairs).
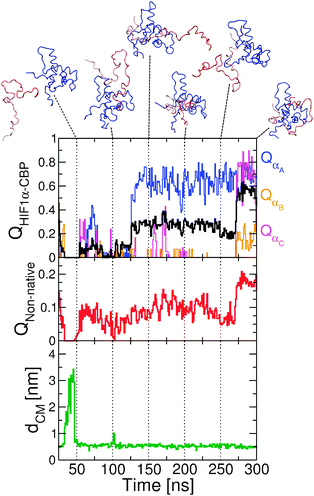 | ||
| Fig. 8 Transition path from the Gō-nonnative model at 320 K. We show the projection of the simulation data on the fraction of native contacts for the whole HIF1α, QHIF1α–CBP and each individual helix QαA, QαB and QαC (top); the fraction of non-native contacts QNon-native (center); and the distance between centers of mass of the two proteins, dCM (bottom). For selected time points we show snapshots from the simulation. | ||
3.6 Kinetics for HIF1α–CBP binding
Of course the effects in the free energy barriers that we observe for both order parameters, QHIF1α–CBP and dCM, may be due at least in part to their quality as reaction coordinates.57 This is particularly true for the Gō-nonnative model, where barriers in these projections are drastically decreased. One might expect that non-native contacts would reduce the quality of the QHIF1α–CBP coordinate in particular. From the analysis of the transition path (Fig. 8) we know that non-native contacts play a role in the initial binding, which cannot be captured by projection on QHIF1α–CBP. However, as we show below, the non-native interactions result in an acceleration of binding kinetics, suggesting that the lowering of the barrier is real.In order to avoid arbitrary definitions of binding and unbinding events, we study the binding kinetics of the different models using time correlation functions. We calculate the auto-correlation function for the minimum distance between HIF1α and CBP, dmin, as defined in eqn (7), near the binding midpoint temperature. The resulting decays (see Fig. 9) have a fast initial decay that cannot be completely resolved, which occurs at a similar time-scale (∼0.1 ns) for all three models and a slower decay which occurs on different time scales for each model. We fit the correlation functions to double exponentials with the parameters being the correlation time of the fast phase (τfast) that we fit globally and the amplitudes and correlation times for the slow phase (Aslow and τslow) that are independent in the fit (i.e. a total of 7 fitting parameters, see Table 1). The fitted correlation time for the fast phase of 0.2 ns can be attributed to the fast fluctuations in the unbound state (see Fig. 9, inset). The slow phase, corresponding to the binding process, is slowest for the Gō model and fastest for the Gō-nonnative model. We note that although the data can be reasonably well fit by the double exponential, a higher quality fit to the relaxation in the Gō-nonnative model can be obtained using the sum of a single and an stretched exponential function of the type C(t) = (1 − Aslow)exp[−t/τfast] + Aslowexp[−(t/τslow)β], with β = 0.52. This fit is similar to the “strange kinetics” observed for barrierless protein folding63 (see Fig. 9, red dashed line).
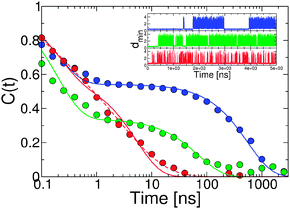 | ||
| Fig. 9 Time correlation functions for the minimum distance between proteins (dmin) for the Gō (blue), Gō-fixα (green) and the Gō-nonnative models (red) under isostability conditions. The lines correspond to double exponential fits to the data. The dashed red line corresponds to a stretched exponential fit. In the inset we show time series for the dmin for the three models. | ||
| τ fast | A slow | τ slow | k off × 104 | k on × 107 | |
|---|---|---|---|---|---|
| Gō | 0.2 | 0.46 | 78.9 | 0.548 | 0.622 |
| Gō-fixα | 0.2 | 0.66 | 38.5 | 1.29 | 6.38 |
| Gō-nonnative | 0.2 | 0.42 | 3.2 | 14.4 | 87.3 |
From the relaxation times fitted to the double exponential expression we can calculate on and off-rates for the binding process (kon and koff), using the values for the KD and protein concentration ([Protein]) and assuming that the observed exponential decay has contributions from both rates (i.e. 1/τslow = koff + kon[Protein]). The resulting values for kon and koff (see Table 1) can be compared with experimental time-scales adjusting for the fact that the dynamics in the simulation are faster due to the low friction (0.2 ps−1; while typical values are 50–100 ps−1).66,67 We therefore scale the rates by 1/100, corresponding to the relative folding rates of proteins at frictions of 0.2 ps−1 and 50 ps−1, obtaining on-rates kon of ∼106 M−1 s−1 for the Gō model and ∼108 M−1 s1 for the Gō-nonnative model. This very fast rate for the association process is in reasonable agreement with experiment (kon = 1.29 × 10⁹ M−1 s−1). Since we have computed binding rates at the binding midpoint temperature, we expect our results to be in better agreement with experiment at lower temperature where the binding rate would be slightly higher as the energy landscape would be more tilted toward the bound state. However our results suggest that the lower barrier given by the Gō-nonnative model is most consistent with the near diffusion-limited experimental binding rates observed for HIF1α–CBP.13
3.7 Mechanism of HIF1α–CBP binding: fly casting, non-native steering and the nature of transition states
Two common themes in the study of IDP binding are (i) the role of the “fly-casting” effect43 and (ii) whether conformational selection or induced fit are good descriptions of the mechanism.18–20 The first aspect can be addressed by examining the unbound state in detail. In principle, if the “fly casting” model applies, there should be a favourable bias for distances between IDP and target close to those of the bound state as a consequence of long-range attractions.36,43 Therefore the PMF should reveal attractive interactions between the two proteins at significant intermolecular separations. This is indeed observed for all models in Fig. 4b, d and f, with a capture radius of ∼4 nm. However, in addition to the conventional fly-casting effect due to native interactions, we also observe an additional enhancement in the model with non-native contacts. These interactions result in a net attraction between the two proteins even in the absence of native contacts. This is seen for the effective pair potentials between the centres of mass of the two proteins, derived only from conformations with QHIF1α–CBP < 0.1 for each of the three models at midpoint conditions (insets in Fig. 4b, d and f). The Gō model and the Gō-fixα models of the unbound proteins of course have no attraction in the absence of native interactions, but an attractive minimum is found for the Gō-nonnative model. We term this effect “non-native steering” to distinguish it from standard fly-casting.With respect to the mechanism, it would be tempting to consider that the formation of the intermediate with the preformed helix αC indicates that the description of the process corresponds to conformational selection, at least for the Gō model. However, under the hypothesis that this structure is preformed in the unbound state, it would most likely also be present during the initial binding (prior to forming the intermediate). Here we study transition paths between the unbound and intermediate state as these contain all the information on the binding mechanism.68 We use a Bayesian procedure (see Methods)56,57 to identify the most reactive states (i.e. transition states) on the transition paths. First we show that our chosen progress variables are good reaction coordinates. For the Gō and Gō-fixα models (see Fig. 10a and c) we find that QHIF1α–CBP is a reasonably good coordinate, with maximum values of p(TP|Q) ≥ 0.4, near the theoretical maximum of 0.5 for diffusive dynamics. Although the maximum value of p(TP|Q) is relatively low (∼0.3) for QHIF1α–CBP applied to the Gō-nonnative model, we find that we obtain an improved coordinate by a simple linear combination QHIF1α–CBP + λQnonnative, with optimal λ ≈ 1.03 (Fig. 10e). This confirms the important influence of non-native interactions in this model, even in the transition state for binding. This is an interesting contrast with protein folding, where similar non-native interactions did not appreciably affect the transition state structure or quality of the native contact reaction coordinate.69
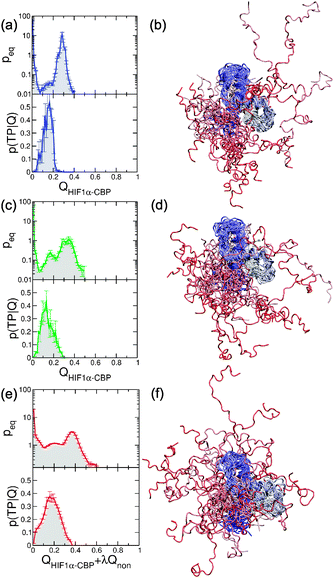 | ||
| Fig. 10 Reaction coordinates and transition state structure for HIF1α–CBP binding. Left: Bayesian analysis of transition paths. We show equilibrium probabilities peq and probabilities of being in a transition path, p(TP|Q). Right: Snapshots corresponding to transition states for binding. (a, b) the Gō (blue), (c, d) Gō-fixα, (e, f) Gō-nonnative. | ||
In all three cases we find that the maximum in p(TP|Q) appears early in the value of the order parameter, indicating that the transition states are probably very unstructured. We can obtain a picture of the transition states by looking at a number of conformations from the equilibrium trajectory that lie in a narrow region around the maximum of p(TP|Q). In all three models we find that these structures correspond to marginally bound states with great heterogeneity. For the Gō and Gō-fixα encounters seem to occur at multiple different positions in the binding groove of CBP. For the Gō non-native model encounter complexes can bind even partially outside of the native binding interface due to non-native steering effects. This may result in the observed enhancement in the rate of binding.
4 Concluding remarks
The use of coarse grained models to describe protein interactions inevitably involves simplifications which may affect the inferred binding mechanism and kinetics. Although fully atomistic simulations with an explicit solvent may provide the most accurate description of binding—and indeed are our ultimate goal—these are very computationally demanding. An alternative approach is to explore how variations in the coarse grained model used may affect the binding mechanism and rates. Here, we have considered a hierarchy of coarse-grained structure-based models with the goal of reaching a composite energy function that simultaneously (i) accounts for the funnelled nature of the binding landscape, encoded in the topology of the complex,36 and (ii) is able to account for other effects (unfolded state structure, non-native interactions, electrostatics) that have been recognized to be important for IDPs. Each of the models considered adds an additional level of accuracy, allowing us to dissect the contributions made by specific elements. We calibrate these models to obtain near iso-stability conditions at 300 K, which allows us to compare the effect of varying the features of the model, without the complication of a difference in stability (which would be expected to affect rates, e.g. according to a linear free energy relationship).A common feature of all of the models is some “fuzziness” in the bound state, i.e. structural heterogeneity in the complex.58 This is already present in the Gō model, but is extended to include a broader ensemble of non-specific configurations in the most detailed (Gō-nonnative) model considered. We find a significant effect of the chosen model on the binding mechanism, with a more accurate backbone potential destabilizing the single-helix intermediate and resulting in greater heterogeneity of binding. Further adding a realistic sequence-based model of non-native interactions results in an increased capture radius, accelerating binding via a mechanism similar to the “fly-casting” proposed in the context of native interactions,43 in agreement with results obtained with a more generic model of non-native interactions.28 The non-native interactions also lower the apparent barrier to binding, as has also been observed for protein folding in the presence of weak non-native interactions.70,71 We note, however, that this effect was not observed in some previous simulation studies of IDPs considering non-native interactions.31 We hypothesize that these effects of non-native contacts may be important for IDPs to rapidly search for and bind to their cognate binding partners.
While the coarse-grained models used here are clearly a very reduced representation of IDP binding, they have already illustrated several factors which may be important in controlling the mechanism of binding, and binding rates. These hypotheses may be further tested in the future, both by experiment and by means of more detailed simulations.
References
- P. E. Wright and H. J. Dyson, J. Mol. Biol., 1999, 293, 321–331 CrossRef CAS.
- A. K. Dunker, C. Oldfield, J. Meng, P. Romero, J. Yang, J. Chen, V. Vacic, Z. Obradovic and V. Uversky, BMC Genomics, 2008, 9, S1 CrossRef.
- B. Mèszaros, P. Tompa, I. Simon and Z. Dosztanyi, J. Mol. Biol., 2007, 372, 549–561 CrossRef.
- A. Mohan, C. J. Oldfield, P. Radivojac, V. Vacic, M. S. Cortese, A. K. Dunker and V. N. Uversky, J. Mol. Biol., 2006, 362, 1043–1059 CrossRef CAS.
- T. Mittag and J. D. Forman-Kay, Curr. Opin. Struct. Biol., 2007, 17, 3–14 CrossRef CAS.
- D. Eliezer, Curr. Opin. Struct. Biol., 2009, 19, 23–30 CrossRef CAS.
- M. R. Jensen, P. R. Markwick, S. Meier, C. Griesinger, M. Zweckstetter, S. Grzesiek, P. Bernad and M. Blackledge, Structure (London), 2009, 17, 1169–1185 CAS.
- S. Muller-Spath, A. Soranno, V. Hirschfeld, H. Hofmann, S. Ruegger, L. Reymond, D. Nettels and B. Schuler, Proc. Natl. Acad. Sci. U. S. A., 2010, 107, 14609–14614 CrossRef CAS.
- A. H. Mao, S. L. Crick, A. Vitalis, C. L. Chicoine and R. V. Pappu, Proc. Natl. Acad. Sci. U. S. A., 2010, 107, 8183–8188 CrossRef CAS.
- M. Sickmeier, J. A. Hamilton, T. LeGall, V. Vacic, M. S. Cortese, A. Tantos, B. Szabo, P. Tompa, J. Chen, V. N. Uversky, Z. Obradovic and A. K. Dunker, Nucleic Acids Res., 2006, 35, D786–D793 CrossRef.
- S. Mujtaba, Y. He, L. Zeng, S. Yan, O. Plotnikova, L. Sachchidanand, R. Sanchez, N. J. Zeleznik-Le, Z. Ronai and M.-M. Zhou, Mol. Cell, 2004, 13, 251–263 CrossRef CAS.
- K. Sugase, H. J. Dyson and P. E. Wright, Nature, 2007, 447, 1021–1025 CrossRef CAS.
- K. Sugase, J. C. Lansing, H. J. Dyson and P. E. Wright, J. Am. Chem. Soc., 2007, 129, 13406–13407 CrossRef CAS.
- S. J. Demarest, M. Martinez-Yamout, J. Chung, H. Chen, W. Xu, H. J. Dyson, R. M. Evans and P. E. Wright, Nature, 2001, 415, 549–553 CrossRef.
- E. R. Lacy, I. Filippov, W. S. Lewis, S. Otieno, L. Xiao, S. Weiss, L. Hengst and R. W. Kriwacki, Nat. Struct. Mol. Biol., 2004, 11, 358–364 CAS.
- R. Narayanan, O. K. Ganesh, A. S. Edison and S. J. Hagen, J. Am. Chem. Soc., 2008, 130, 11477–11485 CrossRef CAS.
- A. J. Baldwin and L. E. Kay, Nat. Chem. Biol., 2009, 5, 808–814 CrossRef CAS.
- P. E. Wright and H. J. Dyson, Curr. Opin. Struct. Biol., 2009, 19, 31–38 CrossRef CAS.
- L. M. Espinoza-Fonseca, Biochem. Biophys. Res. Commun., 2009, 382, 479–482 CrossRef CAS.
- P. Csermely, R. Palotai and R. Nussinov, Trends Biochem. Sci., 2010, 35, 539–546 CrossRef CAS.
- H.-F. Chen and R. Luo, J. Am. Chem. Soc., 2007, 129, 2930–2937 CrossRef CAS.
- J. Chen, J. Am. Chem. Soc., 2009, 131, 2088–2089 CrossRef CAS.
- D. Ganguly and J. Chen, J. Am. Chem. Soc., 2009, 131, 5214–5223 CrossRef CAS.
- H.-F. Chen, PLoS One, 2009, 4, e6516 Search PubMed.
- J. Higo, Y. Nishimura and H. Nakamura, J. Am. Chem. Soc., 2011, 133, 10448–10458 CrossRef CAS.
- A. N. Naganathan and M. Orozco, J. Am. Chem. Soc, 2011, 133, 12154–12161 CrossRef CAS.
- Q. Lu, H. P. Lu and J. Wang, Phys. Rev. Lett., 2007, 98, 128105 CrossRef.
- A. G. Turjanski, J. S. Gutkind, R. B. Best and G. Hummer, PLoS Comput. Biol., 2008, 4, e1000060 Search PubMed.
- Y. Huang and Z. Liu, J. Mol. Biol., 2009, 393, 1143–1159 CrossRef CAS.
- Y. Huang and Z. Liu, Proteins: Struct., Funct., Bioinf., 2010, 78, 3251–3259 CrossRef CAS.
- Y. Huang and Z. Liu, PLoS One, 2010, 5, e15375 Search PubMed.
- D. Ganguly and J. Chen, Proteins: Struct., Funct., Bioinf., 2011, 79, 1251–1266 CrossRef CAS.
- J. Wang, Y. Wang, X. Chu, S. J. Hagen, W. Han and E. Wang, PLoS Comput. Biol., 2011, 7, e1001118 CAS.
- J. N. Onuchic, N. D. Socci, Z. Luthey-Schulten and P. G. Wolynes, Folding Des., 1996, 1, 441–450 CrossRef CAS.
- J. Bryngelson, J. Onuchic, N. Socci and P. Wolynes, Proteins: Struct., Funct., Genet., 1995, 21, 167–195 CrossRef CAS.
- Y. Levy, P. G. Wolynes and J. N. Onuchic, Proc. Natl. Acad. Sci. U. S. A., 2004, 101, 511–516 CrossRef CAS.
- S. A. Dames, M. Martinez-Yamout, R. N. De Guzman, H. J. Dyson and P. E. Wright, Proc. Natl. Acad. Sci. U. S. A., 2002, 99, 5271–5276 CrossRef CAS.
- A. L. Kung, S. Wang, J. M. Klco, W. G. Kaelin and D. M. Livingston, Nat. Med. (N. Y.), 2000, 6, 1335–1340 CAS.
- G. L. Semenza, Proc. Natl. Acad. Sci. U. S. A., 2002, 99, 11570–11572 CrossRef CAS.
- G. L. Semenza, Nat. Rev. Cancer, 2003, 3, 721–732 CrossRef CAS.
- B. Xue, R. L. Dunbrack, R. W. Williams, A. K. Dunker and V. N. Uversky, Biochim. Biophys. Acta, Proteins Proteomics, 2010, 1804, 996–1010 CrossRef CAS.
- V. Munoz and L. Serrano, Nat. Struct. Mol. Biol., 1994, 1, 399–409 CAS.
- B. A. Shoemaker, J. J. Portman and P. G. Wolynes, Proc. Natl. Acad. Sci. U. S. A., 2000, 97, 8868–8873 CrossRef CAS.
- J. Karanicolas and C. L. Brooks, Protein Sci., 2002, 11, 2351–2361 CrossRef CAS.
- R. B. Best and J. Mittal, J. Phys. Chem. B, 2010, 114, 14916–14923 CrossRef CAS.
- Y. C. Kim and G. Hummer, J. Mol. Biol., 2008, 375, 1416–1433 CrossRef CAS.
- M. F. Rey-Stolle, M. Enciso and A. Rey, J. Comput. Chem., 2009, 30, 1212–1219 CrossRef CAS.
- S. Miyazawa and R. L. Jernigan, J. Mol. Biol., 1996, 256, 623–644 CrossRef CAS.
- V. N. Uversky, J. R. Gillespie and A. L. Fink, Proteins: Struct., Funct., Genet., 2000, 41, 415–427 CrossRef CAS.
- B. Hess, C. Kutzner, D. van der Spoel and E. Lindahl, J. Chem. Theor. Comput., 2008, 4, 435–447 CrossRef CAS.
- J. L. F. Abascal and C. Vega, J. Chem. Phys., 2005, 123, 234505 CrossRef CAS.
- B. Yang, Y. Zhu, Y. Wang and G. Chen, J. Comput. Chem., 2011, 32, 416–428 CrossRef CAS.
- T. E. Creighton, Proteins: structures and molecular properties, W.H. Freeman, 1993 Search PubMed.
- S. Kumar, J. M. Rosenberg, D. Bouzida, R. H. Swendsen and P. A. Kollman, J. Comput. Chem., 1992, 13, 1011–1021 CrossRef CAS.
- S. Lifson and A. Roig, J. Chem. Phys., 1961, 34, 1963–1974 CrossRef CAS.
- G. Hummer, J. Chem. Phys., 2004, 120, 516–523 CrossRef CAS.
- R. B. Best and G. Hummer, Proc. Natl. Acad. Sci. U. S. A., 2005, 102, 6732–6737 CrossRef CAS.
- P. Tompa and M. Fuxreiter, Trends Biochem. Sci., 2008, 33, 2–8 CrossRef CAS.
- D. De Sancho and R. B. Best, J. Am. Chem. Soc., 2011, 133, 6809–6816 CrossRef CAS.
- W. Kabsch and C. Sander, Biopolymers, 1983, 22, 2577–2637 CrossRef CAS.
- M. Enciso and A. Rey, J. Chem. Phys., 2010, 132, 235102 CrossRef.
- W. A. Eaton, Proc. Natl. Acad. Sci. U. S. A., 1999, 96, 5897–5899 CrossRef CAS.
- J. Sabelko, J. Ervin and M. Gruebele, Proc. Natl. Acad. Sci. U. S. A., 1999, 96, 6031–6036 CrossRef CAS.
- M. M. Garcia-Mira, M. Sadqi, N. Fischer, J. M. Sanchez-Ruiz and V. Muñoz, Science, 2002, 298, 2191–2195 CrossRef CAS.
- A. N. Naganathan, U. Doshi, A. Fung, M. Sadqi and V. Muñoz, Biochemistry, 2006, 45, 8466–8475 CrossRef CAS.
- C. D. Snow, H. Nguyen, V. S. Pande and M. Gruebele, Nature, 2002, 420, 102–106 CrossRef CAS.
- R. W. Pastor and M. Karplus, J. Chem. Phys., 1989, 91, 211–218 CrossRef CAS.
- H. S. Chung, J. M. Louis and W. A. Eaton, Proc. Natl. Acad. Sci. U. S. A., 2009, 106, 11837–11844 CrossRef CAS.
- R. B. Best and G. Hummer, Proc. Natl. Acad. Sci. U. S. A., 2010, 107, 1088–1093 CrossRef CAS.
- S. S. Plotkin, Proteins: Struct., Funct., Genet., 2001, 45, 337–345 CrossRef CAS.
- C. Clementi and S. S. Plotkin, Protein Sci., 2004, 13, 1750–1766 CrossRef CAS.
Footnotes |
| † Published as part of a Molecular BioSystems themed issue on Intrinsically Disordered Proteins: Guest Editor M. Madan Babu. |
| ‡ D.D.S. is supported by a FEBS Long Term Postdoctoral fellowship and R.B.B. by a Royal Society University Research Fellowship and the BBSRC. |
| This journal is © The Royal Society of Chemistry 2012 |
