Intrinsically disordered regions have specific functions in mitochondrial and nuclear proteins†‡
Keiichi
Homma
*a,
Satoshi
Fukuchi
b,
Ken
Nishikawa
b,
Shigetaka
Sakamoto
c and
Hideaki
Sugawara
a
aCenter for Information Biology-DNA Data Bank of Japan, National Institute of Genetics, Research Organization of Information and Systems, Mishima, Shizuoka 411-8540, Japan. E-mail: khomma@lab.nig.ac.jp
bDepartment of Bioinformatics, Maebashi Institute of Technology, 460 Kamisadori, Maebashi, Gunma 371-0816, Japan
cHolonics Corporation, Soeji 85, Numazu, Shizuoka 411-0803, Japan
First published on 24th August 2011
Abstract
Proteins in general consist not only of globular structural domains (SDs), but also of intrinsically disordered regions (IDRs), i.e. those that do not assume unique three-dimensional structures by themselves. Although IDRs are especially prevalent in eukaryotic proteins, the functions are mostly unknown. To elucidate the functions of IDRs, we first divided eukaryotic proteins into subcellular localizations, identified IDRs by the DICHOT system that accurately divides entire proteins into SDs and IDRs, and examined charge and hydropathy characteristics. On average, mitochondrial proteins have IDRs more positively charged than SDs. Comparison of mitochondrial proteins with orthologous prokaryotic proteins showed that mitochondrial proteins tend to have segments attached at both N and C termini, high fractions of which are IDRs. Segments added to the N-terminus of mitochondrial proteins contain not only signal sequences but also mature proteins and exhibit a positive charge gradient, with the magnitude increasing toward the N-terminus. This finding is consistent with the notion that positively charged residues are added to the N-terminus of proteobacterial proteins so that the extended proteins can be chromosomally encoded and efficiently transported to mitochondria after translation. By contrast, nuclear proteins generally have positively charged SDs and negatively charged IDRs. Among nuclear proteins, DNA-binding proteins have enhanced charge tendencies. We propose that SDs in nuclear proteins tend to be positively charged because of the need to bind to negatively charged nucleotides, while IDRs tend to be negatively charged to interact with other proteins or other regions of the same proteins to avoid premature proteasomal degradation.
Introduction
Proteins are not only composed of SDs, but also of IDRs, i.e. regions that do not assume a unique three-dimensional structure by themselves under physiological conditions.1 The convincing presentation that a number of IDRs are involved in interactions with other proteins brought a paradigm change: we must consider not only SDs, but also IDRs for full elucidation of protein functions.1,2 In fact eukaryotic proteins generally contain a high fraction of IDRs.3,4 Functional IDRs generally assume unique secondary or tertiary structures upon binding to targets.5 IDRs have been suggested to be important for transient interactions with other proteins because disorder-to-order transition upon binding decreases conformational entropy and therefore results in low affinity interactions.6,7 If prolonged protein–protein interactions are undesirable, as in the case of transcription factors involved in cell-cycle control, IDRs at the interface are more suitable than SDs.Although IDRs occur less frequently in the extracellular domains, some extracellular domains probably have IDRs.8,9O-GalNAc glycosylation, whose initiation usually occurs in the Golgi apparatus, but takes place in the ER instead by the action of Src kinase,10 is found in extracellular proteins. Some IDRs in extracellular proteins are modified by O-GalNAc glycosylation to confer protection from proteolysis.11–13 Stimulated by the example of IDRs in extracellular proteins and the finding that eukaryotic proteins of different subcellular localizations contain vastly different fractions of IDRs,14 we investigated the functions of IDRs in proteins in specific subcellular localizations. For this purpose, it was useful to use the DICHOT system that divides the entire proteins into SDs and IDRs at a residue-wise error rate of less than 3%.15
Nuclear proteins and especially transcription factors generally contain a high fraction of IDRs.3,14–16 As transcription factors of eukaryotes generally have much higher IDRs than those of prokaryotes, most IDRs in eukaryotic transcription factors probably play regulatory roles that are specific to eukaryotes.16 By contrast, the fraction of IDRs in mitochondrial proteins is lower than the overall eukaryotic average, although it is significantly higher than that of prokaryotic proteins.4 As mitochondria are widely assumed to have originated from α-proteobacteria that were taken inside, many nuclear-encoded mitochondrial proteins naturally have orthologs in α-proteobacteria and were found to be translated in mitochondrion-bound polysomes.17 Nuclear-encoded mitochondrial proteins have signal (transit) peptides and other sequences attached mostly in the N-terminus that facilitate their targeting to mitochondria and translocation across the mitochondrial membranes.18 The signal sequence is generally positively charged and amphiphilic as it is recognized by a hydrophobic cleft in the cytoplasmic domain of an outer membrane mitochondrial protein Tom2019 and by a negatively charged cytoplasmic domain of another protein, Tom22, localized in the outer mitochondrial membrane.20 Mitochondrial proteins are then unfolded by the electrical potential across the mitochondrial inner membrane (negative inside) acting on positive charges in the signal sequence21,22 and transported across the mitochondrial membranes.23
While trying to identify the functions of IDRs, we were inspired by the pathbreaking work on the charge and hydropathy distributions of natively unfolded proteins, i.e. proteins consisting entirely of IDRs.24 Instead of calculating the absolute charges per residue of proteins that are wholly composed of IDRs as in the original Uversky plot, we chose to calculate the average charges per residue of the IDRs and the SDs in proteins that have both. We made a charge–hydrophobicity plot of each subcellular localization in each eukaryote. We did not take the absolute value and instead used charge because we thought it likely that proteins of some subcellular localizations have characteristic positive or negative charges in IDRs or SDs. Indeed, we found mitochondrial and nuclear proteins to have singular charge–hydrophobicity distributions and investigated functional reasons.
Results
Charge–hydrophobicity plots
We were interested in whether globular SDs and IDRs in proteins of different subcellular localizations have characteristic charge–hydrophobicity patterns. To this end, we first selected proteins in seven model eukaryotes, classified them into subcellular localizations (Tables S1 and S2, ESI‡), and then divided the entire lengths into SDs and IDRs by the DICHOT system.4,15 We then calculated the average charge and hydrophobicity values of the SDs and the IDRs of each protein. As most proteins have both SDs and IDRs, we decided to neglect a small number of proteins that entirely consist of SDs or IDRs and plotted the pairs of red (SDs) and black (IDRs) dots that correspond to proteins in each species and subcellular localization. The plot of mitochondrial proteins in Saccharomyces cerevisiae is presented as an example (Fig. 1A). We represented the averages of SDs and IDRs as a magenta square and a grey circle, respectively, while we used bars above and below the averages to indicate the standard errors of the mean (SEMs). We heretofore refer to the averages as protein-wise averages to emphasize the fact that they are averages of IDRs and SDs of proteins. Magnified symbols of protein-wise averages with SEMs are also shown.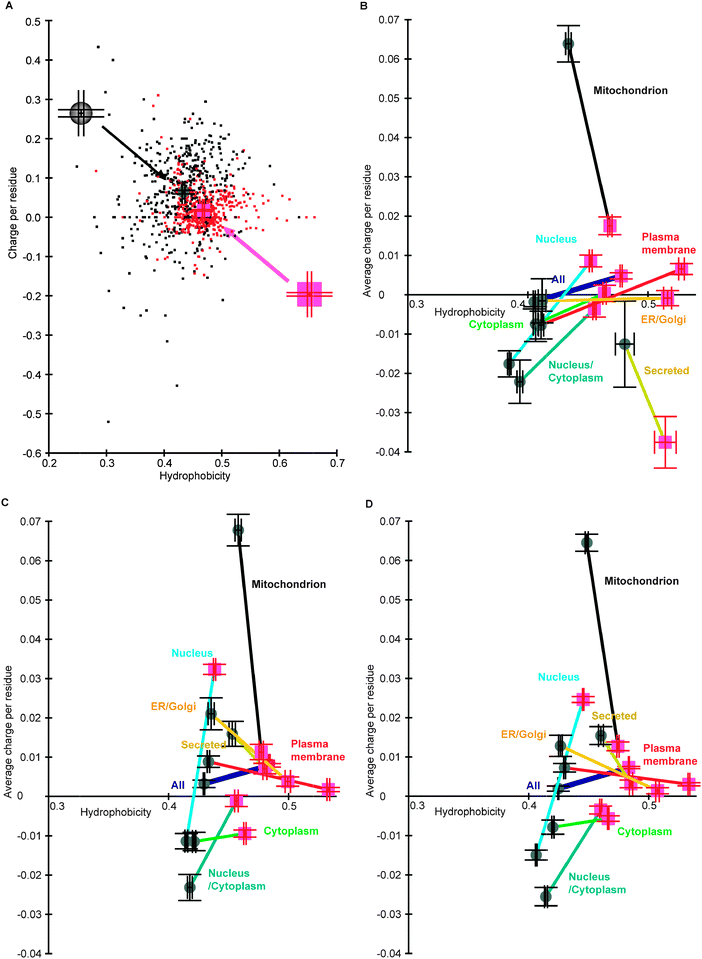 | ||
| Fig. 1 Protein-wise charge–hydrophobicity plots of entire proteins. (A) The protein-wise charge–hydrophobicity plot of mitochondrial proteins in S. cerevisiae. (B) The average protein-wise charge–hydrophobicity plot of proteins in S. cerevisiae. (C) The average protein-wise charge–hydrophobicity plot of proteins in H. sapiens. (D) The average protein-wise charge–hydrophobicity plot of proteins in seven eukaryotes. | ||
We then plotted the protein-wise averages of SDs and IDRs in all subcellular localizations of proteins in S. cerevisiae (Fig. 1B): the averages with SEMs in SDs and IDRs are presented as those in Fig. 1A, with colored lines connecting the two averages. Note that the averages with SEMs in Fig. 1A are shown as mitochondrial proteins in this panel using different scales. Not surprisingly IDRs were on average more hydrophilic than SDs in all the subcellular localizations examined. Interestingly the IDRs in mitochondrial proteins tend to be more positively charged than the SDs, and on average the IDRs in nuclear proteins are negatively charged, while the SDs are positively charged. We made a similar plot for proteins in Homo sapiens (Fig. 1C) and found similarities with that of S. cerevisiae: the above-mentioned tendencies of mitochondrial and nuclear proteins are shared by the two evolutionarily distant species. A protein-wise average charge–hydrophobicity plot of all the eukaryotes examined (Fig. 1D) shows that the above observations generally hold true. On the other hand, secreted proteins tend to be negatively charged in S. cerevisiae, but not so in general.
How are charge–hydrophobicity plots modified if we restrict our analyses to mature proteins, i.e. if we exclude signal and pro sequences? The results corresponding to those of the entire proteins are presented as Fig. S1 (ESI‡). The characteristic of mitochondrial proteins detected in the entire proteins is still present in mature proteins, although the general positive charges of the IDRs in mitochondrial proteins are reduced. As signal and pro sequences are absent in nuclear proteins, the plots of nuclear proteins remain unchanged. The following analyses of nuclear proteins are unaffected by the choice of entire or mature proteins.
Mitochondrial proteins
To investigate why mitochondrial proteins have IDRs that are on average more positively charged than SDs, we examined specific proteins. As mitochondria are generally agreed to have originated from α-proteobacteria, many mitochondrial proteins have orthologs in α-proteobacteria. Fig. 2B and C represent orthologous proteins constituting a component of the ribosomal small subunit in S. cerevisiae and H. sapiens, respectively, while the ortholog in an α-proteobacterium is presented in Fig. 2A. The SDs are mostly aligned, while the IDRs generally have high sequence variations and cannot be aligned. Apparently a mitochondrial signal sequence and a region that consists of an IDR and an SD have been added to the N-terminus of the bacterial prototype to produce the mitochondrial proteins. Notably, the charge distributions indicate that the N-terminal additions have overall positive charges. Another example is provided by a human homolog of a coenzyme Q-binding protein residing in the inner membrane (Fig. 3B) and its α-proteobacterial ortholog (Fig. 3A). A comparison again reveals an overall positive charge in the extra N-terminal section in the human protein. In this case, the appended N-terminal segment of the mitochondrial protein consists of a signal sequence and an SD (magenta), while the C-terminal additional segment is an IDR.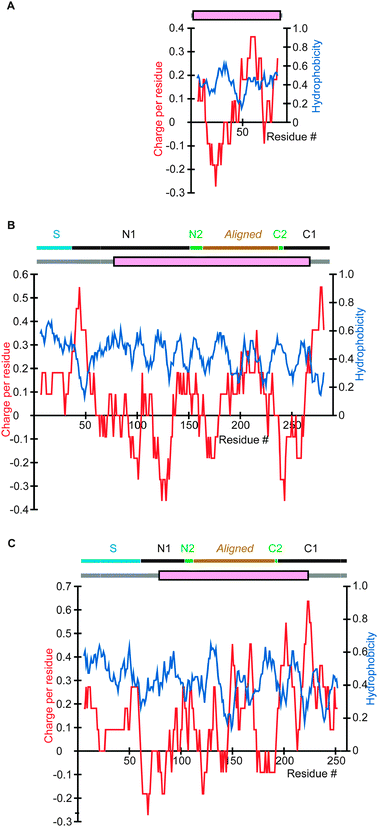 | ||
| Fig. 2 Charge and hydrophobicity distributions and results of DICHOT analysis of mitochondrial proteins and their eubacterial ortholog. The results of DICHOT analysis are schematically presented at the top of each panel in which grey lines represent IDRs and magenta rectangles signify SDs and in eukaryotic proteins, classifications of mature proteins are also shown as horizontal bars. The charge (red) and hydrophobicity (blue) distributions were determined by calculating the 11-residue running averages centred at each residue. The horizontal positions were adjusted so that the aligned regions line up vertically. (A) 30S ribosomal protein S15 in B. suis (UniProt accession number: Q8FXT0). (B) 37S ribosomal protein S28 in S. cerevisiae (P21771). (C) 28S ribosomal protein S15 in H. sapiens (P82914). See Fig. 4 for explanation of the topmost lines in (B) and (C). | ||
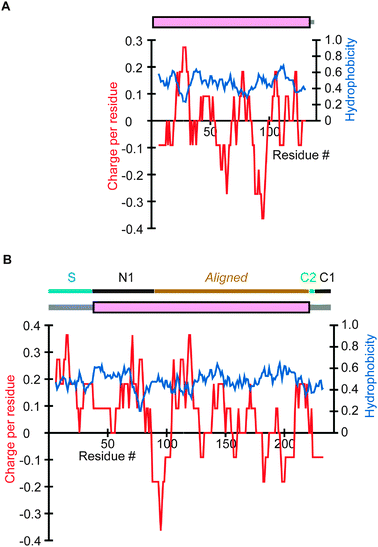 | ||
| Fig. 3 Charge and hydrophobicity distributions and results of DICHOT analysis of another mitochondrial protein and its eubacterial ortholog. Results of analyses are presented as in Fig. 2. (A) BR1123 protein in B. suis (UniProt accession number: Q8G0H1). (B) Coenzyme Q-binding protein COQ10 homolog B in H. sapiens (Q9H8M1). The explanation of the top line is provided in Fig. 4. | ||
Possibly mitochondrial proteins have a tendency to have positively charged N-terminal addition that is intrinsically disordered. As this hypothesis accounts for the IDRs in mitochondrial proteins that are more positively charged than the SDs, we examined all mitochondrial proteins and tested this hypothesis. In the following analyses of mitochondrial proteins, we excluded outer membrane proteins because they are imported to mitochondria in a mechanism different from that used by other mitochondrial proteins, namely those in the intermembrane space, the inner membrane, and the matrix.25
We first selected mitochondrial proteins in the seven eukaryotes that have α-proteobacterial orthologs and made sequence alignments (Fig. 4A). Most IDRs fall outside of the aligned segments, as their sequences are in general poorly conserved.15 Although we only used one α-proteobacterium, Brucella suis, inclusion of two additional α-proteobacteria, Rickettsia prowazekii str. Madrid E, and Rickettsia typhi str. Wilmington, did not essentially affect the results (data not shown). The N-terminal unaligned segment in mitochondrial proteins was divided into S, N1, and N2: S is the mitochondrial signal sequence, N2 is the unaligned segment with the length equal to the unaligned N-terminal segment in the bacterial ortholog, while N1 is the rest of the unaligned segment. We considered S and N1 as the probable N-terminal addition to the prototype. The C-terminal unaligned segment in mitochondrial proteins was classified into C2 and C1: C2 is the unaligned segment with the length equal to the unaligned C-terminal segment in the bacterial ortholog, while C1 is the remainder of the C-terminal segment. We regarded C1 as the likely C-terminal appendage. The average number of residues of S, N1, N2, C2, and C1 are 35.6, 14.7, 13.4, 8.5, and 15.5, respectively, while that of the aligned segment is 329.4.
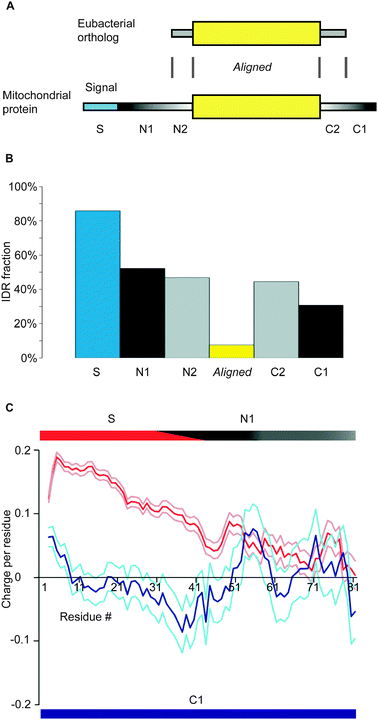 | ||
| Fig. 4 General charge distributions of added sections of mitochondrial proteins. (A) The classifications of a mitochondrial protein based on its alignment to its α-proteobacterial ortholog. (B) The fraction of IDRs in each section of mitochondrial proteins judged by DICHOT. (C) The average charge distribution in S and N1 (red) together with average ± SEM (magenta) and that in C1 (blue) with average ± SEM (light blue). The rectangles at the top show approximate divisions into sections S and N1, with the slanted boundary roughly representing the average length of S, while that at the bottom signifies that only C1 section is used for C-terminal analysis. | ||
For each segment, the fraction of IDRs was determined by DICHOT (Fig. 4B). S, N1, and N2 segments have high IDR fractions, as do C2 and C1, while the aligned segment has a very low IDR fraction. In the presented figures (Fig. 2B, C and 3B) can be observed instances in which SDs exist in the added sections (N1, N2, C2, and C1), which push down the fractions of IDRs. We determined and presented the charge distribution of the most probable N-terminal addition, S and N1, as a red line (Fig. 4C), with the corresponding SEM ranges in magenta. Note that the top and bottom bars were added solely for explanation and the average lengths of N1 and C1 are shorter than those represented by the horizontal lengths. There is a clear decreasing gradient of positive charges in the N-terminal addition. The distribution remains essentially unchanged even if we include N2 in addition to S and N1 (data not shown).
Although S is on average approximately 36 residues long, there are longer signal sequences. Is it possible that in actuality only S has positive charge, while N1 does not? This is a possibility because the signal sequences of some mitochondrial proteins remain un-annotated, leading to misidentification of some signal sequences as N1. However, this is not the case because the N-terminal positive charge is detectable even if we exclude S and limit our analysis to the N1 segment with clearly defined S: the average charge is 0.0288 with an SEM of 0.0028. Thus the positive charge gradient in the added N-terminal sections is attributable not only to S, but also to the N1 segment.
We also plotted the charge distribution of the C1 segment against residues from the C-terminus (blue line, Fig. 4C), together with the corresponding SEM ranges (light blue). Besides a slight positive charge very close to the C-terminus, there is no clear trend in charge distribution. As the average charge of the C1 segment is 0.0004 with an SEM of 0.0006, overall the C1 segment does not have a significant charge. The C-terminal distribution is not significantly altered even if we include the C2 segment besides C1 for analysis (data not shown).
Nuclear proteins
As stated above, nuclear proteins have a characteristic charge–hydrophobicity pattern: on average SDs are positively charged, while IDRs are negatively charged (Fig. 1). To identify the causes of this phenomenon, we examined a number of concrete nuclear proteins. We presented four typical examples (Fig. 5): human max dimerization protein (MAD), general control protein, GCN4, in S. cerevisiae, human serum response factor (SRF), and its ortholog, Mcm1p, in S. cerevisiae. Comparison of the orthologs (Fig. 5C and D) reveals similarities in the charge and hydrophobicity distributions of the corresponding sections of the IDRs. This implied the existence of some functions in the IDRs shared by the orthologs despite a high variation in the IDRs sequences to preclude BLAST alignment. Moreover we recognized that many DNA-binding nuclear proteins have positively charged SDs containing DNA-binding regions (Fig. 5A–C). Conspicuous positive charge peaks in the N-terminal IDR of MAD and SRF (Fig. 5A and C) are attributable to the nuclear localization signals (NLSs) in which basic charge clusters are frequently found. Hypothesizing that charge properties of DNA-binding nuclear proteins account for those of nuclear proteins, we divided nuclear proteins into those with DNA-binding regions and those without and determined the average charges. We note that Mcm1p of S. cerevisiae (Fig. 5D) was not selected as a DNA-binding protein due to the absence of relevant annotation in the sequence annotation section (see Methods), although the SD contains a clearly defined MADS box which is known to have DNA-binding properties.26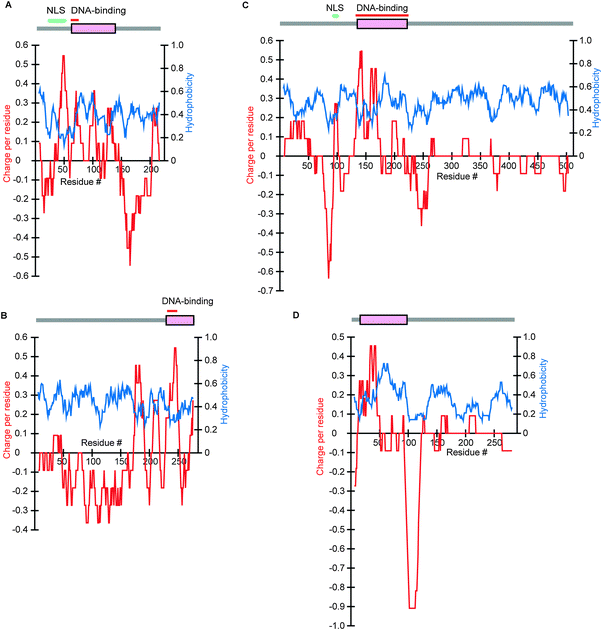 | ||
| Fig. 5 Charge and hydrophobicity distributions and results of DICHOT analysis of four nuclear proteins. IDRs (grey lines) and SDs (magenta rectangles) predicted by the DICHOT system are shown at the top of each panel with nuclear localization signals and DNA-binding domains indicated by bars above, if they are present. Analytical results are presented as in Fig. 2. (A) Max dimerization protein, MAD, in H. sapiens (UniProt accession number: Q05195). (B) General control protein, GCN4, in S. cerevisiae (P03069). (C) Serum response factor, SRF, in H. sapiens (P11831). (D) Pheromone receptor transcription factor, MCM1, in S. cerevisiae (P11746), horizontally adjusted to show correspondence to SRF, its human ortholog. | ||
The analytical results of all species examined (Fig. 6, Table S2, ESI‡) show that the nuclear proteins with DNA-binding domains have more negatively charged IDRs and more positively charged SDs than the nuclear proteins without DNA-binding domains. As some DNA-binding nuclear proteins have not been clearly annotated to contain DNA-binding domains as previously mentioned, the positive charge in the SDs of DNA-binding proteins accounts for most of the average positive charges in the SDs of nuclear proteins. This makes sense as positive charges are needed for optimal interactions with negatively charged nucleotides. The observation that cytoplasmic proteins do not on average have positively charged SDs (Fig. 1) is in accord with this finding, as they do not interact with DNA.
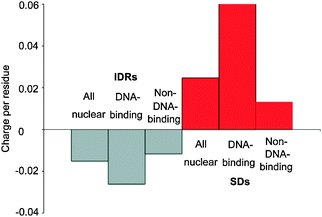 | ||
| Fig. 6 The average charges per residue in IDRs and SDs of nuclear proteins, DNA-binding nuclear proteins, and non-DNA-binding nuclear proteins in all eukaryotes examined. | ||
Discussion
We calculated pair-wise averages because we wanted to investigate how SDs and IDRs tend to differ in each protein. The protein-wise averages of SDs and IDRs (Tables S1 and S2, ESI‡), however, do not significantly differ from the corresponding averages of all proteins including those consisting almost entirely of SDs or IDRs (data not shown). This is not only because entirely structured or disordered proteins are rare, but also because their charge and hydrophobicity properties do not appreciably differ from proteins that consist of both IDRs and SDs.As stated in the Introduction section, we analyzed average instead of absolute charges per residue. To see how charge–hydrophobicity plots are affected by this choice, we carried out the same analyses on mature proteins using the absolute charges and drew graphs corresponding to Fig. S1 (Fig. S2, ESI‡). The distinctive characteristics of mitochondrial and nuclear proteins detected with the use of average charges are not apparent if the absolute charges are used instead. To quantify the resolution of average charge–hydrophobicity plots in subcellular localizations, we measured the normalized average distances between different localizations in each species (Fig. S3, ESI‡). The higher the average distance, the better is the resolution. The average distance (‘resolution’) is calculated for the average charge–hydrophobicity plot of each species and is averaged over the seven species. The average resolution using charges per residue was 0.336, while the value using absolute charges per residue was 0.325. If only the positively charged or the negatively charged amino acid residues are used, the corresponding average resolutions are 0.329 and 0.322. Thus the use of average charges not only leads to characterization of mitochondrial and nuclear proteins, but also increases the resolution of proteins in different subcellular localizations.
The results of mitochondrial proteins enable us to dissect the causes of the higher fraction of IDRs in mitochondrial proteins than that in α-proteobacterial proteins (16.7% vs. 9.9%). The finding that segments added at both termini have high fractions of IDRs (Fig. 4B) partly explains why mitochondrial proteins have a higher fraction of IDRs than α-proteobacterial proteins. In fully explaining the disparity, however, we must be aware that many nuclear-encoded mitochondrial proteins are presumed to be of eukaryotic origin due to the absence of prokaryotic orthologs.27 This dual origin of mitochondrial proteins at least partially explains the small increase in the fraction of IDRs in mitochondrial proteins over that in α-proteobacterial proteins, as eukaryotic proteins generally contain higher fractions of IDRs.3,4
In agreement with the idea that the N-terminal positive charge facilitates transport to mitochondria, proteins of other subcellular fractions do not have such conspicuous average positive charges in the N-terminal 80 residues, irrespective of whether signal and pro regions are included (Table S1, ESI‡) or only mature proteins are considered (Table S2, ESI‡). Although the general existence of positive charges in the signal peptide is known as described in the Introduction section, the decreasing gradient of positive charge in the N-terminal addition is a novel finding. We further divided the probable extended segments at the N-terminal, i.e. S and N1, into IDRs and SDs and found that the average charge and SEM in the first 80 residues in IDRs are 0.1127 and 0.0027, respectively, while the corresponding figures in SDs are 0.0426 and 0.060. Though the scarcity of SDs in these segments (Fig. 4B) makes accurate determination of the charge distributions impossible, we can state that both IDRs and SDs have positive charges albeit the magnitude appears smaller in SDs. This result is in line with the notion that IDRs have been preferentially added to the N-terminus of mitochondrial proteins so that a positive charge gradient is formed.
As nuclear-encoded mitochondrial proteins are unfolded as they get transported across mitochondrial membranes, the positive charge in SDs is also exposed. Considering that the positive charge in the unfolded N-terminal segment facilitates protein import into the negatively charged mitochondrial matrix,21,22 we regard the positive charge gradient at the N-terminus as a feature that evolved to efficiently transport mitochondrial proteins from the cytoplasm.
It was suggested that positive charge clusters found in the N-terminal IDRs of some DNA-binding proteins are important for efficient DNA search.28 Although some DNA-binding proteins indeed have positively charged N-terminal IDRs, the IDRs of DNA-binding proteins are on average negatively charged. What are possible functions of the general negative charges in IDRs in nuclear proteins, if any? It is possible that IDRs are negatively charged to neutralize the positive charges of SDs. If this hypothesis is true, the total charge of IDRs must be negatively correlated with that of SDs. As we found the negative correlation between the two quantities is weak (correlation coefficient = −0.055 with attached standard error = 0.014) in nuclear proteins of all species and is nonexistent in nuclear proteins of S. cerevisiae (correlation coefficient = 0.041 with attached standard error = 0.034), we reject this notion.
For the formulation of an alternative idea, experimental evidence on Mcm1p provides a clue. MCM1 is an essential gene encoding a pheromone receptor transcription factor in S. cerevisiae, but the region encoding the SD (residues 18–96) is sufficient for viability.29 Residues 99–117 are nevertheless required for optimal interactions with alpha1, a coregulatory protein30 and they intriguingly correspond to the most negatively charged section in the C-terminal IDR (Fig. 5D). Surprisingly, Mcm1p mutant proteins lacking the acidic IDR were found to be less abundant than the wild type, indicating the importance of this region for protein stability.29 Moreover, the N-terminal arm (residues 2–17) is nonessential, but is required for transcription of a subset of genes in maintenance of the cell wall31 and a deletion mutant of the N-terminal arm shows a salt-sensitive phenotype.30 The N-terminal arm is mostly comprised of the N-terminal IDR, which has a high concentration of negative charges (Fig. 5D). The negatively charged N-terminal IDR is thus also needed for optimal functions, most likely through interactions with other proteins. Furthermore, Gcn4p contains two transcription activation domains in the negatively charged IDR (Fig. 5B) and a mutant with most (residues 18–218) of the negatively charged IDRs deleted is expressed at a much reduced level.32 We consider the apparent destabilization of Gcn4p significant all the more because the residue (Thr 165) whose phosphorylation leads to degradation33 is absent in the deletion mutant.
If negatively charged IDRs are in general conducive to binding to other proteins or other regions of the same proteins such as positively charged DNA-binding domains, why is binding of IDRs itself important? For this problem it is relevant to note that IDRs are degraded ubiquitin-independently by proteasomes that exist in nuclei and the cytoplasm,34 just as poly-ubiquitinated proteins require IDRs for efficient proteasomes-mediated degradation.35 Among a number of proteins with IDRs that are known to be degraded without ubiquitination, ornithine carboxylase (ODC) has been particularly well-studied: the N-terminal IDR of approximately 45 residues is sufficient to serve as a degradation signal for ODC in S. cerevisiae if it is exposed upon binding of ODC monomers to ODC antizyme.36 Mouse ODC instead has a long IDR in the C-terminus and is also degraded ubiquitin-independently with the mediation of its antizyme.36 The same authors also found that the 37-residue C-terminal IDR attached to other proteins serves as a ubiquitin-independent degradation signal.
As proteins with long, exposed IDR(s) are probably degraded without ubiquitination, the IDRs must be bound to something else if the proteins are not to be prematurely degraded. The above-mentioned experimental observations on the effects of IDRs on the stability of yeast Mcm1p and Gcn4p suggest that binding to other proteins prevents degradation in these proteins. That IDRs tend to interact transiently as mentioned in the Introduction section may be advantageous for timely control of the protein concentration. The verification and general applicability of this notion await further study.
The degradation of exposed IDRs by proteasomes is reminiscent of unmodified IDRs in extracellular proteins that are proteolytically cleaved as described in Introduction. Interestingly, many proteins including FGF23 are known to undergo ectodomain shedding, that is, they are synthesized as membrane-anchored proteins and subsequently the extracellular domains are proteolytically cleaved, typically by metalloproteinases, to produce soluble forms.37 As O-GalNAc glycosylation sites are preferentially located in IDRs9 and O-GalNAc glycosylation analysis is generally difficult to carry out,38 IDRs that are not proteolytically cleaved may be generally protected by O-GalNAc glycosylation. As suggested for FGF23,39 we consider it plausible that O-GalNAc modification competes with protease processing and thereby regulates ectopic shedding in general. As an indication of the importance of this modification in biological functions, O-GalNAc glycosylation is involved in a number of diseases as well as the immune system.40
We consider it likely that IDRs whose locations and charge distributions are evolutionarily conserved have functions. We suggest that many IDRs have functions specific to cellular localizations. The higher prevalence of IDRs in eukaryotic proteins than in prokaryotic proteins3,4 is in accordance with this idea. Experimental verifications of the proposed localization-specific functions of IDRs will further our understanding of proteins.
Conclusions
Mitochondrial proteins of prokaryotic origin tend to have N-terminal domains added to the prokaryotic counterpart. The N-terminal segment of approximately 80 residues has a decreasing positive gradient and consists mostly of IDRs. This additional segment probably evolved to facilitate transport of mitochondrial proteins. By contrast, nuclear proteins have positively charged SDs in general and a high fraction of IDRs that are on the average negatively charged. DNA-binding domains account for most of the positive charges in nuclear proteins. Some negatively charged IDRs are important in interactions with other proteins or domains. We propose that IDRs in many nuclear proteins are bound to other proteins or other regions of the same proteins when the proteins are not to be degraded, while they become exposed upon dissociation and serve as the initiator of proteasome-mediated degradation when the proteins are to be removed.Experimental
Materials
Methods
Acknowledgements
We thank M. Ota and P. Tompa for helpful advice, K. Dunker for encouragement, and R. Kodama for insightful comments. This study was supported by the Targeted Proteins Research Program of the Ministry of Education, Culture, Sports, Science and Technology (MEXT), Japan.References
- P. E. Wright and H. J. Dyson, J. Mol. Biol., 1999, 293, 321–331 CrossRef CAS.
- K. Nishikawa, Biophysics, 2009, 5, 53–58 Search PubMed.
- J. J. Ward, J. S. Sodhi, L. J. McGuffin, B. F. Buxton and D. T. Jones, J. Mol. Biol., 2004, 337, 635–645 CrossRef CAS.
- S. Fukuchi, K. Hosoda, K. Homma, T. Gojobori and K. Nishikawa, BMC Struct. Biol., 2011, 11, 29 Search PubMed.
- V. Receveur-Bréchot, J. M. Bourhis, V. N. Uversky, B. Canard and S. Longhi, Proteins: Struct., Funct., Genet., 2006, 62, 24–45 Search PubMed.
- G. P. Singh, M. Ganapathi and D. Dash, Proteins: Struct., Funct., Genet., 2007, 66, 761–765 Search PubMed.
- J. R. Perkins, I. Diboun, B. H. Dessailly, J. G. Lees and C. Orengo, Structure (London), 2010, 18, 1233–1243 Search PubMed.
- Y. Minezaki, K. Homma and K. Nishikawa, J. Mol. Biol., 2007, 368(3), 902–913 CrossRef CAS.
- I. Nishikawa, Y. Nakajima, M. Ito, S. Fukuchi, K. Homma and K. Nishikawa, Int. J. Mol. Sci., 2010, 11, 4991–5008 Search PubMed.
- D. J. Gill, J. Chia, J. Senewiratne and F. Bard, J. Cell Biol., 2010, 189(5), 843–858 Search PubMed.
- N. Jentoft, Trends Biochem. Sci., 1990, 15, 291–294 CrossRef CAS.
- K. Kozarsky, D. Kingsley and M. Krieger, Proc. Natl. Acad. Sci. U. S. A., 1988, 85, 4335–4339 Search PubMed.
- E. A. Rutledge, B. J. Root, J. J. Lucas and C. A. Enns, Blood, 1994, 83, 580–586 Search PubMed.
- J. Liu, N. B. Perumal, C. J. Oldfield, E. W. Su, V. N. Uversky and A. K. Dunker, Biochemistry, 2006, 45, 6873–6888 CrossRef CAS.
- S. Fukuchi, K. Homma, Y. Minezaki, T. Gojobori and K. Nishikawa, BMC Struct. Biol., 2009, 9, 26 CrossRef.
- Y. Minezaki, K. Homma, A. R. Kinjo and K. Nishikawa, J. Mol. Biol., 2006, 359, 1137–1149 CrossRef CAS.
- P. Marc, A. Margeot, F. Devaux, C. Blugeon, M. Corral-Debrinski and C. Jacq, EMBO Rep., 2002, 3, 159–164 Search PubMed.
- E. Schleiff and T. Becker, Nat. Rev. Mol. Cell Biol., 2011, 12, 48–59 Search PubMed.
- Y. Abe, T. Shodai, T. Muto, K. Mihara, H. Torii, S. Nishikawa, T. Endo and D. Kohda, Cell (Cambridge, Mass.), 2000, 100, 551–560 Search PubMed.
- L. Bolliger, T. Junne, G. Schatz and T. Lithgow, EMBO J., 1995, 14, 6318–6326 Search PubMed.
- S. Huang, K. S. Ratliff and A. Matouschek, Nat. Struct. Biol., 2002, 9, 301–307 CrossRef CAS.
- J. Martin, K. Mahlke and N. Pfanner, J. Biol. Chem., 1991, 266, 18051–18057 Search PubMed.
- S. Prakash and A. Matouschek, Trends Biochem. Sci., 2004, 29, 593–600 CrossRef CAS.
- V. N. Uversky, J. R. Gillespie and A. L. Fink, Proteins: Struct., Funct., Genet., 2000, 41, 415–427 CrossRef CAS.
- D. Mokranjac and W. Neupert, Biochim. Biophys. Acta, 2008, 1777, 758–762 Search PubMed.
- A. G. West, P. Shore and A. D. Sharrocks, Mol. Cell. Biol., 1997, 17, 2876–2887 Search PubMed.
- S. G. Andersson, O. Karlberg, B. Canbäck and C. G. Kurland, Philos. Trans. R. Soc. London, Ser. B, 2003, 358, 165–177 CrossRef CAS.
- D. Vuzman and Y. Levy, Proc. Natl. Acad. Sci. U. S. A., 2010, 107, 21004–21009 CrossRef CAS.
- C. Christ and B. K. Tye, Genes Dev., 1991, 5, 751–763 Search PubMed.
- M. H. Kuo, E. T. Nadeau and E. J. Grayhack, Mol. Cell. Biol., 1997, 17, 819–832 Search PubMed.
- D. S. Abraham and A. K. Vershon, Eukaryotic Cell, 2005, 4, 1808–1819 Search PubMed.
- C. M. Drysdale, E. Dueñas, B. M. Jackson, U. Reusser, G. H. Braus and A. G. Hinnebusch, Mol. Cell. Biol., 1995, 15, 1220–1233 Search PubMed.
- A. Meimoun, T. Holtzman, Z. Weissman, H. J. McBride, D. J. Stillman, G. R. Fink and D. Kornitzer, Mol. Biol. Cell, 2000, 11, 915–927 Search PubMed.
- I. Jariel-Encontre, G. Bossis and M. Piechaczyk, Biochim. Biophys. Acta, 2008, 1786, 153–177 Search PubMed.
- S. Prakash, L. Tian, K. S. Ratliff, R. E. Lehotzky and A. Matouschek, Nat. Struct. Mol. Biol., 2004, 11, 830–837 CrossRef CAS.
- D. Gödderz, E. Schäfer, R. Palanimurugan and R. J. Dohmen, J. Mol. Biol., 2011, 407, 354–367 Search PubMed.
- R. A. Black, C. T. Rauch, C. J. Kozlosky, J. J. Peschon, J. L. Slack, M. F. Wolfson, B. J. Castner, K. L. Stocking, P. Reddy, S. Srinivasan, N. Nelson, N. Boiani, K. A. Schooley, M. Gerhart, R. Davis, J. N. Fitzner, R. S. Johnson, R. J. Paxton, C. J. March and D. P. Cerretti, Nature, 1997, 385, 729–733 CrossRef CAS.
- P. H. Jensen, D. Kolarich and N. H. Packer, FEBS J., 2009, 277, 81–94 Search PubMed.
- K. Kato, C. Jeanneau, M. A. Tarp, A. Benet-Pagès, B. Lorenz-Depiereux, E. P. Bennett, U. Mandel, T. M. Strom and H. Clausen, J. Biol. Chem., 2006, 281, 18370–18377 Search PubMed.
- E. Tian, K. Ten and G. Hagen, Glycoconjugate J., 2009, 26, 325–334 CrossRef CAS.
- S. Fukuchi, K. Homma, S. Sakamoto, H. Sugawara, Y. Tateno, T. Gojobori and K. Nishikawa, Nucleic Acids Res., 2009, 37, D333–D337 Search PubMed.
- UniProt Consortium, Nucleic Acids Res., 2011, 39, D214–D219 Search PubMed.
- J. Kyte and R. Doolittle, J. Mol. Biol., 1982, 157, 105–132 CAS.
- L. Li, C. J. Stoeckert Jr and D. S. Roos, Genome Res., 2003, 13, 2178–2189 Search PubMed.
- S. F. Altschul, W. Gish, W. Miller, E. W. Myers and D. J. Lipman, J. Mol. Biol., 1990, 215, 403–410 CrossRef CAS.
Footnotes |
| † Published as part of a Molecular BioSystems themed issue on Intrinsically Disordered Proteins: Guest Editor M. Madan Babu. |
| ‡ Electronic supplementary information (ESI) available. See DOI: 10.1039/c1mb05208j |
| This journal is © The Royal Society of Chemistry 2012 |
