Passive circulating cell sorting by deformability using a microfluidic gradual filter†
P.
Preira
a,
V.
Grandné
a,
J.-M.
Forel
b,
S.
Gabriele‡
a,
M.
Camara
a and
O.
Theodoly
*a
aAdhésion & Inflammation, INSERM U1067-CNRS UMR7333, and Université Aix-Marseille, Assistance Publique-Hôpitaux de Marseille, Case 937, 163 Avenue de Luminy, F-13009 Marseille, France
bUnité de Recherche sur les Maladies Infectieuses et Tropicales Emergentes (URMITE) UMR6236, CNRS/Université Aix-Marseille 2, Hôpital Nord, Chemin des Bourrely, 13015 Marseille Cedex 20, France
First published on 17th October 2012
Abstract
The deformability of circulating leukocytes plays an important role in the physiopathology of several diseases like sepsis or acute respiratory distress syndrome (ARDS). We present here a microfluidic method for the passive testing, sorting and separating of non-adherent cell populations by deformability. It consists of microfluidic sieves in series with pore sizes decreasing from the upstream to the downstream. The method capabilities are demonstrated with monocytic cell lines (THP-1) treated by Jasplakinolide (a stabilizer of polymerized actin), LatrunculinA (an inhibitor of actin polymerization), and with the plasma of patients suffering from ARDS. Simple sample injection with standard syringes and pumps makes the method readily adapted for experimentation in hospitals.
Introduction
The deformability or stiffness of circulating cells is emerging more and more clearly as an important parameter for the diagnosis and prognosis of numerous pathologies. For instance, cells circulating in the human blood system are strongly deformed during each passage across the highly ramified microvasculature of organs. In normal conditions, circulating cells with a typical diameter around 10 μm are compliant enough to pass through the network of organ capillaries, whose diameter can be as small as 2 μm. However, in the context of some pathologies such as pneumonia,1 sepsis,2 acute respiratory distress syndrome,3,4 and cancer,5–7 cells circulating in the blood stream can get blocked in the microvasculature due to an abnormally high stiffness, and thereafter trigger various complications. Cancer cells are also known to have abnormal mechanical properties,7,11 and emerging methods for early cancer diagnostics via the detection of rare metastatic circulating tumour cells (CTC) in the blood circulation8–10 have not exploited the cells’ mechanical properties yet. Taken together, these examples show that the measurement of cell stiffness distributions and the separation of cells by stiffness in a cell population are highly relevant for novel clinical investigation, monitoring and diagnostics. Nevertheless, to our knowledge no standard routine test available in hospital biology laboratories exists yet to probe or separate circulating cells by deformability.Deformability measurement
During the last few decades, several methods have been developed to probe the deformability of circulating cells. Microfiltration experiments consist of measuring the transit times of cells through micropore filters12–19 and abnormal transit times are attributed to an alteration of leukocyte stiffness. These methods have been successful to link cell mechanical alterations with various diseases,12,14,15 but their weakness is to only yield the average information on a cell population or the endpoint information (e.g. occlusion of filter). Other techniques permit the measurement of single cell transit times through micropores via opto-electronic or resistive detection of the cell passage and reconstruction of the stiffness distribution. Among these, single pore techniques are limited in throughput and are sensitive to clogging, whereas multi-pore techniques, such as Cell Transit Analyzer (CTA)20–23 may ignore the contribution of slow circulating cells and miss the presence of the stiffest cells. Moreover, CTA, which uses high pressures and large pores, renders difficult the comparison with physiological flow conditions. Aside from multi-cell filter techniques, static single cell experimentations, e.g. the micropipette aspiration technique,24,25 cell poker26,27 or atomic force microscopy,28 allow precise mechanical measurements by the analysis of cell deformation under a controlled strain imposed by the suction of a cell in a constriction (micropipette) or by a force exerted with a tip (AFM and cell poker). However, these techniques are cumbersome to carry out (micropipettes), and have low throughput as well as high equipment cost, which has precluded their use for fast clinical routine applications. Micro-rheology based on analysis of the thermal motion of internal organelles of neutrophils has also yielded quantitative measurements of rheological properties at the single cell level,29 but again, this technique requires high magnification microscopy, fast video-microscopy acquisition and tedious computational analysis, which are not adapted to fast and large throughput applications in clinical situations. Recently, a commercial micro-fabricated tool (MCFAN, Hitachi–Haramachi Electronics, Hitachi, Ibaraki, Japan), which resembles CTA with an in situ microscopy observation, has allowed measurements with whole blood within 10 min. This technique is well adapted for clinical situations but data about the transit time of a 100 μL sample and the number of obstructed micro-channels could only yield average information and not the distribution of cell stiffness properties in a population. Microfluidic techniques based on optical stretching,26 or capillary like micro-channels6,29–32 have recently proven their capacity to determine stiffness distributions in a cell population of leukocytes,4,6,31 erythrocytes33–36 or cancer cells.15 The optical stretching technique26 is a very convenient and high-throughput method, which has the advantage of avoiding interactions between cells and solid interfaces, which is known as a potential source of cell activation or damage.37The method developed in the present work is based on cell passage in capillary channels as it allows mimicking of the large mechanical deformation and pressure gradients experienced by cells during their physiological passage though the narrow constrictions of the blood capillaries. This approach is therefore directly relevant for the analysis of pathologies involving impairment of the passage of circulating cells through the microvasculature. We aim to use capillary channels to design a tool performing fast and passive measurements of cell deformability distributions in a suspension. Passive analysis is particularly interesting for point-of-care (POC) applications.
Sorting by deformability
Cell sorting has played a very important role in modern biology with the historical tools of the Fluorescent Activated Cell Sorter (FACS)38 and Coulter Counter.39 The Coulter Counter has even become one of the major techniques in the routine clinical analysis of blood components, known as complete blood counts (CBC). The lab-on-a-chip community has then worked on the implementation of FACS and Coulter Counter principles on chip based planar technology,40 which may be interesting for automated continuous separation, achievement of true POC systems,41 integration in multiple lab-on-a-chip devices with advanced capabilities coupling various actuation and sensing/monitoring concepts. Among these developments, one can distinguish active separation techniques based on the external fields applied to cells (magnetophoresis, optical trapping, dielectrophoresis, accoustophoresis, specific adhesion8) from passive separation techniques, which are only based on interactions between fluids, channels and cells.40 We are interested in this work in passive separation, which requires no sophisticated feed-back control. Pioneer work by Carlson et al.42 has shown that a lattice of narrow channels allows the self-fractionation of white blood cells by a combination of the stretch-activated adhesion of cells with the walls, stochastic sticking probabilities, and heteroavoidance between granulocytes and lymphocytes. Deterministic lateral displacement (DLD) uses a network of posts with asymmetrical repartition, which induces straight trajectories for small particles and sideways drifted trajectories for larger particles.43,44Hydrodynamic filtration and pinched flow fractionation uses the fact that particles of different sizes, pushed against a channel wall, have their centre of mass at different distances from the wall due to a simple steric effect. Particles are therefore located in different flow lines, and a downstream flow division in different exit channels allows the separation of cells of different sizes.32,45,46 Finally, it has been recently proposed that a subtle balance of inertia effects, lift force and Dean vortices could also be used to separate particles or cells by size in microfluidic devices.47–50 Altogether, despite the tremendous interest and efforts developed in cell sorting, it is noticeable that cell sorting by deformability has attracted little attention. Indeed, only few studies report a passive method for the separation of malaria-infected erythrocytes based either on self-margination of infected cells in channels edges51 or on passage in arrays of triangular pillars.52 Recently, Beech et al.53 have shown on erythrocytes that a passive DLD method can be sensitive, not only to size, but also to the shape and deformability of cells, whereas McFaul et al.54 have used funnelled ratchets to separate leukocytes from microparticles. To our knowledge, no other cell sorting method by deformability developed for leukocytes exists.In this work, we present a simple microfluidic device made of successive filters in series, each filter having a finer porosity from the upstream to the downstream. We show how this passive device allows one to analyse the distribution of cells in terms of their ability to travel across narrow microchannels, which is particularly interesting from a medical point of view to probe the capability of cells to obstruct the blood capillary beds in pathological situations. The method is efficient, fast and simple, as it uses no feed-back system, no fast acquisition capability and no sophisticated injection system. Measurements are performed in a regular PDMS chip with commonly available tubing, syringes, and syringe pump. The performance of the microfluidic gradual filter to compare changes in the deformability of a cell population is demonstrated with leukocytes, whose stiffness is altered by pharmacological agents modifying the actin polymerization state. The medical diagnostic capabilities of cell deformability impairment are demonstrated with experiments performed on whole blood samples from a sane donor and with leukocyte suspensions incubated in sera from ARDS patients. We then show the feasibility of cell sorting by the differential capacity of cells to travel though narrow capillaries using a bi-disperse population of stiff and soft cells that can be physically separated in the gradual filter. Finally, we discuss how the method can be further improved to perform faster and continuous analysis or separation. Altogether, our new microfluidic method is a versatile tool that may open interesting routes for future routine clinical analysis.
Materials and methods
Microfabrication
Microfluidic gradual filter devices were fabricated using standard soft lithography routines.55 A positive mold was created with SU-8 2000 series negative resins (Microchem, Newton, MA, USA) spin-coated on silicon wafers (Siltronix, Archamps, France). A mold was realized by the superposition of 3 resin layers insulated with 3 different chromium masks (Toppan Photomask, Texas, USA) with a photolithography aligner device (MJB4, Süss Microtec, Munich, Germany). The three levels have been measured by profilometry at 4.1, 14.2 and 41.4 μm. Replicas of the molds were made in polydimethylsiloxane, PDMS (Sylgard 184 Silicone Elastomer Kit, Dow Corning, Midland, USA). Ports to plug inlet and outlet tubings were made with a 1 mm diameter puncher and the devices were finalized by sealing the PDMS replica on a 170 μm thick glass coverslide via O2-plasma activation (Harricks plasma) of both surfaces. All channels were incubated with a 1% Pluronics® F108 solution (BASF, Mount Olive NJ, USA) for 1 h to deter cell adhesion.Experimental set-up
Fluids were injected in the micro-chips using a syringe pump (Razel, Scientific instrument, St Alnans, VT, US) and 10 mL Luer syringes connected via Luer needles (27 G × 3/4′′ Terumo, Leuwen, Belgium) to micromedical polyethylene tubings of inner and outer diameter 0.38 and 1.09 mm respectively (BB31695-PE/2, SCI, Lake Havasu, AZ, US). These latter tubings are directly plugged in the port holes of the PDMS chip. Injection of a cell suspension sample in the injection circuits is performed between two 3-way Luer valves. Observations were taken with an automated inverted microscope (Zeiss Observer) equipped with an X20 objective (Zeiss apochromat 20×/0.8), and a Coolsnap HQ2 camera (Photometrics, Tucson, USA). The experiment was controlled by μManager open source software.56Cell preparation and reagents
Monocytic THP-1 line cells57 were maintained in Roswell Park Memorial Institute-1640 medium (Invitrogen, Cergy Pontoise, France) supplemented with 20 mM HEPES buffer, 10% fetal calf serum (FCS), and 2 mM L-glutamine. Stock cell cultures were passaged twice weekly and maintained at 37 °C in a humidified atmosphere containing 5% CO2. The cell diameter was determined by cytometry at 14 ± 2 μm (mean ± SD). To modify cell stiffness, THP-1 cell suspensions at a concentration of 106 cells mL−1 were incubated for 30 min at 37 °C, either with LatrunculinA (L12370, 2.37 mM, Molecular Probes, Eugene, OR, US) at 3 μg mL−1, Jasplakinolide (EMD Chemicals, Inc., San Diego, CA, US) at 3 μg mL−1, or Glutaraldehyde (G7651, Sigma–Aldrich) at 250 μg mL−1. Fluorescent labelling was obtained by incubating THP-1 cell suspensions at a concentration of 106 cells mL−1 in octadecyl rhodamine B chloride (O-246, Molecular Probes) or Vybrant Dio cell-labelling solution (V22886, Invitrogen) at 5 μg mL−1 for 30 min at 37 °C. The labelling step was followed by washing with pure medium. The sera of patients with acute respiratory distress syndrome (ARDS) were obtained from the medical intensive care unit (ICU) of ‘La Conception University Hospital’ in Marseille, France. They were issued from patients admitted between 2008 and 2011, and have been investigated after written informed consent was obtained from each patient's next of kin. The study was approved by our ethics committee (‘Comité Consultatif de Protection des Personnes dans le Recherche Biomédicale de Marseille’). 1 mL of serum was sampled 2 days after entry of each patient in ICU and stored at −80 °C. The sera used as a control were obtained from healthy volunteers. Incubations of cells with the sera of ARDS patients and healthy volunteers were performed for 1 h at a concentration of 10% in a medium without FCS.Results and discussion
1 – The gradual filter method
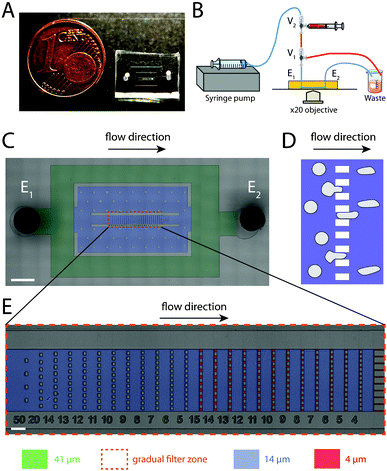 | ||
| Fig. 1 Gradual filter method and design. (A) Picture of a gradual filter method chip mounted on a glass microslide and positioned next to a 1 cent euro coin as a scale reference. (B) Schematic of the simple injection system. A fixed volume of cell suspension (red) is inserted in the inlet tubing via a loading zone between two 3-way valves V1 and V2. A constant flow rate of culture medium (blue) is applied with a standard syringe pump in the gradual filter chip. (C) Micrograph of the microfluidic device. The gradual filter zone is surrounded by the orange dashed box. All channels have been colored according to their ceiling height (green for 41 μm, blue for 14 μm and red for 4 μm). The device has one inlet E1 and one outlet E2. Two Ψ-junctions reduce the flow rate and the cell numbers entering in the gradual filter zone by a factor r = 6500. The black arrow indicates flow direction and the scale bar corresponds to 1000 μm. (D) Schematics of a comb-like microfluidic filter composed of parallelized identical constrictions. The blue zone represents the fluidic channels, and grey objects the cells passing through the filter. (E) Micrograph of the gradual filter zone. It comprises several stages in series from the upstream (left) to the downstream (right), each stage being separated by a comb-like filter of parallelized identical microchannels. The microfabricated numbers below the stages indicate the microchannel width of the next downstream comb-like filter, whereas the colorization indicates the channel ceiling height (blue for 14 μm and red for 4 μm). The cross sections of the comb-like filter channels decrease by 1 μm (either in width or height) from one stage to the other when following the flow direction (black arrow). The scale bar corresponds to 100 μm. | ||
 | (1) |
 | ||
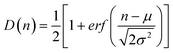
| Fig. 2 Measurement in a gradual filter. (A) Micrograph of a gradual filter with normal THP-1 cells distributed in different stages during an injection at 12.7 mL h−1 for 6 min. The red numbers correspond to the stage number n used to plot data. The white scale bar corresponds to 100 μm. (B) Number of cells (bars) and (C) cumulative fraction of cells (dots) in the stages of the gradual filter vs. the position in filter n (total number of cells N = 300). The solid line corresponds to a fit by a normal distribution (eqn (1)) of mean μ = 13.2 and standard deviation σ = 4.6. | ||
The adjustable parameters in our experiments are the concentration C and volume V of the cell dispersion to analyse, the flow rate of injection Q, and the time of flowing T. The product C.V.r , where r is the total flow reduction before the gradual filter, determines the number of cells entering in the gradual filter per injection. To avoid simultaneous plugging of multiple constrictions of a given stage by several cells and avoid perturbations of the pressure drop across each stage (Fig. S1†), it is preferable to inject less than 100 cells per experiment. On the other hand, the goal to handle amounts of samples with standard lab-scale methods, e.g. micro-pipettes or Luer fitting syringes and valves, imposes a range of volume V around 200–1000 μL. Appropriate experimental conditions were obtained with C = 106 cells mL−1 and V = 500 μL. Flow rates Q should not be chosen too low in order to limit sedimentation of cells in the tubings, which may bias the arrival of cells as a compact group. Considering a standard sedimentation velocity of leukocytes around 2 μm s−1 and a tubing diameter of 300 μm, the arrival time of cells from the loading zone (between valves V1 and V2) to the microfluidic device should last less than the sedimentation time of cells across tubing diameter, i.e. 150 s. For a sample of 500 μL, Q should therefore not be lower than 5 μL s−1 or 12 mL h−1. To limit sedimentation effects, it is also useful to set the tubing between the loading zone and the microfluidic device entrance in a vertical position (Fig. 1B). Finally, the time difference, ΔTarrival, between the arrival of the first and the last cells at the entrance of the gradual filter tends to spread the dispersion of cells in the gradual filter and decrease the resolution of the measurement. In order to limit this effect, the ratio between ΔTarrival, and the effective time of cells under flow in the gradual device, Teff, should be as small as possible, which imposes to increase the flowing time T. We have tested different combinations of flow rate Q, between 10 and 100 mL h−1, and flowing times T, between 3 and 12 min (see ESI Fig. S†). Increasing Q or T tends to push cells further downstream in the gradual filter. These two parameters have to be chosen depending on the distribution of cell stiffness, the constraints on the duration of the measurement, and a compromise for the optimization of the ratio ΔTarrival![[thin space (1/6-em)]](https://www.rsc.org/images/entities/char_2009.gif) :Teff. Typical experimental conditions used in this work with THP-1 cells correspond to Q = 12.7 mL h−1 and T = 6–9 min. They allow the keeping of all normal cells inside the gradual filter at the end of the experiment (Fig. 2A). The lag time before the first arrival of the cell in the gradual device is 1 min, and the ratio ΔTarrival:Teff around 0.3–0.5.
:Teff. Typical experimental conditions used in this work with THP-1 cells correspond to Q = 12.7 mL h−1 and T = 6–9 min. They allow the keeping of all normal cells inside the gradual filter at the end of the experiment (Fig. 2A). The lag time before the first arrival of the cell in the gradual device is 1 min, and the ratio ΔTarrival:Teff around 0.3–0.5.
 | ||
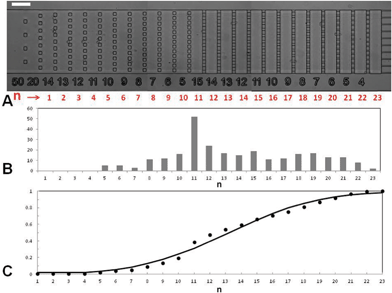
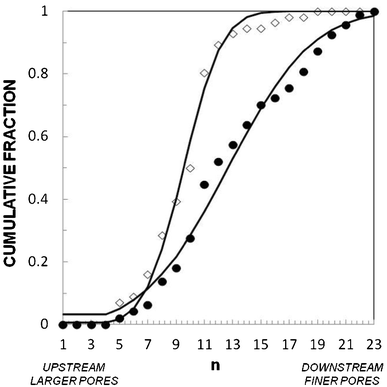
| Fig. 3 Stiffness distribution of model cells with a modified actin network. Cumulative fraction of cells in the stages of the gradual filter vs. position in filter n for (●) normal, (△) Jpk-treated, and (◇) LatA-treated THP-1 cells at Q = 12.7 mL h−1 for T = 6 min. Solid lines are a guide for the eye for LatA-treated cells, and fits by normal distributions for Jpk-treated (μ = 9.1 and σ = 1.9) and normal (μ = 14.7 and σ = 5.6) cells. (Control N = 70, LatA N = 100, Jpk N = 140.) | ||
It is interesting to realize that the cell distribution in the filter permits the detection of relative stiffness changes for a given cell population submitted to different treatments. However, a given cell distribution in the gradual filter is not an absolute signature of the cell stiffness distribution, because the ability of a cell to travel down the filter depends both on their stiffness and their size. For an analysis of absolute cell deformability distribution, one could for instance place a system sorting cells by size (e.g. a Determinisic Lateral Displacement device44) upstream of the gradual filter in order to analyze only cells of similar size. Nevertheless, for clinical applications, where the point is to probe the average ability of a real cell population to travel across the microvasculature, an experiment in a gradual filter directly with polydisperse samples remains more relevant.
 | ||
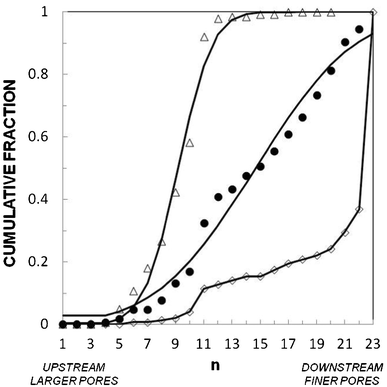
| Fig. 4 Application to a pathology (ARDS). Cumulative fraction of cells in the stages of the gradual filter vs. position in the filter for (●) healthy volunteer treated, and (◇) ARDS-serum-treated THP-1 cells at Q = 12.7 mL h−1 for T = 9 min. Solid lines correspond to fits by log-normal distributions with μ = 12.6 and σ = 5.5 for normal cells and μ = 9.5 and σ = 2.1 for serum-treated cells. (Control N = 94, ARDS N = 60). | ||
The medical relevance of the method concerns not only the analysis of patients' cells or patients' serum effect. It can be further used to identify the cytokines in patients' sera that are responsible for cell stiffening, for instance by testing the effect of recombinant cytokines on model cells. Therapeutic essays that aim to reverse the stiffening effect can also be tested without constraints by using this in vitro method that permits the screening of the potential efficiency of drugs on leukocyte softening. Finally, it is interesting to realize that the step to transform the method into a fast point of care (POC) analysis technique is somehow short, as it only requires a fast and automatic analysis read-out of the repartition of cells in the gradual filter. Technical solutions without microscopic imaging could also be used such as the measurement of the resistivity of each stage of the filter via the implementation of a micro-electrode in the device.
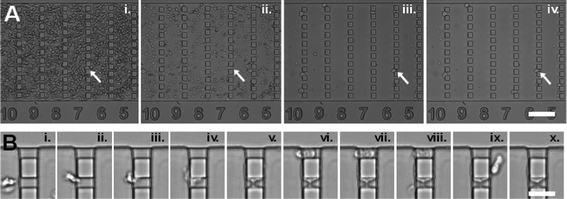 | ||
| Fig. 5 Measurement with whole blood. Image sequences taken in a gradual filter during an injection of whole blood at Q = 12.7 mL h−1. (A) Region of ceiling height 14 μm at times T = (i) 2 min, (ii) 3.5 min , (iii) 6.5 min , and (iv) 10 min. The smaller and more compliant red blood cells are rapidly washed out, while leukocytes are retained and sorted in the gradual filter. White arrows point to a particular leukocyte progressing slowly in the filter. The scale bar corresponds to 100 μm. (B) Zoomed image of a region of two constrictions of section 10 × 4 μm2 showing the entry, adhesion and spreading of one leukocyte on the lower constriction (i.–v.) and the entry and complete passage through the upper constriction without adhesion of another leukocyte (vi.–x.). The scale bar corresponds to 30 μm. Flow direction is from left to right. | ||
One can see in Fig. 5 that a fraction of cells in our experiment are adhering and spreading onto the gradual filter walls, which is a consequence of the fact that neutrophils are easily activated. The device could therefore be further improved by using surface treatments with more efficient repelling properties, more gentle flow conditions, or filter imposing lesser constraints on cells.
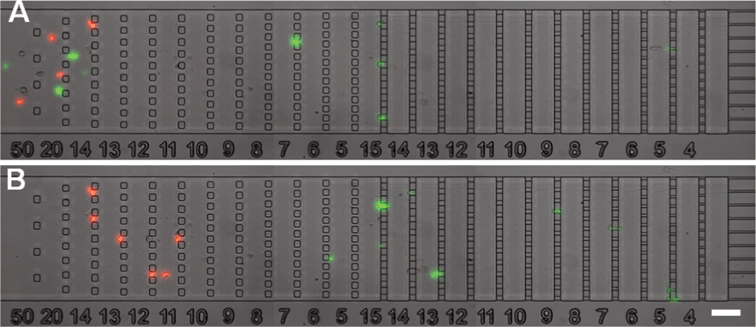 | ||
| Fig. 6 Cell separation by stiffness. Images taken during a separation experiment at Q = 12.7 mL h−1 of a mixture of compliant THP-1 cells (treated by Latrunculin-A and labelled in green by DiO) and stiff THP-1 cells (treated with glutaraldehyde and labelled in red by OR). Time difference between (A) and (B) is 4 min. Stiff red-labelled cells are separated from compliant green-labelled cells. The scale bar corresponds to 100 μm. Flow direction is from left to right. | ||
Conclusion
We have presented a simple, versatile and passive method to test and separate populations of circulating cells by deformability in a multi-stage filter with a gradual porosity decreasing from the upstream to the downstream. This method probes cells with mechanical stress and strain comparable to the ones experienced physiologically by cells passing through blood capillary beds, which makes the method directly relevant to analyze pathologies involving the impairment of microcirculation. The simplicity of both sample manipulation and injection procedure makes the method straightforwardly applicable for clinical use. This method may therefore offer a consequential help for biologists and medical doctors for the diagnosis of several pathologies.Acknowledgements
The authors thank Rhodia Company (LOF, Pessac, France) as well as F. Bedu and I. Ozerov from Cinam (CNRS, Marseilles, France) for technical support with microfabrication, and K. Sperber for participation in some experiments. PP's PhD grant was supported by Région PACA and the company CAPSUM-SAS.References
- K. Yoshida, R. Kondo, Q. Wang and C. Doerschuk, Neutrophil cytoskeletal rearrangements during capillary sequestration in bacterial pneumonia in rats, Am. J. Respir. Crit. Care Med., 2006, 174, 689–698 CrossRef CAS.
- R. Hotchkiss and I. Karl, Medical progress: The pathophysiology and treatment of sepsis, N. Engl. J. Med., 2003, 348, 138–150 CrossRef CAS.
- J. C. Hogg, Neutrophil kinetics and lung injury, Physiological Reviews, 1987, 67, 1249–1295 CAS.
- P. Preira, et al. Microfluidic tools to investigate pathologies in the blood microcirculation, Int. J. Nanotechnol., 2012, 9, 529–547 CrossRef CAS.
- C. Wong, et al. Intravascular location of breast cancer cells after spontaneous metastasis to the lung RID C-5830-2008 RID A-8636-2009, Am. J. Pathol., 2002, 161, 749–753 CrossRef.
- M. J. Rosenbluth, W. A. Lam and D. A. Fletcher, Analyzing cell mechanics in hematologic diseases with microfluidic biophysical flow cytometry, Lab Chip, 2008, 8, 1062–1070 RSC.
- W. A. Lam, M. J. Rosenbluth and D. A. Fletcher, Increased leukaemia cell stiffness is associated with symptoms of leucostasis in paediatric acute lymphoblastic leukaemia, Br. J. Haematol., 2008, 142, 497–501 CrossRef.
- S. Nagrath, et al. Isolation of rare circulating tumour cells in cancer patients by microchip technology RID A-4095-2008, Nature, 2007, 450, 1235–1239 CrossRef CAS.
- S. J. Tan, et al. Versatile label free biochip for the detection of circulating tumor cells from peripheral blood in cancer patients, Biosens. Bioelectron., 2010, 26, 1701–1705 CrossRef CAS.
- S. J. Tan, L. Yobas, G. Y. H. Lee, C. N. Ong and C. T. Lim, Microdevice for the isolation and enumeration of cancer cells from blood RID E-8638-2010 RID B-3307-2011, Biomed. Microdevices, 2009, 11, 883–892 CrossRef.
- S. E. Cross, Y.-S. Jin, J. Rao and J. K. Gimzewski, Nanomechanical analysis of cells from cancer patients, Nat. Nanotechnol., 2007, 2, 780–783 CrossRef CAS.
- P. C. Yodice, M. E. Astiz, B. M. Kurian, R. Y. Lin and E. C. Rackow, Neutrophil rheologic changes in septic shock, Am. J. Respir. Crit. Care Med., 1997, 155, 38–42 CAS.
- R. Frank, Time-dependent alterations in the deformability of human neutrophils in response to chemotactic activation, Blood, 1990, 76, 2606–2612 CAS.
- G. Ciuffetti, R. Balendra, S. E. Lennie, J. Anderson and G. D. Lowe, Impaired filterability of white cells in acute cerebral infarction, Br. Med. J., 1989, 298, 930–931 CrossRef CAS.
- G. B. Nash, B. Christopher, A. J. Morris and J. A. Dormandy, Changes in the flow properties of white blood cells after acute myocardial infarction, Heart, 1989, 62, 329–334 CrossRef CAS.
- B. Amundson, U. Bagge and H. Haljamäe, Control of tissue environment during vital microscopy of the microcirculation in the m. tenuissimus in cat, Acta Physiol. Scand., 1980, 108, 139–146 CrossRef CAS.
- G. P. Downey, et al. : Retention of leukocytes in capillaries: role of cell size and deformability, Journal of Applied Physiology, 1990, 69, 1767–1778 CAS.
- S. Erzurum, et al. Mechanisms of lipopolysaccharide-induced neutrophil retention. Relative contributions of adhesive and cellular mechanical properties, The Journal of Immunology, 1992, 149, 154–162 CAS.
- B. Yap and R. Kamm, Cytoskeletal remodeling and cellular activation during deformation of neutrophils into narrow channels, J. Appl. Physiol., 2005, 99, 2323–2330 CrossRef CAS.
- S. Chien and K. L. Sung, Effect of colchicine on viscoelastic properties of neutrophils, Biophys. J., 1984, 46, 383–386 CrossRef CAS.
- G. Moessmer and H. J. Meiselman, A new micropore filtration approach to the analysis of white cell rheology, Biorheology, 1990, 27, 829–848 CAS.
- E. M. Drost and W. MacNee, Potential role of IL-8, platelet-activating factor and TNF-alpha in the sequestration of neutrophils in the lung: effects on neutrophil deformability, adhesion receptor expression, and chemotaxis, Eur. J. Immunol., 2002, 32, 393–403 CrossRef CAS.
- E. M. Drost, G. Kassabian, H. J. Meiselman, D. Gelmont and T. C. Fisher, Increased Rigidity and Priming of Polymorphonuclear Leukocytes in Sepsis, American Journal of Respiratory and Critical Care Medicine, 1999, 159, 1696–1702 CAS.
- A. T. Skoutelis, et al. Neutrophil deformability in patients with sepsis, septic shock, and adult respiratory distress syndrome, Crit. Care Med., 2000, 28, 2355–2359 CrossRef CAS.
- A. T. Skoutelis, et al. Effect of cytokines and colony-stimulating factors on passive polymorphonuclear leukocyte deformability in vitro, Cytokine, 2000, 12, 1737–1740 CrossRef CAS.
- F. Lautenschläger, et al. The regulatory role of cell mechanics for migration of differentiating myeloid cells, Proc. Natl. Acad. Sci. U. S. A., 2009, 106, 15696–15701 CrossRef.
- G. Worthen, B. Schwab, E. Elson and G. Downey, Mechanics of stimulated neutrophils: cell stiffening induces retention in capillaries, Science, 1989, 245, 183–186 CAS.
- W. A. Lam, M. J. Rosenbluth and D. A. Fletcher, Chemotherapy exposure increases leukemia cell stiffness, Blood, 2007, 109, 3505–3508 CrossRef CAS.
- B. Yap and R. Kamm, Mechanical deformation of neutrophils into narrow channels induces pseudopod projection and changes in biomechanical properties, J. Appl. Physiol., 2005, 98, 1930–1939 CrossRef.
- J. Shelby, J. White, K. Ganesan, P. Rathod and D. Chiu, A microfluidic model for single-cell capillary obstruction by Plasmodium falciparum infected erythrocytes, Proc. Natl. Acad. Sci. U. S. A., 2003, 100, 14618–14622 CrossRef CAS.
- S. Gabriele, A. Benoliel-M., P. Bongrand and O. Théodoly, Microfluidic investigation reveals distinct roles for actin cytoskeleton and myosin II activity in capillary leukocyte trafficking, Biophys. J., 2009, 96, 4308–4318 CrossRef CAS.
- S. Gabriele, M. Versaevel, P. Preira and O. Théodoly, A simple microfluidic method to select, isolate, and manipulate single-cells in mechanical and biochemical assays, Lab Chip, 2010, 10, 1459–1467 RSC.
- M. Abkarian, M. Faivre and H. Stone, High-speed microfluidic differential manometer for cellular-scale hydrodynamics RID B-6435-2008, Proc. Natl. Acad. Sci. U. S. A., 2006, 103, 538–542 CrossRef CAS.
- T. Herricks, M. Antia and P. K. Rathod, Deformability limits of Plasmodium falciparum-infected red blood cells, Cell. Microbiol., 2009, 11, 1340–1353 CrossRef CAS.
- S. Shevkoplyas, T. Yoshida, S. Gifford and M. Bitensky, Direct measurement of the impact of impaired erythrocyte deformability on microvascular network perfusion in a microfluidic device RID G-2466-2010, Lab Chip, 2006, 6, 914–920 RSC.
- Q. Guo, S. J. Reiling, P. Rohrbach and H. Ma, Microfluidic biomechanical assay for red blood cells parasitized by Plasmodium falciparum, Lab Chip, 2012, 12, 1143–1150 RSC.
- T. Kuijpers, et al. Membrane-surface antigen expression on neutrophils – a reappraisal of the use of surface-markers for neutrophil activation, Blood, 1991, 78, 1105–1111 CAS.
- M. H. Julius, E. Simpson and L. A. Herzenberg, A rapid method for the isolation of functional thymus-derived murine lymphocytes, Eur. J. Immunol., 1973, 3, 645–649 CrossRef CAS.
- W. H. Coulter, Means for counting particles suspended in a fluid, U. S. Patent No. 2656508, 1953 Search PubMed.
- A. Lenshof and T. Laurell, Continuous separation of cells and particles in microfluidic systems, Chem. Soc. Rev., 2010, 39, 1203–1217 RSC.
- V. Gubala, L. F. Harris, A. J. Ricco, M. X. Tan and D. E. Williams, Point of Care Diagnostics: Status and Future, Anal. Chem., 2012, 84, 487–515 CrossRef CAS.
- R. Carlson, et al. Self-sorting of white blood cells in a lattice, Phys. Rev. Lett., 1997, 79, 2149–2152 CrossRef CAS.
- L. Huang, E. Cox, R. Austin and J. Sturm, Continuous particle separation through deterministic lateral displacement, Science, 2004, 304, 987–990 CrossRef CAS.
- D. Inglis, J. Davis, R. Austin and J. Sturm, Critical particle size for fractionation by deterministic lateral displacement, Lab Chip, 2006, 6, 655–658 RSC.
- J. Takagi, M. Yamada, M. Yasuda and M. Seki, Continuous particle separation in a microchannel having asymmetrically arranged multiple branches RID B-2271-2010, Lab Chip, 2005, 5, 778–784 RSC.
- M. Yamada, M. Nakashima and M. Seki, Pinched flow fractionation: Continuous size separation of particles utilizing a laminar flow profile in a pinched microchannel, Anal. Chem., 2004, 76, 5465–5471 CrossRef CAS.
- A. A. S. Bhagat, H. W. Hou, L. D. Li, C. T. Lim and J. Han, Pinched flow coupled shear-modulated inertial microfluidics for high-throughput rare blood cell separation RID B-3307-2011, Lab Chip, 2011, 11, 1870–1878 RSC.
- A. A. S. Bhagat, S. S. Kuntaegowdanahalli and I. Papautsky, Continuous particle separation in spiral microchannels using dean flows and differential migration, Lab Chip, 2008, 8, 1906–1914 RSC.
- M. Chabert and J.-L. Viovy, Microfluidic high-throughput encapsulation and hydrodynamic self-sorting of single cells RID B-2223-2010, Proc. Natl. Acad. Sci. U. S. A., 2008, 105, 3191–3196 CrossRef CAS.
- Z. Wu, B. Willing, J. Bjerketorp, J. K. Jansson and K. Hjort, Soft inertial microfluidics for high throughput separation of bacteria from human blood cells, Lab Chip, 2009, 9, 1193–1199 RSC.
- H. W. Hou, et al. Deformability based cell margination-A simple microfluidic design for malaria-infected erythrocyte separation RID B-3307-2011, Lab Chip, 2010, 10, 2605–2613 RSC.
- H. Bow, et al. A microfabricated deformability-based flow cytometer with application to malaria, Lab Chip, 2011, 11, 1065 RSC.
- J. P. Beech, S. H. Holm, K. Adolfsson and J. O. Tegenfeldt, Sorting cells by size, shape and deformability, Lab Chip, 2012, 12, 1048–1051 RSC.
- S. M. McFaul, B. K. Lin and H. Ma, Cell separation based on size and deformability using microfluidic funnel ratchets, Lab Chip, 2012, 12, 2369–2376 RSC.
- J. M. K. Ng, I. Gitlin, A. D. Stroock and G. M. Whitesides, Components for integrated poly(dimethylsiloxane) microfluidic systems, Electrophoresis, 2002, 23, 3461–3473 CrossRef CAS.
- A. Edelstein, N. Amodaj, K. Hoover, R. Vale and N. Stuurman, Computer Control of Microscopes Using (Manager. Current Protocols in Molecular Biology ( 2010) at http://doi.wiley.com/10.1002/0471142727.mb1420s92.
- S. Tsuchiya, et al. Establishment and characterization of a human acute monocytic leukemia cell line (THP-1), Int. J. Cancer, 1980, 26, 171–176 CrossRef CAS.
- H. Lipowsky, S. Kovalcheck and B. Zweifach, Distribution of Blood Rheological Parameters in Microvasculature of Cat Mesentery, Circ. Res., 1978, 43, 738–749 CrossRef CAS.
- D. G. Ashbaugh, D. B. Bigelow, T. L. Petty and B. E. Levine, Acute respiratory distress in adults, Lancet, 1967, 290, 319–323 CrossRef.
- L. B. Ware and M. A. Matthay, The acute respiratory distress syndrome, N. Engl. J. Med., 2000, 342, 1334–1349 CrossRef CAS.
- M. Nishino, et al. Serial changes in leukocyte deformability and whole blood rheology in patients with sepsis or trauma, J. Trauma: Inj., Infect., Crit. Care, 2005, 59, 1425–1431 CrossRef.
- J. P. Arata and A. Alexeev, Designing microfluidic channel that separates elastic particles upon stiffness RID B-1322-2011, Soft Matter, 2009, 5, 2721–2724 RSC.
Footnotes |
| † Electronic supplementary information (ESI) available. See DOI: 10.1039/c2lc40847c |
| ‡ Current Address: Mechanobiology & Soft Matter Group, Laboratoire Interfaces et Fluides Complexes, CIRMAP, Université de Mons, 20, Place du Parc, B-7000 Mons, Belgium |
| This journal is © The Royal Society of Chemistry 2013 |