A systematic evaluation of the role of crystalline order in nanoporous materials on DNA separation†
Neda
Nazemifard
a,
Ledi
Wang
b,
Wenmin
Ye
b,
Subir
Bhattacharjee
c,
Jacob H.
Masliyah
a and
D. Jed
Harrison
*b
aDepartment of Chemical and Materials Engineering, University of Alberta, Edmonton, Canada. E-mail: nn1@ualberta.ca; Tel: +1 780 492 3193
bDepartment of Chemistry, University of Alberta, Edmonton, Canada. E-mail: jed.harrison@ualberta.ca; Tel: +1 780 492 3249
cDepartment of Mechanical Engineering, Edmonton, Canada
First published on 22nd November 2011
Abstract
The role of order within a porous separation matrix on the separation efficiency of DNA was studied systematically. DNA separation was based on a ratchet mechanism. Monodisperse colloidal suspensions of nanoparticles were used to fabricate highly ordered separation media with a hexagonal close-packed structure. Doping with a second particle size yielded structures with different degrees of disorder, depending upon the volume fraction of each particle size. Radial distribution functions and orientational order parameters were calculated from electron micrographs to characterize the scale of disorder. The peak separation distance, band broadening, and separation resolution of DNA molecules was quantified for each structure. DNA separation parameters using pulsed fields and the ratchet effect showed a strong dependence on order within the porous nanoparticle array. Ordered structures gave large separation distances, smaller band broadening and better resolution than highly disordered, nearly random, porous structures. The effect dominated these three parameters when compared to the effect of pore size. However, the effect of order on separation performance was not monotonic. A small, but statistically significant improvement was seen in structures with short range order compared to those with long range order.
Introduction
The separation of DNA molecules by size is essential in molecular biology. Microfabrication techniques have led to implementation of new separation mechanisms for DNA, which essentially arise from the high level of order that can be fabricated within the porous structure that makes up the separation matrix. In other microfluidic separation devices, such as the work of Baba and colleagues,1 that replicate gel separation mechanisms, the random geometry of the gel has been replaced by a highly ordered microarray of pillars, with well controlled pore sizes. In contrast, conventional DNA separations are performed in a gel made of Agarose or polyacrylamide, with a highly random structure exhibiting a wide distribution of pore sizes.2,3 The opportunity to fabricate porous structures with varying degrees of order raises the interesting question as to how an ordered, coherently repetitive structure will influence the separation of large biomolecules. In this report, we examine the impact of the order of the porous matrix on the quality of size separation of DNA, an issue which has not yet been addressed experimentally despite the opportunities presented by microfabrication to control order in a porous matrix. Some modelling works4–6 have suggested there can be important differences between ordered and disordered porous materials, highlighting the importance of an experimental evaluation.Pulsed field gel electrophoresis (PFGE) has been the conventional method of separating long DNA molecules (≥ 10 kbp).7–9 The separation mechanism in PFGE depends upon head and tail switching (reorientation) of DNA molecules,10,11 as larger molecules have a longer reorientation time compared to smaller molecules,12 and involves substantial collisions with the polymer matrix that makes up the separation media. The use of two-dimensional separation mechanisms in a microfabricated array structure for DNA separation was pioneered by Austin,13 who separated DNA molecules with obtuse-angle pulsed fields. Separation arises from the pulsed electric field causing DNA molecules to stretch and reorient periodically, with their head and tail repeatedly switched (Fig. 1a). Due to this periodic head and tail switching, the net migration of DNA molecules of different lengths is biased into different angles by the asymmetric fields; larger molecules are deflected farther from the injection angle compared to smaller ones as shown in Fig. 1. The separation matrix provides the lanes for the DNA to travel and the narrow pores confine the DNA to remain significantly stretched for the majority of the time; collisions are not a dominant factor.
Recently, we developed a microfluidic chip packed with self-assembled nanoparticle arrays for two-dimensional pulsed field DNA separation,14,15 An evaporation induced self-assembly technique, known as colloidal self-assembly (CSA), was employed to form hexagonal close packed nanoparticles, as described elsewhere.15–17 The self-assembly approach provides an opportunity to systematically study the effect of order of the separation matrix on DNA separation. Monodisperse particle suspensions form uniform, ordered structures similar to microfabricated arrays, while bidisperse particle suspensions, exhibit disorder with some similarity to the disordered structure of gels. By changing the ratio of the particle concentrations in bidisperse solution, structures with different degrees of disorder can be fabricated. Using this scheme, structures varying from highly ordered to essentially random structures, along with states in between, can be reproducibly fabricated and used to probe the role of order on DNA separation in a pulsed electric field.
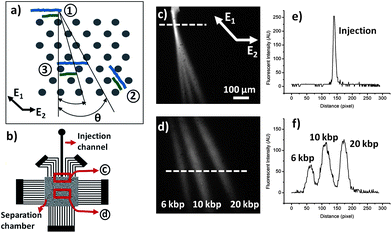 | ||
| Fig. 1 (a) Separation mechanism under pulsed electric field is shown schematically in a hexagonal array, where (1) is the initial position of two molecules with different lengths (2) is the position of the molecules just before the field direction changes from E1 to E2, and (3) is the position of the molecules at the end of one cycle. (b) Schematic of the DNA separation microchip. (c) Fluorescent image of the junction of the separation chamber and injection channel. A mixture of three different sizes of DNA: 6, 10, and 20 kbp is continuously injected into the separation chamber. (d) Fluorescent image of the separated DNA molecules in the middle of the separation chamber. (e) and (f) fluorescent intensity profiles at the injection and the middle of the separation chamber along the dashed lines in (c) and (d), respectively. | ||
Interestingly, Wirth and colleagues16 have speculated that they achieved high efficiencies in CSA devices as a result of the high degree of order, while Ahn and coworkers17 felt defects had prevented them from achieving high efficiencies. Viovy18 developed microarrays comprising randomly ordered self-assembled columns of magnetic beads, formed upon imposition of magnetic field. Several researchers4,5 developed numerical simulations to study the effects of order on DNA electrophoresis within these one-dimensional, sparse (dilute) arrays of obstacles where the spacing between the obstacles (∼ 1–4 μm) was orders of magnitude larger than the persistence length of DNA (∼ 50 nm). The separation mechanism of DNA in a sparse post array such as these magnetic bead arrays is different from the separation mechanism in PFGE and is based on collision frequency of DNA molecules with the obstacles.19,20 Patel and Shaqfeh4 concluded that fully random post arrays would give better separation than fully ordered post arrays using a numerical simulation for this separation technique. Mohan and Doyle5 refined this numerical model, calculating that a post array with local order, but no long range order, would give better separation than a disordered array, which would be better than a fully ordered array. Hickey and Slater6 calculated diffusion coefficients for DNA in an ordered porous matrix, observing significant, non-monotonic changes in diffusion with order. These intriguing simulations, though not tested experimentally, show the significance of the role of matrix order on DNA dynamics and separation. Our fabricated devices provide a powerful tool to experimentally explore the importance of order in a porous structure on large molecule separation.
Experimental section
DNA separation
DNA separation was conducted using a microfluidic chip filled with an array of nanoparticles as a sieving matrix. A schematic of the PDMS microchip is shown in Fig. 1b. PDMS microchips were fabricated using a standard soft lithography technique, then sealed to clean glass slides prior to packing, as described in detail elsewhere.15,21 Aqueous suspensions of silica colloids (Bangs Laboratories, Fishers, IN) of 330 and 700 nm diameter were used to form the self-assembled nanoparticle array inside the microchips. DNA fragments (6, 10, 20 kbp, Fermentas Life Sciences) were stained with YOYO-1 (Molecular Probes) using a dye-to-base ratio of 1![[thin space (1/6-em)]](https://www.rsc.org/images/entities/char_2009.gif) :
:![[thin space (1/6-em)]](https://www.rsc.org/images/entities/char_2009.gif) 10. Pulsed field electrophoresis was performed in 4 × TBE buffer to suppress electroosmotic flow, with 4% v/v 2-mercaptoethanol added to reduce photobleaching. Pulsed electric fields were generated by a homebuilt high-voltage amplifier triggered by square wave signals from a synthesized function generator.15DNA samples were excited with a 488-nm argon ion laser beam, and the fluorescent emission was collected using a homemade microscope using a 4× objective (0.1 N.A., Olympus). Digitized images were analyzed using ImageJ (NIH, http://rsb.info.nih.gov/ij/).
10. Pulsed field electrophoresis was performed in 4 × TBE buffer to suppress electroosmotic flow, with 4% v/v 2-mercaptoethanol added to reduce photobleaching. Pulsed electric fields were generated by a homebuilt high-voltage amplifier triggered by square wave signals from a synthesized function generator.15DNA samples were excited with a 488-nm argon ion laser beam, and the fluorescent emission was collected using a homemade microscope using a 4× objective (0.1 N.A., Olympus). Digitized images were analyzed using ImageJ (NIH, http://rsb.info.nih.gov/ij/).
Separation of DNA molecules was conducted by continuously injecting DNA samples into the separation chamber inside the microchip, as described previously.15 The fluorescence image shown in Fig. 1c represents the junction of the injection channel and separation chamber. The applied pulsed electric potentials generate asymmetric obtuse-angle pulsed fields, E1 and E2 across the separation chamber, where the angle between the pulsed fields is ∼ 135° and E1 = 1.4E2 (as shown in Fig. 1c) in all our experiments. The variance for each DNA stream was calculated at a distance of 2 mm from the injection channel. Differences in observed mean variances, or separation distances, or resolution were evaluated for statistical significance at the 95% confidence level.
Self-assembled nanoparticle array structures
Monodisperse suspensions of silica particles (Bangs Laboratories, Fishers, IN) of 320 and 700 nm or mixtures of the two were used to fabricate ordered packed structures inside the separation chamber in the microfluidic device. Particle suspensions have known volume fractions, so simple volumetric mixing gives various volume fractions in the packed beds. SEM images of these structures revealed homogenous, ordered, packed structures, where the pore size is around 15% of the particle size for monodisperse arrays.Results and discussion
In order to introduce defects and disrupt the regular crystalline geometry of self-assembled opal structures, bidisperse suspensions of 320 and 700 nm silica beads with different volume fractions of the 700 nm particles (χ700) were fabricated. This mixture produced packed structures with different degrees of defects, with χ700 = 0 and χ700 = 1 representing the most ordered structures, whereas 0 < χ700 < 1 produced less ordered structures.The porosity of binary packed structures of two particles with size ratios around 0.45 (d/D = 320/700 = 0.45) is known to have a maximum 10% difference compared to the porosity of the monodisperse packed structures of either particle.22–24 This relative uniformity means that the addition of the second particle to the packed structure of the primary particle will affect degree of order far more than the average porosity.
Characterization of the packed structures
Colloidal structures with different χ700 were characterized by SEM images, as shown in Fig. 2a, panels II to V. Panel I shows an image of ideal hexagonally packed spheres, representing the highest degree of order. Using image analysis techniques, the location of the particle centers relative to each was determined. Colloidal order in two-dimensional images can be evaluated by the radial distribution function, g(r), where the number and magnitude of the peaks in the plot of g(r) with respect to r represent the degree of order in the structures.25–27Fig. 2b shows plots of g(r) calculated for the particle centers determined for each corresponding SEM image. A single parameter is more useful for characterizing two-dimensional order, and is provided by a global bond orientational order parameter given as | (1) |
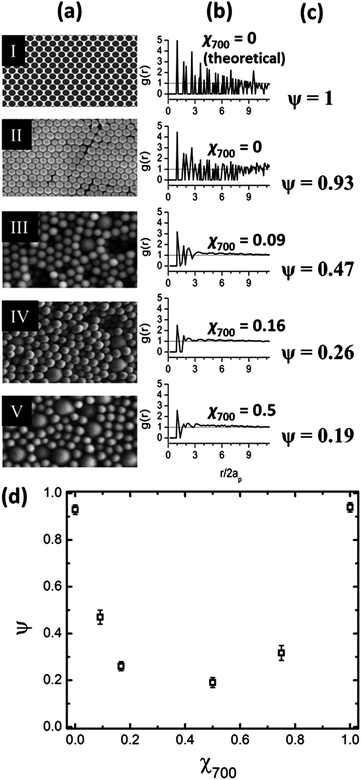 | ||
| Fig. 2 (a) SEM images of the self-assembled packed structures of 320 and 700 nm silica particles with different volume fractions, χ700 from the top: χ700 = 0, 0.09, 0.16, and 0.5. The top image I is an ideal hexagonal lattice of spheres generated by image analysis software. (b) Radial distribution function calculated for each structure shown in (a), where ap is the particle radius and r is the radial distance from the particle center. (c) Global orientational order parameter, ψ, calculated for each structure shown in (a). (d) Experimentally determined variation of global orientational order parameter, ψ, with respect to χ700. | ||
Using the particle center coordinates, ψ was calculated for each structure, as shown in Fig. 2c. Panels I and II show that the self-assembled array of 320 nm particles is highly ordered, ψ = 0.93, however, defects are present in the long range order. Fig. 2d shows the variation of ψ with respect to χ700. The highest degree of order is seen for monodisperse particles, while χ700 = 0.5 represents the packed structure with the highest degree of disorder among the six structures fabricated in this study.
An important difference between mono and binary packed structures is their pore size distribution. In mono-packed structures, the pore size distribution is very sharp, whereas in binary packed structures, there is a broad pore size distribution, which is strongly dependent on the size ratio of the two particles.29 Assuming that each pore is formed by four adjacent particles in a hexagonal lattice, there are five different possibilities for pore formation in a binary packed structure of small (d) and large (D) particles as illustrated in Fig. 3, taken from Andrade.29 Also shown is the pore size frequency distribution, P, as a function of volume fraction of the larger particle (χD) for a particle size ratio around 0.45. While for mono-packed structures there is only one pore size present, in binary packed structures Fig. 3 shows there can be up to five different pore sizes present, at certain volume fractions (e.g., χD = 0.75).
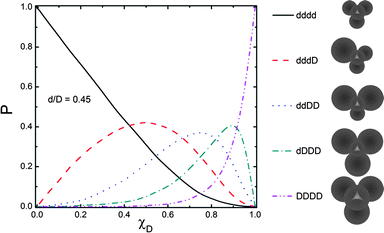 | ||
| Fig. 3 Theoretical probability of the presence of five different pore sizes as a function of the volume fraction of the larger particle, χD, in the binary packing of spheres with size ratio of 0.45 (reprinted from Andrade30 with permission from Elsevier). | ||
DNA separation
The single most important parameter describing the separation mechanism in PFGE is the ratio of the reorientation time (the time it takes the molecule to reorient itself to the direction of the applied field) to the pulse time. The ratio has been called the scaled frequency7,11,21,30 and is defined as; where f is the pulse frequency, L is the molecule length, μ is the DNA electrophoretic mobility, and E is the applied electric field. As stated in the literature, 0.1 ≤ f* ≤ 1 defines a separation regime where the molecule has enough time to completely re-align itself to the applied field during each pulse so the head and tail switching mechanism is the dominant mechanism of separation. This regime is known to provide the best separation resolution in PFGE.31 We chose electric fields, frequency, and DNA size parameters to broadly sample a wide domain in f*, ranging from 0.11 to 1.54, thus covering the full range over which the separation mechanism applies.
In order to study the effect of disorder on DNA separation performance, experiments were conducted in structures with χ700 varying from zero to unity. As seen in Fig. 2d, among the six structures studied, χ700 = 0 and 1 exhibit the highest degree of order while χ700 = 0.5 showed the least degree of order. By evaluating separation performance between χ700 from 0 to 0.5 (ψ = 0.93 to 0.19), and also from 1 to 0.5 (ψ = 0.95 to 0.19), we have two sets of data evaluating the effect of increasing disorder, starting from two significantly different pore sizes of 48 and 105 nm for 320 and 700 nm particles, respectively.
Fluorescence intensity profiles were acquired at various distances from the injection channel, as shown in Fig. 1e and f, from which DNA band positions and band variances were calculated. The separation between band positions, the band broadening or variance, and the resolution between bands characterize separation performance. As illustrated in Fig. 4 to 7, each of these performance parameters varies in a non-monotonic fashion with the crystalline order, with some subtle variations modifying the overall trends. In interpreting the results, several structural parameters illustrated in Fig. 2 and 3 must be considered. Maximum order is observed at χ700 = 0 and 1, with maximum disorder at χ700 = 0.5 among the six structures in this study. The pore sizes increase steadily on going from χ700 = 0 to 1, while the range in pore sizes is maximum at χ700 = 0.75.
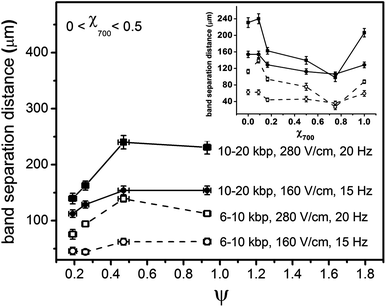 | ||
| Fig. 4 Variation of band separation distance between (open) 6–10 kbp and (filled) 10–20 kbp DNA molecules with respect to ψ for 0 < χ700 < 0.5 for (circles) E1 = 160 V/cm, f = 15 Hz and (squares) E1 = 280 V/cm, f = 20 Hz. The inset shows variation of band separation distance with respect to χ700 between 6–10 kbp and 10–20 kbp DNA molecules (an enlarged figure is provided in Supplementary Information†). | ||
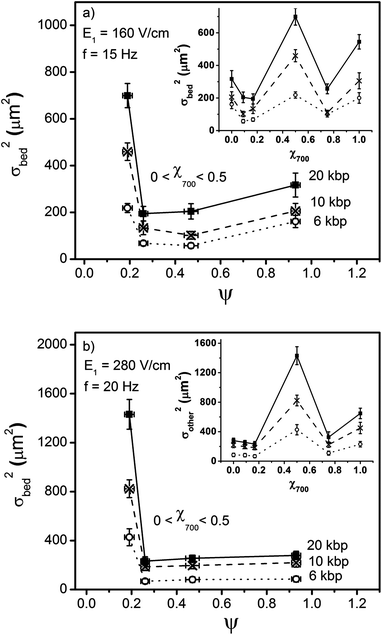 | ||
| Fig. 5 Variation of band broadening, σ2bed, calculated using eqn (2b), for 6, 10, and 20 kbp DNA molecules with respect to ψ for 0 < χ700 < 0.5 for (a) E1 = 160 V/cm, f = 15 Hz and (b) E1 = 280 V/cm, f = 20 Hz. The inset shows variation of σ2bed for 6, 10, and 20 kbp DNA molecules with respect to χ700 (an enlarged figure is provided in Supplementary Information†). | ||
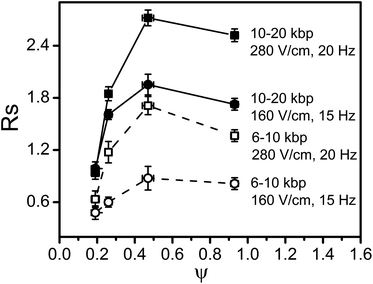 | ||
| Fig. 6 Variation of separation resolution, Rs calculated using Eq. 2, between 6–10 kbp and 10–20 kbp DNA molecules with respect to ψ for 0 < χ700 < 0.5 for E1 = 160 V/cm, f = 15 Hz and E1 = 280 V/cm, f = 20 Hz. | ||
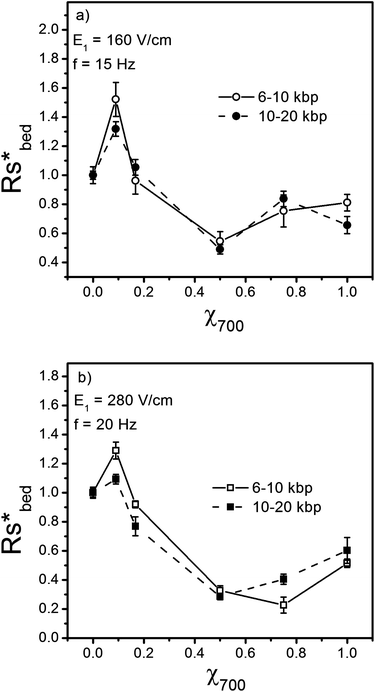 | ||
| Fig. 7 Variation of scaled resolution corrected for band broadening due to injection, Rs*bed = Rsbed/Rs bed,χ700 = 0 with respect to χ700 for (a) E1 = 160 V/cm, f = 15 Hz and (b) E1 = 280 V/cm, f = 20 Hz. | ||
Fig. 4 shows the difference in separation distance of DNA bands with respect to ψ for 0 < χ700< 0.5 for 6–10 kbp and 10–20 kbp at two fields and two frequencies, providing a broad range of f′ values for these molecules (the variation of separation distance with respect to ψ for 0.5 < χ700< 1 is shown in the Supplementary Information†). The frequencies for each electric field were adjusted to maximize the separation. The average values and error bars were determined from three chips prepared at each χ700 value. The inset in this figure shows the variation of band separation distance with respect to χ700. Fig. 4 shows that, as a general trend, increasing the degree of order, ψ, increases the band separation distances between DNA sizes and the effect is more pronounced at higher electric field, when the reorientation time is shorter. The inset figure shows the minimum band separation distance was observed at χ700 = 0.75 for all cases, though the difference relative to χ700 = 0.5 is statistically significant for higher field only. It is noteworthy that the smallest separation distances are seen where the highest pore size distribution is present29 while the maximum separation distance is present at χ700 = 0.1, with ψ = 0.47, rather than at χ700 = 0, where the lattice is maximally ordered.
A comparison between the two structures; χ700 = 0 and 1in the inset figure shows that the band separation distances are almost equal for the two structures regardless of the differences in their pore size. This observation indicates that pore size alone does not introduce changes in separation distances for the DNA sizes studied. The increase in the number of pore sizes in the mixed structures may play a role in the decreased separation distances, as it is notable that the minimum in separation occurs at χ700 = 0.75, where the range of pore sizes is greatest. However, Fig. 2d and 4 make it clear that the order is also greatly decreased in the range where the separation is markedly decreased.
The smaller band separation distance in disordered structures may be explained by the separation mechanism. Due to the backtracking motion inherent in the pulsed field method, the overall distance that the molecule migrates in each cycle becomes strongly dependent on the DNA size. This distance varies linearly with the fully stretched DNA length in ordered structures such as microfabricated arrays.12,30 In disordered structures such as gels, the DNA dynamics is more complicated. The higher collision frequency of DNA molecules with the structure in disordered matrices4,5 results in complicated conformations of DNA, so that the distance travelled by the molecules will no longer be a linear function of DNA size.12
The variance for each DNA stream, σ2total, was calculated at a distance of 2 mm from the injection channel. The variance due to injection, σ2inj, can be calculated using the fluorescence intensity profiles at the injection channel (Fig. 1e), allowing estimation of the variance due to other contributions, σ2bed:32
 | (2a) |
 | (2b) |
Fig. 5 shows the band broadening is highest for χ700 = 0.5, the structure studied with the maximum degree of disorder. The inset in Fig. 5 shows that the observed band broadening, or variance, of the DNA bands exhibits a mirror image response to the volume fraction (and hence order) compared to the band separation distances. Local minima, with similar values of band broadening are seen for χ700 = 0.25 and χ700 = 0.75. Although the band broadening is not equal for the two highly ordered structures of χ700 = 0 and 1, the similar behaviour of band broadening on changing χ700 from 0 to 0.5 and changing χ700 from 1 to 0.5 shows that band broadening is greatly affected by strong disorder in the pore structure (as seen in inset), and that this effect is at least as large as the effect of different pore sizes on variance in binary packed structures.
The non-monotonic behavior of variance around χ700 = 0.1 and 0.75 is not understood, however it is consistent with Doyle5 and Slater's6 calculations, that show some form of non-monotonic response of DNA to order. Hickey and Slater6 predicted by Monte Carlo simulations that DNA diffusion coefficients in an array of obstacles show non-monotonic behavior. They suggested that increasing order favoured reptation, while decreasing order favoured entropic trapping, and that these two models of molecular behaviour exhibited diffusion coefficients with opposite dependence on order. In electromigration of DNA, diffusion is a minor contributor to band broadening, with other molecular dynamics playing a larger role.33–36 By analogy, increasing order will increase reptation-like motion and decrease hooking, entanglement, hernia formation, and entropic trapping, while decreasing order will increase the latter effects. The net result will be a competition between band broadening effects that could also lead to non-monotonic behavior. It should be noted that χ700 = 0.1, where we observe a minimum in band broadening, corresponds to a condition of short range, local order, with longer range disorder. Mohan and Doyle5 have modeled DNA separation in sparse magnetic particle arrays in which a different separation mechanism is operative. They concluded that a non-monotonic dependence on order should arise, with short range order providing the best separation. Given the difference in separation mechanism in our experimental study versus these theoretical analyses, it is hard to compare the two results, however, our report is consistent in identifying a non-monotonic dependence.
Separation resolution is a key performance parameter, and is defined as the quotient of the band separation distance over the average standard deviation (square root of band broadening) for two consecutive DNA bands; effectively convoluting the data in Fig. 4 and 5.
 | (3) |
The injection band broadening width contributes significantly to the observed resolution in Fig. 6. Using Eq. 2 to isolate σ2bed, then substituting these corrected values into eqn (3) allows evaluation of the resolution arising solely from the separation bed. Fig. 7 shows the variation of the scaled “bed-resolution”, Rs*bed = Rsbed/Rsbed,x700 = 0, with respect to χ700, illustrating the variation of separation resolution with the degree of disorder is more pronounced for larger electric fields and longer DNA molecules. For a field of 280 V/cm, the separation resolution between 10 and 20 kbp DNA molecules in a structure with χ700 = 0.5 drops to around one third of the resolution in ordered structures with χ700 = 0. This is particularly important, since most of the new DNA separation devices perform in strong electric fields to accelerate the separation process.
A comparison between the resolution for ordered (χ700 = 0 and 1) and highly disordered (χ700 = 0.5) arrays shows that regardless of the pore size (∼ 50 nm for χ700 = 0 and 105 nm for χ700 = 1), the resolution in ordered structures is higher compared to disordered structures. However, the change in resolution is not symmetric around χ700 = 0.5. This may be caused by the asymmetric pore size distribution around χ700 = 0.5. Between χ700 = 0 to 0.5, pore sizes introduced to the structure are all larger than the initial pore size (dddd ∼ 50 nm). Between χ700 = 1 to 0.5, the pore sizes introduced to the structure are all smaller than the initial pore size (DDDD ∼ 105 nm). As stated in the literature,7,15 and shown in Fig. 7, for this range of DNA sizes, separation resolution decreases by increasing the pore size. By changing the structure from χ700 = 0 to χ700 = 0.5, both the greater disorder and greater pore sizes could contribute to decreasing the separation resolution. On doping the structure from χ700 = 1 to χ700 = 0.5, the pore sizes decrease while the order decreases too. The observations show that the effect of order must dominate, since the resolution decreases with increasing disorder, overcoming the effect of decreasing pore size on separation resolution.
The separation resolution Rs, is shown in Fig. 7 as a function of the degree of order, ψ, for χ700 = 0 to 0.5. Fig. 7 shows the separation resolution increases significantly as the order increases. On the other hand, comparing ψ = 0.47 and ψ = 0.93 shows that small scale, scattered defects or disorder have either no significant or sometimes even positive effects on separation resolution, so long as the local order in the structure is preserved. Once the degree of disorder is increased such that the local order of the structure is affected, the separation resolution decreases significantly.
A look at Fig. 4 to 6 shows that by moving from an ordered structure, either χ700 = 0 or χ700 = 1, to disordered structures, all the separation indictors; the band separation distance, the band broadening, and the resolution exhibit a similar variation with χ700. Considering the different pore sizes in the two ordered structures (χ700 = 0 and 1), the general trends show that increasing the degree of order in the structures makes a significant contribution to the differences in the separation performance.
Conclusions
Our results clearly demonstrate that extended range order within a nanoporous matrix has a significant effect on the separation performance parameters for DNA. Further, doping self-assembled colloids of monodisperse particles with a different sized particle provides a powerful and readily controllable tool for exploring the role of order, by allowing the ready fabrication of nanoporous arrays with varying degrees of order. In general, microfabrication and nanolithography, as well as colloidal self-assembly offer a unique opportunity to examine the impact of coherent, reproducible separation processes. This feature stands in contrast to the random structures that are in common use today in separation science. Already, unique ratchet effects and methods such as entropic trapping, that would not be available in random gel-based matrices, have been demonstrated in lithography fabricated devices. The work presented here illustrates that there is a potentially even richer impact on performance in separation science, arising from the ability to create ordered separation matrices in microfluidic devices.The separation mechanism employed in this work relies on highly stretched DNA and on well-defined transport pathways for DNA. In contrast, the mechanisms modeled to date, in terms of the impact of order of the porous structure, rely upon hooking, hernias, and specific collisions and interactions with the separation matrix, which are enhanced by disorder. This difference in mechanism may account for the disagreement between our observations that an ordered matrix is up to 3 times more efficient than a disordered matrix, while the modeling work predicts separation performance will be better in a disordered matrix compared to a fully ordered matrix in sparse array devices. Of greater importance though, is the conclusion of both experiment and theory that the degree of order does impact the separation efficiency, and that short range order does appear to offer somewhat better efficiency than complete order. Our results show that controlling the order with a separation matrix should provide a fruitful means to improve separation performance.
Acknowledgements
The authors thank the Natural Sciences and Engineering Research Council of Canada (NSERC), the Alberta Innovates Technology Futures, the National Institute for Nanotechnology (NINT) for their financial support, and the University of Alberta for support of NanoFab. For SEM images, we thank Daniel Salamon and Mohsen Danaie.References
- N. Kaji, Y. Tezuka, Y. Takamura, M. Ueda, T. Nishimoto, H. Nakanishi, Y. Horiike and Y. Baba, Anal. Chem., 2004, 76, 15–22 CrossRef CAS.
- M. M. Chui, R. J. Phillips and M. J. McCarthy, J. Colloid Interface Sci., 1995, 174, 336–344 CrossRef CAS.
- N. Pernodet, M. Maaloum and B. Tinland, Electrophoresis, 1997, 18, 55–58 CrossRef CAS.
- P. D. Patel and E. S. G. Shaqfeh, J. Chem. Phys., 2003, 118, 2941–2951 CrossRef CAS.
- A. Mohan and P. S. Doyle, Phys, Rev. E, 2007, 76 Search PubMed.
- O. A. Hickey and G. W. Slater, Phys. Lett. A, 2007, 364, 448–452 CrossRef CAS.
- J. L. Viovy, Rev. Mod. Phys., 2000, 72, 813–872 CrossRef CAS.
- D. C. Schwartz and C. R. Cantor, Cell, 1984, 37, 67–75 CrossRef CAS.
- K. Gunderson and G. Chu, Mol. Cell. Biol., 1991, 11, 3348–3354 CAS.
- W. D. Volkmuth and R. H. Austin, Nature, 1992, 358, 600–602 CrossRef CAS.
- C. Bustamante, S. Gurrieri and S. B. Smith, Trends Biotechnol., 1993, 11, 23–30 CrossRef CAS.
- T. A. J. Duke, R. H. Austin, E. C. Cox and S. S. Chan, Electrophoresis, 1996, 17, 1075–1079 CrossRef CAS.
- W. D. Volkmuth, T. Duke, M. C. Wu, R. H. Austin and A. Szabo, Phys. Rev. Lett., 1994, 72, 2117–2120 CrossRef CAS.
- Y. Zeng and D. J. Harrison, Anal. Chem., 2007, 79, 2289–2295 CrossRef CAS.
- Y. Zeng, M. He and D. J. Harrison, Angew. Chem., Int. Ed., 2008, 47, 6388–6391 CrossRef CAS.
- H. Zhang and M. J. Wirth, Anal. Chem., 2005, 77, 1237–1242 CrossRef CAS.
- J. Park, D. Lee, W. Kim, S. Horiike, T. Nishimoto, S. H. Lee and C. H. Ahn, Anal. Chem., 2007, 79, 3214–3219 CrossRef CAS.
- N. Minc, C. Futterer, K. Dorfman, A. Bancaud, C. Gosse, C. Goubault and J. L. Viovy, Anal. Chem., 2004, 76, 3770–3776 CrossRef CAS.
- K. D. Dorfman, Phys. Rev. E: Stat., Nonlinear, Soft Matter Phys., 2008, 77 CrossRef CAS.
- J. Ou, J. Cho, D. W. Olson and K. D. Dorfman, Phys. Rev. E: Stat., Nonlinear, Soft Matter Phys., 2009, 79 CrossRef CAS.
- N. Nazemifard, S. Bhattacharjee, J. H. Masliyah and D. J. Harrison, Angew. Chem., Int. Edn., 2010, 49, 3326–3329 CAS.
- R. P. Dias, J. A. Teixeira, M. G. Mota and A. I. Yelshin, Ind. Eng. Chem. Res., 2004, 43, 7912–7919 CrossRef CAS.
- R. Dias, J. A. Teixeira, M. Mota and A. Yelshin, Sep. Purif. Technol., 2006, 51, 180–184 CrossRef CAS.
- M. Song, K. T. Chuang and K. Nandakumar, Ind. Eng. Chem. Res., 1998, 37, 3490–3496 CrossRef CAS.
- T. Aste, J. Phys.: Condens. Matter, 2005, 17, S2361–S2390 CrossRef CAS.
- M. A. Bevan, J. A. Lewis, P. V. Braun and P. Wiltzius, Langmuir, 2004, 20, 7045–7052 CrossRef CAS.
- A. S. Clarke and H. Jonsson, Phys. Rev. E: Stat. Phys., Plasmas, Fluids, Relat. Interdiscip. Top., 1993, 47, 3975–3984 CrossRef CAS.
- B. I. Halperin and D. R. Nelson, Phys. Rev. Lett., 1978, 41, 121–124 CrossRef CAS.
- J. S. Andrade, Phys. A, 1993, 199, 431–444 CrossRef.
- S. Gurrieri, S. B. Smith, K. S. Wells, I. D. Johnson and C. Bustamante, Nucleic Acids Res., 1996, 24, 4759–4767 CrossRef CAS.
- G. Chu, Proc. Natl. Acad. Sci. U. S. A., 1991, 88, 11071–11075 CrossRef CAS.
- C. A. Lucy, L. L. M. Glavina and F. F. Cantwell, J. Chem. Educ., 1995, 72, 367–374 CrossRef CAS.
- J. F. Mercier and G. W. Slater, Electrophoresis, 2006, 27, 1453–1461 CrossRef CAS.
- B. Tinland, N. Pernodet and A. Pluen, Biopolymers, 1998, 46, 201–214 CrossRef CAS.
- L. Meistermann and B. Tinland, Phys. Rev. E: Stat. Phys., Plasmas, Fluids, Relat. Interdiscip. Top., 1998, 58, 4801–4806 CrossRef CAS.
- S. Popelka, Z. Kabatek, J. L. Viovy and B. Gas, J. Chromatogr., A, 1999, 838, 45–53 CrossRef CAS.
Footnote |
| † Electronic supplementary information (ESI) available. See DOI: 10.1039/c1lc20855a |
| This journal is © The Royal Society of Chemistry 2012 |
