Flexible microfluidic cloth-based analytical devices using a low-cost wax patterning technique†
Azadeh
Nilghaz
ab,
Dedy H. B.
Wicaksono
*a,
Dwi
Gustiono
c,
Fadzilah Adibah
Abdul Majid
d,
Eko
Supriyanto
b and
Mohammed Rafiq
Abdul Kadir
a
aMedical Device and Implant Technology Group (Mediteg), Dept. of Biomechanics and Biomedical Materials, Faculty of Health Science and Biomedical Engineering, Universiti Teknologi Malaysia, 81310, Johor, Malaysia. E-mail: dedy.wicaksono@biomedical.utm.my; Tel: +60 755-36494
bDept. of Clinical Science and Engineering, Faculty of Health Science and Biomedical Engineering, Universiti Teknologi Malaysia, 81310, Johor, Malaysia
cIbnu Sina Institute for Fundamental Science, Universiti Teknologi Malaysia, 81310, Johor, Malaysia
dDept. of Bioprocess Engineering, Faculty of Chemical Engineering, Universiti Teknologi Malaysia, 81310, Johor, Malaysia
First published on 17th November 2011
Abstract
This paper describes the fabrication of microfluidic cloth-based analytical devices (μCADs) using a simple wax patterning method on cotton cloth for performing colorimetric bioassays. Commercial cotton cloth fabric is proposed as a new inexpensive, lightweight, and flexible platform for fabricating two- (2D) and three-dimensional (3D) microfluidic systems. We demonstrated that the wicking property of the cotton microfluidic channel can be improved by scouring in soda ash (Na2CO3) solution which will remove the natural surface wax and expose the underlying texture of the cellulose fiber. After this treatment, we fabricated narrow hydrophilic channels with hydrophobic barriers made from patterned wax to define the 2D microfluidic devices. The designed pattern is carved on wax-impregnated paper, and subsequently transferred to attached cotton cloth by heat treatment. To further obtain 3D microfluidic devices having multiple layers of pattern, a single layer of wax patterned cloth can be folded along a predefined folding line and subsequently pressed using mechanical force. All the fabrication steps are simple and low cost since no special equipment is required. Diagnostic application of cloth-based devices is shown by the development of simple devices that wick and distribute microvolumes of simulated body fluids along the hydrophilic channels into reaction zones to react with analytical reagents. Colorimetric detection of bovine serum albumin (BSA) in artificial urine is carried out by direct visual observation of bromophenol blue (BPB) colour change in the reaction zones. Finally, we show the flexibility of the novel microfluidic platform by conducting a similar reaction in a bent pinned μCAD.
Introduction
Microfluidic systems have been widely recognized as a new emerging technology for the development of microanalytical systems, especially for bioassays.1,2 Microfluidic systems exploit the properties of liquid having low Reynolds number, such as laminar flow and diffusion-induced mixing.1,3,4 Such systems usually can be identified as having one dimension of the channel less than 1 mm down to only tens of micrometres.4–6 Most of the microfluidic devices are made using materials such as silicon7 and glass,8 and polymers like PMMA,9 SU-8,10 and PDMS.11,12 The technology used to fabricate these devices usually borrows to some extent from the standard technology of silicon-based microelectronics/microfabrication, such as photolithography and etching.13 In polymer-based microfluidics, the dependence on microelectronics fabrication facilities is reduced by the use of the soft lithography technique.14–16 Besides the complexity of the fabrication technology, microfluidic systems made from the materials mentioned above usually also necessitate the availability of separate pumping systems.17 All these factors contribute to its high cost of development and operation, thus limiting its wide use in our society.Microfluidic systems intended for new applications such as early diagnosis in remote underdeveloped areas, or home-based patient monitoring systems need to be low cost, portable and easy to use. Recently, inexpensive two- (2D) and three-dimensional (3D) microfluidic systems have been made from patterned paper,18,19 the so-called microfluidic Paper-based Analytical Devices (μPADs), as well as from hydrophilic threads.20,21 These devices are intended, among others, to be a new diagnostic platform for innovative developing countries. The working principle of these structures is based on the use of capillary force to wick and distribute fluid into hydrophilic channels without external pressure or control systems. Three-dimensional devices of these types have been fabricated by stacking layers of patterned paper and tape,18 or by sewing threads into hydrophobic substrates.20 These methods, however, still have some inherent difficulties to be used for mass production of the devices, as well as for determining the exact detection zones in the case of thread-based devices.20 The Whitesides group has proposed the use of the wax printing technique as a cheaper way of mass producing μPADs.22 Yet, this technique requires the use of a special type of wax printer that even though is commercially available, may not be easily found in many of the developing countries. Most recently, silk was used by Dendukuri et al. to define a fabric-based platform for diagnostic assays.23 However, silk cloth is usually expensive to be used as a disposable substrate for microfluidic devices.
In this paper, we establish a simple and inexpensive method for designing and fabricating microfluidic devices based on hydrophilic cotton cloth. The cloth-based microfluidic devices (CMDs) use microvolumes of aqueous samples to carry out analysis in the reaction zones, where the detecting reagents are immobilized. Herein, cotton cloth fabric has been utilized as the hydrophilic platform due to its weave interstitial porosity/spaces even in the absence of any pretreatment. We scoured the cotton fabrics using sodium hydroxide (NaOH) and anhydrous sodium carbonate (Na2CO3) solutions in Millipore-purified water to modify its wetting and wicking properties.24–26 We show that this can be achieved by both of the mentioned solutions. The scoured cotton cloth is then employed to fabricate microfluidic systems using a simple wax patterning technique. Wax is used to form hydrophobic barriers22,27,28 and define microfluidic channels in cotton cloth. This technique is inspired from an ancient textile processing technique of using a hot wax resist to protect parts of the fabric to remain free from the dye, a process known as batik throughout South East Asia (especially Indonesia and Malaysia), India and East Asia.29 The wax can be drawn onto the cloth directly by hand using a special batik pen called canting/tjanting, as normally done by professional batik hand crafters.29 In our case, however, we use computer-aided design to firstly print the delicate pattern on paper, easily. The wax is then impregnated into the patterned paper, and subsequently transferred into cloth by heat treatment. In this way, it is easy to build prototypes of CMDs having small width channels, even by a novice microfluidic designer.
To demonstrate the potential use of CMDs as a platform for simple diagnostic assays, we fabricate microfluidic cloth-based analytical devices (μCADs) to perform the colorimetric assay of protein, i.e. Bovine Serum Albumin (BSA), in artificial urine. Similar to previous works by other authors, the result would demonstrate the potential benefit of μCADs as low-cost, portable and simple assays for remote areas as well as for home health monitoring systems.
We further show that a μCAD is a flexible platform for performing a microfluidic bioassay. A simple 2D device consisting of a sample zone, a hydrophilic channel, and a reaction zone is fabricated. The device is pinned at its four corners in a bent condition to investigate if the analyte can still flow along the channel into the reaction zone. We demonstrated that observable colour change can still occur at the reaction zone, despite the bending. The flexibility of μCADs is a new important feature that will make it possible to develop a new class of microfluidic devices that is embeddable and can be incorporated into daily textile products that are in direct contact with a human subject.
Materials and methods
Scouring treatment
White plain weave cotton cloth fabrics (Mirota Batik, Surabaya, Indonesia, unmercerized, bleached, having 126 denier, or 14 mg m−1 and a fabric count of 95 × 95, with a mass density of 9.3 mg cm−2, and 160 fibers per inch) were used as the main raw material for this experiment and other experiments reported in this paper. The cloth was cut into small pieces as samples for different scouring treatments conducted in this experiment. In this scouring treatment, the cotton cloth is boiled for 5 minutes at ∼100 °C temperature in solutions prepared in Millipore purified water. The first treatment uses 10 mg ml−1sodium hydroxide (NaOH, Sigma Aldrich, USA), while another set of cloth samples were treated using 10 mg ml−1 anhydrous sodium carbonate (Na2CO3, Sigma Aldrich, USA), popularly known as soda ash. After each treatment, the cloth samples were washed with plenty of water until the pH was reverted to the neutral range (pH ∼6). Finally, the samples were dried at ambient temperature (T ≈ 25 °C) for 2 hours before being used for testing. Some other samples which were similarly prepared using these treatments were imaged and investigated using optical light microscopy, scanning electron microscopy (SEM), energy-dispersive electron spectroscopy (EDS), and X-ray photoelectron spectroscopy (XPS) to understand the structure and changes in chemical elements composition.Wicking property test
We tested the wicking rates of three types of cotton cloth samples: the first one is the originally purchased cotton fabrics used without any surface treatment; the second type of samples is the NaOH-treated cotton cloth; while the third class of samples is the Na2CO3-treated cotton cloth. After the treatments, a hydrophilic channel having 1 mm width is fabricated in each class of the samples in the warp way, using a wax hydrophobic barrier according to the procedure that will be explained in the next section on fabrication of cloth-based microfluidic devices using wax patterning.Blue dye solution was prepared to characterize the wicking property of the untreated and treated cotton cloth. The wicking property was assessed by measuring the initial wicking rate and the capillary rise in the channels of each sample class. The hydrophilic channels were placed either horizontally or vertically. The liquid dye is dropped onto one end of the horizontally placed channel; while for the vertically placed channel, its lower end is dipped into the liquid dye. The wicking height of the blue dye is measured using a ruler that was assembled next to the hydrophilic channels. Measurements for each class of the samples were repeated 5 times, and were recorded using a digital camera for visual appraisal. This procedure for wicking property measurement is carried out according to the procedure described in ref. 20 and 30.
Structural imaging and characterization
To better understand how hydrophobicity or hydrophilicity as well as wicking property are influenced by both the structure and the composition of the cotton cloth, we conducted microscopy imaging and spectroscopy on the untreated and treated samples. For each class of the samples, we carried out the investigation on two regions of the samples: the wax hydrophobic barrier region and the cotton hydrophilic channel region.Light optical microscopy was carried out using a Labomed CXR3 where the results are captured and stored in the computer using a pre-installed digital camera. Scanning electron microscopy (SEM) imaging was carried out on the different samples at the two regions mentioned above, using a Low-Vacuum SEM JEOL JSM-6390.
To understand how the chemical surface treatment changes the chemical composition of the cotton cloth surface, we conducted Energy-Dispersive Electron Spectroscopy/EDS (Oxford INCA EDX) attached to a FESEM JEOL JSM-7600F on the different regions of each class of the samples, i.e. on the unwaxed regions (Fig. S7 of the ESI†), and on the waxed regions (Fig. S8 of the ESI†). An EDS analysis was also conducted using a Hitachi Tabletop SEM TM3000. XPS analysis using a Kratos AXIS Ultra DLD Photoelectron Spectrometer was carried out to understand the change in chemical bonding states of the different samples.
Finally, to investigate the wicking mechanism on the submicron structure of the cotton fabrics, 2 μl of silver (Ag) ink (Sigma Aldrich, USA) is dropped onto bare cotton cloth samples, for the untreated and treated cotton fabric samples. The samples were then imaged under a Cold Field Emission SEM (FESEM) Hitachi SU-8000 using its low-angle backscattered electron (LA-BE) imaging mode to have a good contrast between Ag which has high atomic number (Z) and the cotton fibers, which are mainly formed from C and O atoms having low Z number. We also carried out wicking mechanism investigation at the single fiber level from each class of the samples using a Leica DM2500 M Optical Microscope.
Fabrication of cloth-based microfluidic devices (CMDs) using wax patterning
Wax, commonly used for batik craft, was purchased from Jadi Batek Gallery, Kuala Lumpur, Malaysia, and used as received without further modifications. The Na2CO3-scoured cotton cloth was used for all CMD fabrication experiments, except for the wicking property test, where we also used untreated cotton cloth and NaOH-scoured cotton cloth. Patterns of hydrophilic channels were designed in a computer using AutoCAD design software (Autodesk, CA) and printed onto papers (Fig. 1(A)). The paper is then dipped into melted wax inside a small Slow Cooker Jar PSC-82 (Pensonic, Malaysia). Afterwards, it was allowed to dry for a few minutes at room temperature (25 °C). The result is a wax-impregnated paper, as shown in Fig. 1(B). The paper part which has a hydrophilic pattern on it was punched/cut out using a handheld cutter blade (Fig. 1(C)). Alternatively, other more automatic cutting machines can also be used. This wax-impregnated paper, whose typical result is shown in Fig. 1(I), which has the hydrophilic holes already is then fixed onto a cotton cloth using a few pins (Fig. 1(D)). The wax is then remelted by using heat treatment. In our case, we have used a soldering iron set at 150 °C operating temperature (Fig. 1(E)). Other heat treatment devices, such as a hot plate or an oven may also be used. The melted wax will spread into the surface and thickness of the cloth. This process is intended to make the hydrophobic regions within the hydrophilic cloth substrate, and to define the fluid reservoirs as well as the test zones.31 After removing the paper ‘mask’ from the cloth (Fig. 1(F)), the patterned cloth is now ready to use as a 2D cloth-based microfluidic device (CMD) (Fig. 1(A–F)).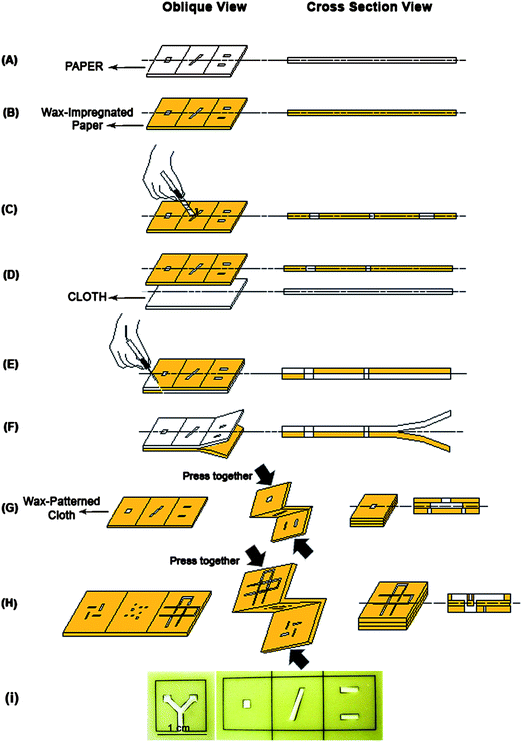 | ||
| Fig. 1 Schematic illustration of the CMD fabrication process made from (folded layer of) wax-patterned cloth. The printed paper (A) is immersed in the hot wax to suck it up (B). The hydrophilic parts are punched out from the paper (C). This wax-impregnated paper (for making the hydrophobic parts) is fixed on the cloth (D) to transfer the wax from paper to cloth by heat treatment (E). After wax transfer to cloth, the paper is removed from the cloth (F), resulting in a 2D CMD. To fabricate a 3D CMD, the single layer of cloth containing design hydrophilic patterns of different 3D layers is further folded using a small amount of glue along the fold line, and then pressed mechanically. Sample inlet and reaction zones are defined in top and bottom layers, respectively (G). 3D CMDs can be fabricated to distribute microvolumes of samples into different streams of hydrophilic channels and cross each other without mixing (H) (experiment adapted from ref. 18). In (I), pictures of wax-impregnated paper are shown for 2D and 3D microfluidic devices. | ||
In the next experiment, we fabricated 3D CMDs by patterning the hydrophilic channel design of all the 3D layers within one single layer of the cloth according to the process steps of fabricating a 2D CMD, as explained previously. Folding line patterns indicating the boundaries between these 3D layers were also patterned. After transferring the patterned wax from paper to the cloth, the waxed cloth is then folded along these folding lines to develop the layers that will make the 3D CMD. A small amount of commercially available multipurpose adhesive (UHU, Malaysia) was used to stick the different waxed cloth layers to each other. They were then pressed mechanically (manually applied) for ensuring tight encapsulation. Hence, a reliable contact between different layers of cloth can be ensured. This whole procedure of making a 3D CMD is illustrated in Fig. 1(G and H).
To demonstrate the functional operation of these 2D CMDs, we designed a six-branched star-like hydrophilic channel pattern onto the cloth. The tip ends of each branch are designed to be the reaction/test zones, while the middle part of the star is designed to be the inlet zone for an analyte. A small volume of blue ink (∼1 μl) was spotted into the six reaction zones. Then yellow ink was dropped at the inlet point such that it fills in all the six branches of the hydrophilic channels. Mixing reaction between the yellow ink ‘analyte’ and the blue ink ‘reagent’ is to be observed at the six reaction zones.
Similar to the 2D CMD, we also demonstrate the functional operation of a 3D CMD by designing two 3D CMDs for performing simple liquid mixing and channeling between different layers of patterned cotton cloth. The design of the first 3D CMD is illustrated in Fig. 1(G). The top layer of this 3D CMD acts as the inlet zone where the analyte is inserted into the CMD. The middle layer of the CMD acts as a branching channel, where the inserted analyte liquid would flow into the two reaction zones at the third bottom layer. Initially, before folding, a few microlitre volume of blue ink representing the reagent is dropped into the two reaction zones. The cotton cloth is then folded along the folding lines to develop the three-layer CMD. Yellow ink representing an analyte is dropped into the inlet zone of the first top layer. The colorimetric reaction results will be observed at the bottom layer.
In the second 3D CMD whose design is illustrated in Fig. 1(H), two intertwining yet not intersecting channels are used to control the flow of two different inks. The purpose of this experiment is to prove that 3D cloth-based CMDs can be used to control the flow of multiple liquids using its different layers, as previously demonstrated for 3D μPAD in ref. 18. The liquid in one channel is ‘crossing’ the liquid in the other channel by the connecting channel on the third layer. The connecting channel on the third layer is connected from that of the first layer by connecting holes patterned on the second middle layer. Two different inks, blue and yellow coloured inks, were dropped into the two different channels of the first layer.
To prove the concept of microfluidic cloth-based analytical devices (μCADs), we carried out a colorimetric protein assay in simulated body fluid using 2D and 3D CMDs. The 2D CMD was designed as a Y-branch device, with the detecting reagent immobilised in the two reaction zones. The 3D CMD was designed similar to the design of Fig. 1(G). To detect protein, we spotted the reagent solution, containing 250 mM citric buffer (pH 2) and 3.3 mM bromophenol blue (BPB) in 95% ethanol, into the detection zones.18,20,32 The reagents were further dried in ambient air for 20 minutes. An unknown amount of Bovine Serum Albumin (BSA) was added to artificial urine to simulate a body analyte. The artificial urine was prepared according to the protocol reported by Chutipongtanate and Thongboonkerd.33 The artificial urine contains 200 mM urea, 1 mM uric acid, 4 mM creatinine, 5 mM sodium citrate, 54 mM sodium chloride, 30 mM potassium chloride, 15 mM ammonium chloride, 3 mM calcium chloride, 2 mM magnesium sulfate, 2 mM sodium bicarbonate, 0.1 mM sodium oxalate, 9 mM sodium sulfate, 3.6 mM sodium dihydrogen phosphate and 0.4 mM disodium hydrogen phosphate, all mixed in Millipore-purified water. The pH of the solution was adjusted to 6.0 by the addition of 1.0 M hydrochloric acid.33 All the inorganic reagents were purchased from Sigma Aldrich, USA. The BSA-containing artificial urine is dropped into the inlet zone. As a control experiment, we also dropped an artificial urine liquid without the BSA into the inlet zones of different CMDs.
Finally, to show that μCADs are a flexible platform for conducting bioassays, a channel having 1 mm width and 25 mm length is patterned in a 2D CMD having 20 mm width and 30 mm length. The CMD is bent and pinned at its four corners using pin needles. At one end of the channel, 0.3 μl of 3.3 mM BPB is spotted, while we dropped the analyte liquid, i.e. the BSA-containing artificial urine, at the other end of the channel.
Results and discussion
Wicking property change due to scouring treatment
The surface of natural cotton fibers, like a normal plant cuticle, is usually covered with wax.34,35 Most wax consists of long fatty acid chains36,37 which makes the cotton fibers hydrophobic, reducing its liquid wicking property. Previous groups of researchers used hydrophilized cotton threads as a versatile matrix for defining inexpensive microfluidic devices.20,21 In our case, presented in this paper, even without any treatment, a natural cotton cloth is hydrophilic and wettable by fluids through its weave porosity structure, i.e. through the interstitial spaces between its woven threads and between the fibers in a single thread, by utilizing capillary force. To increase this wicking property even further, we scoured the cotton cloth to remove its remaining noncellulosic impurities (e.g. surface wax, pectin, etc.) and to increase its wettabililty without having to use special expensive laboratory equipments, such as plasma oxidation21 or laser treatment,38 as previously used by other researchers. Here, we examined the effect of NaOH and Na2CO3 treatment on the initial wicking properties and capillary rise in cloth-based narrow microfluidic channels. Both types of scouring treatments are expected to remove the covering wax, and expose the underlying cellulose fibrous structure, which is rich in –OH (hydroxyl) groups.24,26,35 Thus, the surface chemistry of the initially untreated cotton is changed, while at the same time the texture and roughness of the cotton fiber surface are also changed. Chemically, NaOH and Na2CO3 are expected to attack the aliphatic chains of the wax on the surface of cotton by hydrolysis and oxidation. The new carbon compounds from the split fatty acids will aid scouring and emulsification of other insoluble impurities from the fiber, leading to water soluble products that can be removed during subsequent washing steps.35,39,40In the wicking property test, we observed that the interstitial spaces of the weave porosity of the cloth are by themselves sufficient as a capillary structure that allows rapid wicking through the 1 mm wide microfluidic channels, even without any prior scouring treatment. However, we did observe some differences between the wicking behaviors of treated and untreated cloths, as can be seen in Fig. 2 and Table 1. In this experiment, the tip of the hydrophilic channel (1 mm in width and 10 mm in length) was submerged into a solution of blue ink for the vertical wicking experiment. While in the horizontal/lateral wicking experiment, 1.5 μl dye solution was dropped onto one end of the hydrophilic channel. This test examined the initial wicking height and capillary rise in the cloth channels and demonstrates faster fluidic channels in the scoured cloths. Table 1 shows the average of initial horizontal and vertical wicking height in the hydrophilic channels. HIWH and HIWV are the average height of initial horizontal and vertical wicking, respectively, that are recorded after 500 ms. The maximum difference in the average of wicking height (horizontal and vertical) between the differently treated fabrics is 4.75 and 3.05 mm, respectively. In addition to that, the average and deviation values of wicking height are recorded as a function of time (0–250 s) wherein obvious significant improvement of wicking property in the treated cotton channels (Fig. 2) is observed. Both chemical scouring treatments are inexpensive and quick methods for promoting hydrophilicities of the cotton fabrics. However, the Na2CO3-scoured cloth was chosen as the substrate material to fabricate two- and three-dimensional CMDs in most of the later experiments, unless otherwise noted. This is because this type of treatment is safe and error-tolerant (pH will still be the same even if it is used half or twice as much as it should be).41NaOH on the other hand is a hazardous chemical that may cause various health problems if not used properly by trained specialists.42
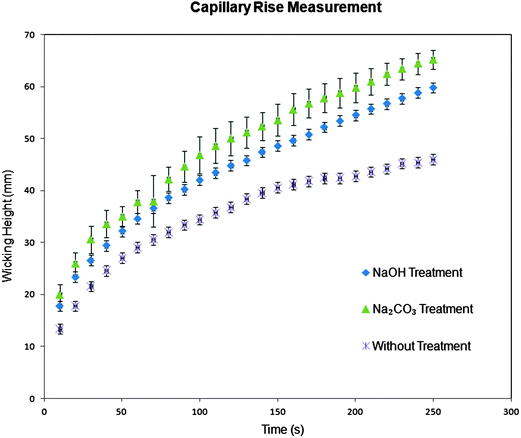 | ||
| Fig. 2 Capillary rise measurement of three textile platform materials: before and after scouring treatment with NaOH and Na2CO3. Wicking height in the cotton channels is recorded as a function of time (0–250 s). | ||
| Treatment | H IWH/mm | H IWV/mm |
|---|---|---|
| NaOH | 6.85 ± 0.15 | 5.2 ± 0.2 |
| Na2CO3 | 7.5 ± 0.25 | 5.25 ± 0.2 |
| Without treatment | 2.75 ± 0.25 | 2.2 ± 0.2 |
The increased wicking in the treated cotton cloth channels is due to both chemical compositional and physical structural changes of the cotton fiber surface. The changes in these two factors have increased the wettability, which is a prerequisite for the increased wicking. Kissa stated in ref. 43 that the wettability of fibers depends on the chemical nature of the fiber surface and the fiber geometry, especially the surface roughness. The surface chemical composition change is observed in the result of energy-dispersive electron spectroscopy (EDS) that we carried out, as shown in Fig. S7† and listed in Table S1 of the ESI†. NaOH treatment causes an increase in the oxygen to carbon atomic content ratio (O/C) of the fabrics surface. However, surprisingly, the O/C ratio of the Na2CO3-scoured fabrics decreases, even though increased wicking is observed in this sample. The same trend is also obtained as we repeated the EDS on a different machine, as listed in Table S2 of the ESI†. The EDS technique can only determine the atomic element ratio of the sample semiquantitatively. Furthermore, this technique probes 100–1000 nm into the samples. Thus, the obtained O/C ratio from EDS may not represent the true surface chemistry affecting the fiber's increased wettability. We then also characterized the samples using X-ray photoelectron spectroscopy (XPS) whose sampling depth is approximately 10 nm. This makes the XPS technique really sensitive to the surface region. The XPS spectra results from the three different samples are shown in Fig. S9(A–C)†. Fig. S9† especially shows the high resolution C 1s peak region of the XPS spectra. The relative concentration of the different C binding states is listed in Table S4†. As expected, in both the scoured samples, the long aliphatic chain of fatty acids in the wax is split and removed, as shown in the reduced C1 peaks (binding energy 285 eV) from 44.47% of the untreated cotton to 26.85% and 28.12% of NaOH- and Na2CO3-scoured cotton, respectively (Fig. S9 and Table S4 of the ESI†). The underlying cellulose fiber is now exposed, as proven by the increased C2 peaks (binding energy 286.7 eV, related to the –OH group) to 57.13% and 54.68% for the NaOH- and Na2CO3-scoured cotton, respectively. However, as the wax is removed, and only the irremovable impurities remain, the CO32− (carbonate ion) may oxidize further the exposed cellulose, introducing a surface carbonyl (C![[double bond, length as m-dash]](https://www.rsc.org/images/entities/char_e001.gif) O) group in addition to the existing O–C–O component of the cellulose.35 This results in the increased C3 peak (binding energy 288.2 eV) of the XPS spectrum in Na2CO3-scoured cotton (Fig. S9(C) and Table S4†). This increasing C3 peak resulting from Na2CO3 scouring similarly happened to cotton treated by bleaching, as reported earlier by Mitchell et al.35 They observed a similar increase of XPS spectrum's C3 peak, as well as the increase in negative ion TOF-SIMS spectrum's peak at m/z = 221. This peak is assigned to a cellulosic material that has a surface carbonyl group.35 In both scouring treatments, the increasing apparent oxygen at the surface (Table S5 of ESI†) makes the cotton fiber surface more hydrophilic, thus, increasing its wettability to aqueous solutions.
O) group in addition to the existing O–C–O component of the cellulose.35 This results in the increased C3 peak (binding energy 288.2 eV) of the XPS spectrum in Na2CO3-scoured cotton (Fig. S9(C) and Table S4†). This increasing C3 peak resulting from Na2CO3 scouring similarly happened to cotton treated by bleaching, as reported earlier by Mitchell et al.35 They observed a similar increase of XPS spectrum's C3 peak, as well as the increase in negative ion TOF-SIMS spectrum's peak at m/z = 221. This peak is assigned to a cellulosic material that has a surface carbonyl group.35 In both scouring treatments, the increasing apparent oxygen at the surface (Table S5 of ESI†) makes the cotton fiber surface more hydrophilic, thus, increasing its wettability to aqueous solutions.
The scouring treatment has also changed the cotton fiber surface texture/morphology. Fig. S1 of the ESI† shows the relatively smooth surface of the untreated cotton fiber. Fig. S2 and S3†, on the other hand, show the increased morphological surface roughness of NaOH-treated and Na2CO3-treated cotton fibers, respectively. The closely packed parallel fibril structure of the cellulose fiber is now exposed. Hence, the surface to volume ratio is increased, and the pressure gradient1,3,4 is added due to the occurrence of nanoscale capillary channels along the fiber. These factors contribute to the increased wicking rate in those treated cotton fabrics, and can be explained as follows. All the untreated and treated cloth samples wick liquid samples through the weave porosity (interyarn spaces), as well as through the interstitial gaps between the spun microfibers in a single yarn. The treated scoured cloth, however, also wicks the solution through the additional imbibitions by single fiber.24,26,43 To prove this, we have carried out observation of single fiber wicking from the untreated, NaOH-scoured, and Na2CO3-scoured samples, as shown in Fig. S11(A)–(C) (ESI†), respectively. There is only very little wicking in the untreated single cotton fiber (Fig. S11(A)†). Thus, in the scoured cotton fabrics, the wicking involves both capillary penetration of the liquid into the hierarchical gaps, as well as the diffusion of the liquid into the fiber. Since the capillary principle states that the movement of the liquid front happens by first filling in smaller pores,26 we believe that the wicking mechanism involved in our treated cotton cloths could be explained as follows. Liquid first moves in the very small (nm scale) gaps between the exposed cellulose fibrils within a single microfiber (see Fig. S5 and S6 of the ESI†) as well as diffuses into the fiber. Some excess liquid on the fiber surface will further move into the interfiber spaces within a single yarn, and then moves further into the larger interyarn spaces. In the untreated cotton (Fig. S4 in the ESI†), there is only a little wicking within a single fiber. The liquid immediately fills in and flows through the interfiber spaces within a single yarn, and so on further to the larger gaps between the yarns.
Wax as hydrophobic barrier for defining microfluidic channel in cotton cloth
As mentioned in the previous subsection, wax consists of long fatty acid chains36,37 which renders it to be hydrophobic in nature. This property can be utilized to use wax as the hydrophobic barrier for defining microfluidic channels in cotton cloth. In fact, previously, the Whitesides group has used wax to define a microfluidic channel in paper,22 which, similar to cotton fabrics, is also composed of cellulose fibers. The use of wax as dye-resist in textile processing is also common, especially in the traditional batik technique commonly found in South-East Asia.29 The wax pattern is written by hand or transferred using a metallic stamp onto cotton cloth so that when the cloth is dipped into dye, the dye will not penetrate the region which is covered by wax.29 Similarly, here, we applied hot melted wax to fill in the gaps between the fibers in a single yarn as well as the space in the weave porosity of cotton fabrics to create hydrophobic regions in a hydrophilic substrate (Fig. 3(A–C)). Fig. 3(B) shows a magnified SEM image of the unwaxed region where the gaps between the single cotton fibers can be clearly seen, while in Fig. 3(C) we see a magnified SEM image of the waxed region where these gaps as well as the surface of individual fibers are covered by wax. Fig. 3(D) shows more proof from a light microscopy image that wax covers both the weave porosity and the gaps between the fibers. In the non-wax region light can easily transverse through the space in the weave porosity. Yet, the gaps between the fibers in a single yarn appear darker compared to those of the waxed region. This is because the small cavities between these fibers absorb the transmitted light.44,45 In the waxed region of Fig. 3(D), however, the light is diffusively transmitted by the wax that fills the gaps and spaces.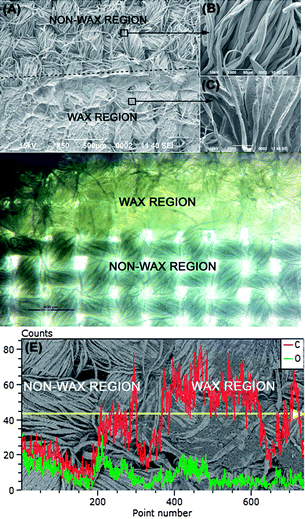 | ||
| Fig. 3 SEM image of the boundary (shown by a dotted line) between untreated and wax-treated areas of cotton cloth (A) at 50× magnification with a bar line indicating 500 μm. The area without wax is further zoomed in and shown in (B), while the zoom-in image of the wax region is shown in (C); each at 500× magnification with bar lines indicating 50 μm. The images in (A-bottom) and (C) show how wax is spread and fills the gaps between the fibers. Microscopy image of the two regions is shown in (D). The gaps between the fibers in the nonwax region absorb transmitted light (D-bottom), while after being filled by wax, the light is diffusely transmitted (D-top). (E) Energy-Dispersive Electron Spectroscopy (EDS) of cotton cloth at the boundary between wax and nonwax regions; the C atom content is significantly increased in the wax region, indicating increase of fatty acid aliphatic chain of the wax. | ||
The increased hydrophobicity of the waxed region is mainly due to the increased content of long aliphatic chains of the fatty acids contained in the wax. This is proven by the extreme increase of the C atom content in the wax region compared to the non-waxed region, as shown in Fig. 3(E) and Table 2. Further EDS characterization of the waxed regions of the different cloth samples (Fig. S8 and Table S3 of the ESI†) also shows decreasing O/C atomic ratio compared to the nonwaxed regions (Tables S1 and S2†). A more quantitative result proving the increased C–C and C–H binding state of the waxed cotton cloth is also obtained through XPS characterisation, as shown in Fig. S9 of the ESI†. The relative concentration of the C1 peak in a wax treated region reaches as high as 96.25% (Table S4†).
| Untreated cotton | Atomic % C | Atomic % O |
|---|---|---|
| Non-wax region | 56.31 ± 3.60 | 43.69 ± 3.06 |
| Wax region | 83.83 ± 7.80 | 16.17 ± 0.53 |
The wicking properties of cloth-based microfluidic devices (CMDs)
We utilized aqueous samples of colored dyes to prove the concept of wicking, localizing and mixing reagents at predetermined zones in hydrophilic regions of CMDs. We created 2D and 3D devices, and tested them by dropping 0.5 μl of yellow ink solution into the inlet point to mix with blue ink in the reaction zones. Full contact in fibers and weave gaps facilitates distribution and good mixing (Fig. 4(A–D)). The 5 μl solution wicked along the hydrophilic channels and filled the device within a few minutes.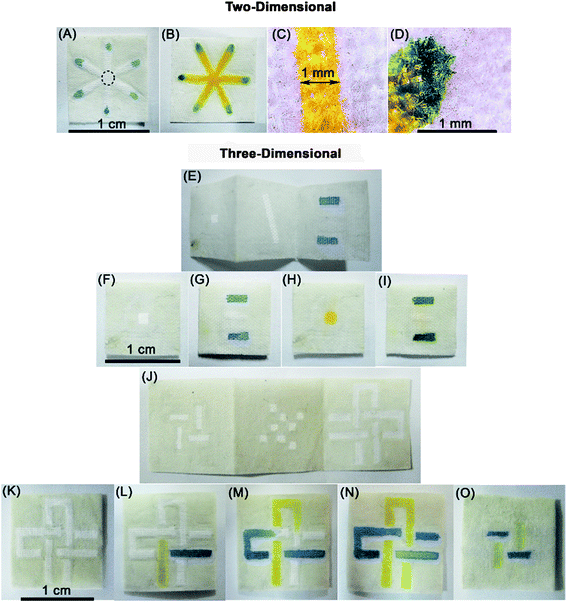 | ||
| Fig. 4 Pictures of 2D and 3D CMDs fabricated by the wax patterning technique. (A)–(D) show a 2D CMD. Blue ink was spotted into reaction zones using a micropipette (0.1–2.5 μl) (A) and yellow ink was dropped at the inlet point (indicated by a dashed circle line). (B) Photograph taken 1 min after adding the yellow dye to the inlet point. Microscopic images of dye transportation in the hydrophilic channel (C) and mixing in the reaction zones (D) without leakage to the hydrophobic region. (E–O) Fabrication of 3D cloth-based microfluidic devices (CMDs) by patterning a hydrophilic channel (width = 1 mm) bounded with hydrophobic wax on a layer of cloth. Photographs before assembling the 3D devices (E and J). Sample inlet and reaction zones are defined in top and bottom layers, respectively (F and G). This model of the 3-D device required 5 μl of sample to fill the hydrophilic channels and detection zones within 1 min (E–I). (H) and (I) are front and back views of the device 1 min after applying a yellow solution of dye that is mixed with blue dye on the bottom layer. (J)–(O) are photographs showing two hydrophilic channels with different dye solutions that cross each other vertically and horizontally in three layers without mixing. (K)–(N) are front views of the device before, 5 s, 2 and 5 min after dropping the dyes into different channels. (O) is the bottom layer 5 min after adding the dyes (experiment is adapted from ref. 18). | ||
We also fabricated 3D CMDs by folding a layer of patterned cloth that readily wicks aqueous samples within the hydrophilic channels in different layers of the cloth. The middle layers of the folded cloth determine which fluid moves between two adjacent layers. We develop 3D CMDs since they are useful for multiple assays. One side of the 3D device can be defined as an inlet point for distributing the samples into the detection zones located on the other side of the device (Fig. 4(E–I)). Fig. 4(J–O) demonstrate the capability of 3D CMDs to wick solutions of dyes within 2 hydrophilic channels that cross each other multiple times. This experiment is adapted from a similar experiment conducted by the Whitesides group in a 3D CMD from paper and tape.18 Microvolumes of samples wick throughout the hydrophilic parts from inlet points on the top layer into arrays of reaction zones in the bottom layer.
The cost of the materials used to make microfluidic channels was approximately $1.4 m−2 and the 3D device was assembled manually in 5 min (Fig. 4). The benefit of cloth-based microfluidic devices is that they can be made using simple and readily available equipment to create layer by layer channels and multi-reaction zones.
Colorimetric bioassay in microfluidic cloth-based analytical devices (μCADs)
In this study, colorimetric detection of protein was utilized as a model assay to examine the function of cloth-based microfluidic devices as an analytical device. We detected unknown amounts of BSA in artificial urine using 2D and 3D CMDs (Fig. 5). Samples of artificial urine without protein were used as a control. The white cotton fabric has enough contrast with the blue coloration resulting from positive BSA samples (Fig. 5(B), (F) and (H)). The intensity of the blue color resulting from test and control samples can be measured in the detection zones for further semiquantitative assay. The detection zones in Fig. 5(F) have 3 mm length. They are defined to be small enough to decrease the reagent consumption,46 yet the assay results are still observable by naked eye. These results demonstrate that these CMDs can be utilized for diagnostic application by performing colorimetric assays of body fluid samples. Fig. 5G and H particularly prove that the assay can also be carried out in a bent cloth platform. Unlike other conventional rigid microfluidic platforms, such as silicon, glass or plastic, this flexibility could offer a new type of applications currently not feasible to do with conventional rigid platforms.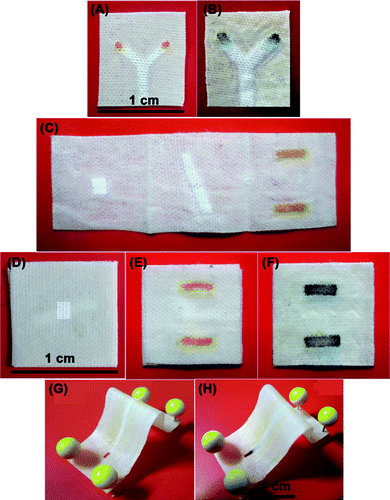 | ||
| Fig. 5 Two- and three-dimensional CMDs for running colorimetric protein assays of artificial urine samples. The assay results using the 2D CMDs are shown (A) for control sample (i.e. no protein) and (B) for positive sample (i.e. with protein). In (C), the 3D CMD is shown before folding, after the application of 1 μl of reagent solution (bromophenol blue, BPB) at the reaction zones. (D)–(F) show the top (D) and bottom sides (E and F) of the 3D CMDs after adding 5 μl of control (E) and positive (F) samples, respectively. The results of assays in bent flexible 2-D CMDs are shown (G) for control sample and (H) for positive sample. All devices are designed with the same channel width size (less than 1 mm). | ||
Conclusions
This paper demonstrates a convenient method to manufacture a family of flexible microfluidic devices using cotton cloth as the structural material. This kind of cloth can be easily treated with hot-chemical bath solution (scouring) to create high hydrophilicity. This chemical treatment is a simple way of promoting hydrophilicity in the cotton fabrics. It requires less than 20 min to boil in anhydrous sodium carbonate solution, followed by washing with plenty of water. SEM images show the change on the surface of the treated cotton fabrics due to the removal of the natural wax impurities on the fiber wall. It was shown in the SEM images that the underlying fiber texture is exposed after the treatment. Sub-μm gaps and channels in a single fiber, μm gaps between fibers in one single yarn, as well as the weave porosity contribute to the increased wicking in the treated cotton fabrics. EDS and XPS data also indicate chemical composition changes of the fiber surface which contribute to the increased wettability of the fiber to aqueous solution. Furthermore, capillary rise measurement shows the increasing laminar and vertical wicking rates after the chemical treatments.We reported a method to fabricate cloth-based microfluidic devices utilizing a wax patterning technique. The fabrication process is low-cost, quick and can be carried out in any laboratory without specialized equipment and clean room facility. The re-melt wax (through wax impregnated paper) is applied on the cloth to define one layer of the 2D hydrophilic–hydrophobic pattern on the flexible hydrophilic substrate. We have also shown that by folding the 2D wax-patterned cloth through designed fold line(s), a 3D device can also be formed. Such a device is appropriate for performing colorimetric assays of body fluids using only microlitre volumes of samples and reagents. The colorimetric results can be designed to be observable by direct visual observation for quick interpretation. These microfluidic devices have the potential applications to be used as point-of-care and disposable diagnostic devices in the healthcare sector, and are suitable for use in the developing world, due to their low fabrication cost and ease of use. Currently, we are investigating the possibility of mass manufacturing of CMDs using a metallic stamp inspired by the traditional batik stamping method, the so called batik cap or batik cetak method. We further anticipate that the durability and flexibility of the cloth/fabrics would make it possible to design wearable CMDs as a new diagnostic platform in the near future.
Acknowledgements
We would like to express our gratitude and deepest thanks to Universiti Teknologi Malaysia (UTM) for giving us support through Tier-1 Research University Grant (GUP) under project no. Q.J130000.7136.01H65. A. Nilghaz is financially supported by UTM through project Foreign Academic Visiting Fund (FAVF) 4D004. We would like to thank Dr Jon Efendi of Ibnu Sina Institute UTM for his help in the optical microscopy. The help of Mrs Siew Siew and Mr K. Y. Tay from Hi-Tech Instruments Malaysia for the FESEM and EDS is also acknowledged. Some EDS was also performed with the help from Mr Tan Teck Siong from JEOL Singapore and Mr K.L. Chan from KL Analytical Malaysia, and we are thankful to them for it. We thank Mr Tan Teck Beng of Shimadzu (Asia Pacific) Pte Ltd for arranging the XPS characterization. We also would like to thank Prof. Hadi Nur from Ibnu Sina Institute of Fundamental Studies, UTM, for the encouraging discussions during the course of this research. We also thank Mr Syed Mustafa Syed Azman for giving us technical help for many of the experiments.References
- D. J. Beebe, G. A. Mensing and G. M. Walker, Annu. Rev. Biomed. Eng., 2002, 4, 261–286 CrossRef CAS.
- K.-K. Liu, R.-G. Wu, Y.-J. Chuang, H. S. Khoo, S.-H. Huang and F.-G. Tseng, Sensors, 2010, 10, 6623–6661 CrossRef CAS.
- J. P. Brody, P. Yager, R. E. Goldstein and R. H. Austin, Biophys. J., 1996, 71, 3430–3441 CrossRef CAS.
- H. A. Stone and S. Kim, AIChE J., 2001, 47, 1250–1254 CrossRef CAS.
- B. R. Lutz, J. Chen and D. T. Schwartz, Proc. Natl. Acad. Sci. U. S. A., 2003, 100, 4395–4398 CrossRef CAS.
- G. M. Whitesides, Nature, 2006, 442, 368–373 CrossRef CAS.
- P. Gravesen, et al. , J. Micromech. Microeng., 1993, 3, 168 CrossRef CAS.
- J. M. Park, A. T. Evans, K. Rasmussen, T. R. Brosten, G. F. Nellis, S. A. Klein and Y. B. Gianchandani, J. Microelectromech. Syst., 2009, 18, 868–877 CrossRef.
- W. Zhang, S. Lin, C. Wang, J. Hu, C. Li, Z. Zhuang, Y. Zhou, R. A. Mathies and C. J. Yang, Lab Chip, 2009, 9, 3088–3094 RSC.
- A. W. Martinez, S. T. Phillips, M. J. Butte and G. M. Whitesides, Angew. Chem., Int. Ed., 2007, 46, 1318–1320 CrossRef CAS.
- D. A. Bruzewicz, M. Reches and G. M. Whitesides, Anal. Chem., 2008, 80, 3387–3392 CrossRef CAS.
- D. B. Weibel, M. Kruithof, S. Potenta, S. K. Sia, A. Lee and G. M. Whitesides, Anal. Chem., 2005, 77, 4726–4733 CrossRef CAS.
- V. N. Goral, N. V. Zaytseva and A. J. Baeumner, Lab Chip, 2006, 6, 414–421 RSC.
- Y. Xia and G. M. Whitesides, Angew. Chem., Int. Ed., 1998, 37, 550–575 CrossRef CAS.
- Y. Xia and G. M. Whitesides, Annu. Rev. Mater. Sci., 1998, 28, 153–184 CrossRef CAS.
- G. M. Whitesides, E. Ostuni, S. Takayama, X. Jiang and D. E. Ingber, Annu. Rev. Biomed. Eng., 2001, 3, 335–373 CrossRef CAS.
- J. L. Osborn, B. Lutz, E. Fu, P. Kauffman, D. Y. Stevens and P. Yager, Lab Chip, 2010, 10, 2659–2665 RSC.
- A. W. Martinez, S. T. Phillips and G. M. Whitesides, Proc. Natl. Acad. Sci. U. S. A., 2008, 105, 19606–19611 CrossRef CAS.
- A. W. Martinez, S. T. Phillips, Z. Nie, C.-M. Cheng, E. Carrilho, B. J. Wiley and G. M. Whitesides, Lab Chip, 2010, 10, 2499–2504 RSC.
- M. Reches, K. A. Mirica, R. Dasgupta, M. D. Dickey, M. J. Butte and G. M. Whitesides, ACS Appl. Mater. Interfaces, 2010, 2, 1722–1728 CAS.
- X. Li, J. Tian and W. Shen, ACS Appl. Mater. Interfaces, 2010, 2, 1–6 CAS.
- E. Carrilho, A. W. Martinez and G. M. Whitesides, Anal. Chem., 2009, 81, 7091–7095 CrossRef CAS.
- P. Bhandari, T. Narahari and D. Dendukuri, Lab Chip, 2011, 11, 2493–2499 RSC.
- J. J. De Boer, Text. Res. J., 1980, 50, 624–631 CrossRef CAS.
- N. R. Bertoniere and W. D. King, Text. Res. J., 1989, 59, 114–121 CrossRef CAS.
- Y.-L. Hsieh, J. Thompson and A. Miller, Text. Res. J., 1996, 66, 456–464 CrossRef CAS.
- Z. Nie, C. A. Nijhuis, J. Gong, X. Chen, A. Kumachev, A. W. Martinez, M. Narovlyansky and G. M. Whitesides, Lab Chip, 2010, 10, 477–483 RSC.
- X. Gong, X. Yi, K. Xiao, S. Li, R. Kodzius, J. Qin and W. Wen, Lab Chip, 2010, 10, 2622–2627 RSC.
- N. Belfer, Batik and Tie Dye Techniques, Dover Publications, 1992 Search PubMed.
- N. Wang, A. Zha and J. Wang, Fibers Polym., 2008, 9, 97–100 CrossRef.
- A. W. Martinez, S. T. Phillips, G. M. Whitesides and E. Carrilho, Anal. Chem., 2010, 82, 3–10 CrossRef CAS.
- W. Wang, W.-Y. Wu and J.-J. Zhu, J. Chromatogr., A, 2010, 1217, 3896–3899 CrossRef CAS.
- S. Chutipongtanate and V. Thongboonkerd, Anal. Biochem., 2010, 402, 110–112 CrossRef CAS.
- G. R. Gamble, J. Agric. Food Chem., 2003, 51, 7995–7998 CrossRef CAS.
- R. Mitchell, C. Carr, M. Parfitt, J. Vickerman and C. Jones, Cellulose, 2005, 12, 629–639 CrossRef CAS.
- L. Kunst and A. L. Samuels, Prog. Lipid Res., 2003, 42, 51–80 CrossRef CAS.
- H. G. M. Edwards and M. J. P. Falk, Spectrochim. Acta, Part A, 1997, 53, 2685–2694 CrossRef.
- G. Chitnis, Z. Ding, C.-L. Chang, C. A. Savran and B. Ziaie, Lab Chip, 2011, 11, 1161–1165 RSC.
- M. N. Belgacem, G. Czeremuszkin, S. Sapieha and A. Gandini, Cellulose, 1995, 2, 145–157 CrossRef CAS.
- T. Topalovic, V. A. Nierstrasz, L. Bautista, D. Jocic, A. Navarro and M. M. C. G. Warmoeskerken, Colloids Surf., A, 2007, 296, 76–85 CrossRef CAS.
- P. E. Burch, Caustic Soda, Soda Ash, and Dye Choice with Batik, http://www.pburch.net/dyeing/dyeblog/C1093657698/E20060101101117/, accessed 4 October, 2011 Search PubMed.
- Center for Disease Control and Prevention (CDC), Sodium Hydroxide, in Part Symptoms, http://www.cdc.gov/niosh/npg/npgd0565.html, accessed 4 October, 2011 Search PubMed.
- E. Kissa, Text. Res. J., 1996, 66, 660–668 CrossRef CAS.
- R. Engeln, G. Berden, R. Peeters and G. Meijer, Rev. Sci. Instrum., 1998, 69, 3763 CrossRef CAS.
- R. Peeters, in Science, Mathematics and Informatics, Catholic University of Nijmegen, Nijmegen, 2001, p. 136 Search PubMed.
- W. Dungchai, O. Chailapakul and C. S. Henry, Anal. Chim. Acta, 2010, 674, 227–233 CrossRef CAS.
Footnote |
| † Electronic supplementary information (ESI) available. See DOI: 10.1039/c1lc20764d |
| This journal is © The Royal Society of Chemistry 2012 |