Preparation and hydrogen storage capacity of templated and activated carbons nanocast from commercially available zeolitic imidazolate framework†
A.
Almasoudi
and
R.
Mokaya
*
School of Chemistry, University of Nottingham, University Park, Nottingham, NG7 2RD, UK. E-mail: r.mokaya@nottingham.ac.uk; Fax: +44 (0)115 9513562
First published on 20th October 2011
Abstract
A commercially available zeolitic imidazolate framework (ZIF), namely Basolite Z1200 (BASF), has been used as template for nanocasting of highly microporous ZIF-templated carbon. The “hard template carbonization technique” consists of liquid impregnation of furfuryl alcohol into the pores of the ZIF followed by polymerization and then carbonization during which the ZIF template is removed to generate the microporous carbon (90–95% microporosity) with a surface area of 900–1100 m2 g−1 and a pore volume of ca. 0.7 cm3 g−1. Chemical activation (with KOH at a relatively low temperature of 700 °C for 1 h and a carbon/KOH weight ratio of 1![[thin space (1/6-em)]](https://www.rsc.org/images/entities/char_2009.gif) :4) of the ZIF-templated carbons increases their porosity by between 30 and 240% depending on their carbonization temperature, to achieve a surface area of up to 3200 m2 g−1 and a pore volume of 1.94 cm3 g−1. Despite the drastic increase in porosity, the activated ZIF-templated carbons retain significant microporosity with micropores contributing 80–90% of surface area and 60–70% of pore volume. This occurs because the activation process mainly enhances existing porosity rather than creating new larger pores. The activation enhances the hydrogen uptake capacity of the ZIF-templated carbons by between 25 and 140% from 2.6–3.1 wt% to the range 3.9–6.2 wt% (at −196 °C and 20 bar). The increase in hydrogen uptake after activation is closely related to rises in the micropore surface area and micropore volume rather than overall increase in porosity. Due to their microporous nature, the carbons exhibit high hydrogen storage density in the range 13.0–15.5 μmol H2 m−2, which is much higher than that of most high surface area activated carbons.
:4) of the ZIF-templated carbons increases their porosity by between 30 and 240% depending on their carbonization temperature, to achieve a surface area of up to 3200 m2 g−1 and a pore volume of 1.94 cm3 g−1. Despite the drastic increase in porosity, the activated ZIF-templated carbons retain significant microporosity with micropores contributing 80–90% of surface area and 60–70% of pore volume. This occurs because the activation process mainly enhances existing porosity rather than creating new larger pores. The activation enhances the hydrogen uptake capacity of the ZIF-templated carbons by between 25 and 140% from 2.6–3.1 wt% to the range 3.9–6.2 wt% (at −196 °C and 20 bar). The increase in hydrogen uptake after activation is closely related to rises in the micropore surface area and micropore volume rather than overall increase in porosity. Due to their microporous nature, the carbons exhibit high hydrogen storage density in the range 13.0–15.5 μmol H2 m−2, which is much higher than that of most high surface area activated carbons.
1 Introduction
Porous carbon materials are widely used in industry due to their hydrophobic nature, high surface area, good thermal and mechanical stability, chemical inertness and high physisorption capacity. This last property is useful in addressing one of the main current challenges in energy research, i.e., hydrogen storage.1 This is due to the fact that hydrogen physisorbed on porous carbon can be released reversibly. The physisorption of hydrogen on porous solid state materials, including metal–organic frameworks,2,3zeolites,4 templated carbons5–7 or activated carbons8,9 and other forms of carbon nanostructures,10 is currently under intense study. Traditionally, highly porous carbon materials that are useful for sorption applications such as hydrogen storage have been prepared via physical (gas) or chemical activation of suitable carbon precursors.11,12 Recently a new “hard template carbonization” technique has been developed that allows a more precise control of the porous structure of carbons.13,14 The technique consists of the carbonization of an organic precursor in the nanospace of a template inorganic material and the liberation of the resultant carbon network via dissolution of the template. This methodology allows control of porosity in the resulting templated carbons due to the spatial regulation imposed by the template nanospace, leading to materials with narrow pore size distribution, which usually also exhibit high surface area and pore volume.14 The type of inorganic template used determines the porous structure of the templated carbon material.14 Structurally well ordered ‘hard’ templates that have so far been used include zeolites, mesoporous silicates and metal–organic frameworks (MOFs).14–16Recently, there have been reports of carbon materials prepared via templating (hard or soft) methods followed by activation.17–20 It has been reported that the porosity of templated microporous, mesoporous or macroporous carbons can be varied beneficially by physical or chemical activation.17–20 The activation of porous carbons to enhance properties is not restricted to templated carbons; other types of moderate to high surface area carbons such as carbide-derived-carbons can also be activated to greatly enhance their porosity and energy or hydrogen storage capacity.21 The aim of the work reported here was therefore first to synthesise porous materials via a hitherto unexplored templating route that utilises commercially available MOFs of the zeolitic imidazolate framework (ZIF) type namely Basolite Z1200 as a hard template. Secondly, we aimed to further modify the textural properties of the ZIF-templated carbons via mild chemical activation with the hope of enhancing textural properties and hydrogen storage capacity. We have used the commercially available zeolitic imidazolate framework (ZIF) that is readily available, namely Basolite Z1200 (BASF) as a template for nanocasting carbon. The generated carbons were then subjected to chemical activation with KOH at a relatively low temperature of 700 °C. The relatively low temperature was used in an attempt to optimize the pore space of the ZIF-templated carbons as opposed to creation of totally ‘new’ porosity. We explore and discuss the hydrogen storage properties of the ZIF-templated and activated carbons.
2 Experimental
2.1 Material synthesis
The ZIF template, ZIF-8 (Basolite Z1200™ Sigma-Aldrich), was degassed at 200 °C for 3 h to remove any water. The degassed ZIF template was soaked in furfuryl alcohol (FA), stirred for 1 h and the resulting mixture was allowed to stand overnight (so that the FA could fully infiltrate the ZIF-template pores), followed by filtration and washing with dimethyl formamide to remove any externally adsorbed FA. The FA/ZIF composite was then transferred into a quartz boat and placed in a furnace, under flowing Ar, for 6 h to exclude air and then heated at 80 °C for 24 h and then at 150 °C for 6 h under Ar. Subsequently, carbonization of the composite was performed under Ar at 900, 1000, 1050, and 1100 °C for 8 h with a heating ramp of 3 °C min−1. The resulting samples were labelled BF-T, where T is the carbonization temperature in °C.For the chemical activation, the BF-T carbon samples were thoroughly mixed with KOH at a carbon/KOH weight ratio of 1/4. The mixture was then heat treated in a horizontal furnace under a nitrogen flow at 700 °C for 1 h with a heating ramp rate of 3 °C min−1. The resulting mixture was washed three times with 2 M HCl at room temperature to remove any inorganic salts and then with distilled water until neutral pH was achieved. Finally, the resultant activated ZIF-templated carbon was dried in an oven at 120 °C for 3 h. The activated ZIF-templated carbons were denoted as ACX, where X is the templated carbon.
2.2 Material characterisation
Powder XRD analysis was performed on a Bruker D8 Advance powder diffractometer using CuKα radiation (λ = 1.5406 Å) and operating at 40 kV and 40 mA, with 0.02° step size and 2 s step time. Thermogravimetric analysis was performed using a TA Instruments SDT Q600 analyzer under flowing gas (air or nitrogen) conditions. For porosity analysis, each sample was pre-dried in an oven and then degassed overnight at 200 °C under high vacuum. The textural properties were determined by nitrogen sorption at −196 °C using a Micromeritics ASAP 2020 volumetric sorptometer. The surface area was calculated by using the BET method applied to adsorption data in the relative pressure (P/Po) range of 0.06–0.22. The total pore volume was determined from the amount of nitrogen adsorbed at P/Po = 0.99. The pore size distribution was determined by a non-local density functional theory (NLDFT) method using nitrogen adsorption isotherms. Scanning electron microscopy (SEM) images were recorded using a FEI XL30 microscope. The samples for SEM analysis were prepared by ultrasonic dispersion of the powder products in ethanol, which were then deposited and dried on a holey carbon film on a copper supported grid.2.3 Hydrogen uptake measurements
An intelligent gravimetric analyser (IGA) was used to measure the hydrogen storage capacity using high purity hydrogen (99.9999%). The carbon samples were dried in an oven for 24 h at 80 °C overnight and then placed in the analysis chamber and degassed at 200 °C and 10−10 bar for 4–6 h. The hydrogen uptake measurements were performed in the 0–20 bar pressure range at −196 °C (liquid nitrogen bath).3 Results and discussion
3.1 Nature of ZIF template and ZIF/carbon composites
Zeolitic imidazolate frameworks (ZIFs) are nanoporous materials which consist of tetrahedral clusters of MN4 (M = Zn, linked by imidazolate ligands) with a SOD (sodalite) zeolite-type structure.22 The ZIF used as template, i.e., commercially available Basolite Z1200, has a well defined XRD pattern with sharp peaks characteristic of a crystalline solid (Fig. S1†). The ZIF was assessed, by thermogravimetric analysis (TGA), to be stable in nitrogen up to 500 °C (Fig. S2a†).22 Thermal treatment of the ZIF under nitrogen causes continuous mass loss between 500 and 1000 °C with distinct mass loss events at 605, 640 and 950 °C, as shown by the differential thermogravimetric (DTG) profile (Fig. S2b†). The residual mass at 1000 °C is ca. 35 wt%. This residual mass is presumed to be largely due to the Zn contained in the ZIF structure, and is consistent with the empirical structural formula of C8H12N4Zn. Under our thermal analysis conditions Zn metal is not vaporised until ca. 1100 °C (inset, Fig. S2a†). The porous structure of the ZIF was ascertained by nitrogen sorption analysis (Fig. S3†). The ZIF adsorbs nitrogen mainly at relative pressure (P/Po) < 0.1, which corresponds to micropore filling. The isotherm is type I, typical of a microporous material. The microporosity of the ZIF is confirmed by the pore size distribution (PSD) data (Fig. S3†), which shows unimodal PSD with pore maxima at ca. 11 Å. The ZIF template had a surface area and pore volume of 1417 m2 g−1 and 0.77 cm3 g−1 respectively with a micropore surface area of 1397 m2 g−1 and a micropore volume of 0.67 cm3 g−1.As described in the Experimental section, the templated carbon materials were prepared using furfuryl alcohol (FA) as carbon precursor wherein the first step was ingress of the FA into the pores of the ZIF via liquid impregnation and heating of the resulting composite at between 80 and 150 °C under Ar, followed by a second thermal treatment step involving carbonisation of the ZIF/FA composite at 900–1100 °C. The XRD pattern of the ZIF/FA composite following impregnation with furfuryl alcohol and heating at 80 °C for 24 h and then at 150 °C for 6 h under Ar but prior to the carbonization process (Fig. S4a†) shows peaks at positions similar to those of the ZIF pattern but with lower intensity. This indicates that the FA impregnation process does not alter the crystalline structure of the ZIF. Thermogravimetric analysis (in air) of the ZIF/FA composite (Fig. S4b†) indicates mass loss in the temperature range 350–550 °C, with a residual mass of ca. 33%. Considering that the ZIF is stable up to ca. 500 °C (Fig. S2†), the early mass loss from the composite (350–500 °C) is due to decomposition of the FA. Beyond 500 °C, two mass loss processes are superimposed: (i) mass loss from decomposition/combustion of the carbon precursor, FA, and (ii) mass loss due to the decomposition of the ZIF. Indeed, an inflection point observed at ca. 450 °C may indicate the point at which the ZIF starts burning off.
3.2 ZIF-templated carbons
The XRD patterns of the carbons prepared at various carbonisation temperatures are shown in Fig. 1a. The patterns show two broad features centered at 2θ = 24° and 44°. These very broad and low intensity diffraction bands are at positions where (002) and (10) diffraction peaks of graphitic carbon would occur. The broad nature of the diffraction bands indicates that the ZIF-templated carbon materials are essentially amorphous. The sample to sample variation of the intensity of the diffraction band at 2θ = 44° suggests that higher carbonisation temperatures generate slightly more turbostratic/graphitic carbons. Overall, however, the carbonisation temperature has only a very slight effect on the extent of graphitisation. This implies that most of the FA (carbon precursor) was deposited inside the porosity of the template wherein it cannot graphitise at the carbonisation temperatures used.23 It is also the case that FA does not easily undergo graphitization, especially at the temperatures used. On the other hand, no diffraction peaks of the Basolite ZIF framework are observed. This is due to decomposition of the ZIF during the high temperature carbonisation step.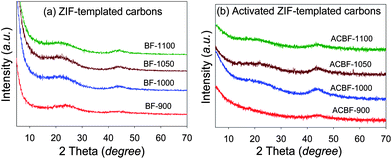 | ||
| Fig. 1 Powder XRD patterns of ZIF-templated carbon materials carbonised at various temperatures before (a) and (b) after activation with KOH (at a KOH/carbon ratio of 4) at 700 °C for 1 h. | ||
The TGA curves of the ZIF-templated carbon materials are shown in Fig. 2. All the samples exhibit a small initial mass loss below 200 °C, which can be attributed to removal of physisorbed water. The main mass loss event, which is due to combustion of the carbon, occurs in the temperature range 500–600 °C. The temperature at which maximum mass loss occurs varies depending on the carbonisation temperature. The sample prepared at 900 °C burns off at a lower temperature compared to the other samples. The residual mass at 1000 °C varies with carbonisation temperature, being ca. 11.5 wt% for sample BF-900 and ca. 2 wt% for samples carbonised at 1000, 1050 and 1100 °C. The much higher residual mass for sample BF-900 is due to incomplete removal of Zn during the carbonisation step. The residual mass of the other samples indicates that they are virtually ZIF free due to their higher carbonisation temperature. The TGA data therefore indicate that carbonisation of the ZIF/FA composite at temperature above 1000 °C removes the ZIF template and generates Zn-free carbons, with a carbon yield (excluding water and residual mass) of ca. 97 wt%.
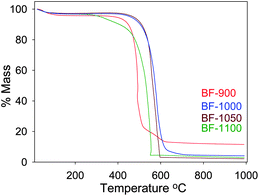 | ||
| Fig. 2 TGA curves of ZIF-templated carbon materials carbonised at various temperatures. | ||
Fig. 3a shows the nitrogen sorption isotherms for the ZIF-templated carbons. The isotherms are all type I and exhibit virtually no hysteresis between adsorption and desorption branches. The type I nature of the isotherms, with significant nitrogen uptake at relative pressure (P/Po) below 0.1, indicates that all the BF-T carbon samples have a microporous structure. All the carbons also have some adsorption at P/Po above 0.95, which we attribute to interparticle voids. The isotherms indicate relatively comparable porosity for the BF-T carbons with surface area in the range 900–1100 m2 g−1 and a pore volume of between 0.6 and 0.7 cm3 g−1 as shown in Table 1. The highest surface area is achieved for carbonisation temperatures of 1000 and 1100 °C (1067 and 1131 m2 g−1 respectively), as well as the largest pore volume (ca. 0.7 cm3 g−1). Sample BF-900 has lower surface area and pore volume presumably due to the presence of a significant amount of residual ZIF template (i.e., Zn) as indicated by thermal analysis data (Fig. 2). For all the BF-T carbons, the proportion of micropore surface area is high at ca. 90% while the micropore volume is ca. 70%. Both are consistent with the highly microporous nature of the ZIF-templated carbons.
| Sample | Surface areaa/m2 g−1 | Pore volumeb/cm3 g−1 | Pore sizec/Å | H2 uptake (wt%) | H2 uptake density/μmol H2m−2 |
|---|---|---|---|---|---|
| a Values in parenthesis are micropore surface area. b Values in parenthesis are micropore volume. c Pore size maxima from NLDFT pore analysis. | |||||
| BF-900 | 933 (872) | 0.57 (0.41) | 8/15/20 | 2.6 | 13.9 |
| BF-1000 | 1131 (1055) | 0.69 (0.49) | 8/15/20 | 3.0 | 13.3 |
| BF-1050 | 1069 (979) | 0.67 (0.46) | 5/15/20 | 3.1 | 14.5 |
| BF-1100 | 1067 (954) | 0.69 (0.45) | 8/15/20 | 3.0 | 14.1 |
| ACBF-900 | 3188 (2529) | 1.94 (1.16) | 6/12/25 | 6.2 | 9.7 |
| ACBF-1000 | 1893 (1678) | 1.13 (0.78) | 8/13/21 | 4.9 | 12.9 |
| ACBF-1050 | 1425 (1204) | 0.91 (0.57) | 8/13/21 | 3.9 | 13.7 |
| ACBF-1100 | 1523 (1356) | 0.95 (0.63) | 8/13/21 | 4.7 | 15.4 |
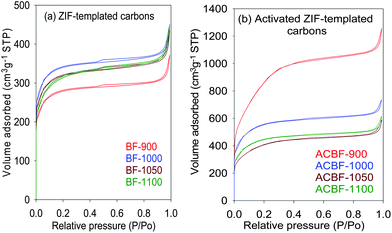 | ||
| Fig. 3 Nitrogen sorption isotherms of ZIF-templated carbon materials carbonised at various temperatures before (a) and (b) after activation with KOH (at a KOH/carbon ratio of 4) at 700 °C for 1 h. | ||
The pore size distribution (PSD) of all the ZIF-templated carbons, determined via a DFT model using adsorption data (Fig. S5†), exhibits three maxima suggesting a tri-modal pore size distribution within the pore size range 5–30 Å. The smallest pores are centred at 6–8 Å, with two further pore size maxima at 15 and 20 Å. The majority of the pores are however in the 10–25 Å size range, with no pores above 30 Å. This is consistent with the highly microporous nature of the ZIF-templated carbons. The carbonisation temperature appears to have some effect on the pore size distribution; the higher the temperature, the broader the PSD, with an increase in the proportion of pore channels of size ca. 20 Å. Overall, however, the fairly narrow distribution of the pores suggests that a pore-templating process occurs within the ZIF template particles.24 Representative scanning electron microscopy (SEM) images of sample BF-900 (shown in Fig. 4) indicate the presence of particles with size between 50 and 100 nm that are similar to those of the ZIF template.25 The morphology of the ZIF template was therefore transferred to the carbon material. Such a transfer of particle morphology is expected to occur in a templating mechanism whereby the carbon is predominantly nanocast within the pore channels of the ZIF-template. Furthermore, the smooth surface and sharp particle edges of sample BF-900 are consistent with the absence of externally deposited carbon that would otherwise generate a separate phase of irregular shaped particles.
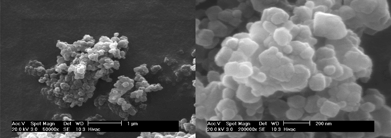 | ||
| Fig. 4 Representative SEM images of ZIF-templated carbon BF-900. | ||
3.3 Activated ZIF-templated carbons
The XRD patterns of the activated ZIF-templated carbons, shown in Fig. 1b, are very similar to those of the carbons before activation (Fig. 1a). The XRD patterns exhibit broad and very low intensity peaks at 2θ = 25° and 43°. The low intensity and broadness of these peaks suggest that the amorphous nature of the carbon remains unchanged after activation. The main aim of the activation process was to enhance the porosity of the ZIF-templated carbons while retaining the dimensions of the pore channels. Fig. 3b shows the nitrogen sorption isotherms of the activated ZIF-templated carbons. The isotherms show that the effect of the activation process depends on the temperature at which the ZIF-templated carbon was carbonised. For samples carbonised at 1000, 1050 and 1100 °C, the activation process leads to a modest increase in the amount of nitrogen adsorbed (Fig. S6†). The modest increase in adsorption is accompanied by a slight widening of the isotherm ‘knee’, which indicates the formation of slightly larger micropores. On the other hand, for sample BF-900, the activation generates an activated carbon that exhibits a much larger increase in the amount of nitrogen adsorbed and also a more extensive widening of the isotherm ‘knee’. The isotherm ‘knee’ widens to cover the P/Po range between 0.1 and 0.3, which indicates that the activation increases the proportion (and amount) of large micropores and generates small mesopores. Nevertheless, despite the tendency to larger micropores and slight mesoporosity, the activated ZIF-templated carbons still remain predominantly microporous as indicated by their type I isotherms with significant adsorption at P/Po below 0.2.In all cases, the activation has little effect on the amount of pores smaller than 10 Å, and the pores originally present in the ZIF-templated carbons are retained after activation (Fig. 5). The effect of activation on the pores centred at 15 Å varies from sample to sample. While samples ACBF-1050 and ACBF-1100 show little change to the proportion of these pores, there is a significant increase for BF-1000 and a much larger increase in their number for BF-900. Nevertheless, in all cases the actual size of the pores remains at ca. 15 Å after activation regardless of the extent of increase in their proportion. On the other hand, for all samples, the size and proportion of pores centred at ca. 20 Å increase significantly after activation (Fig. 5). The extent of increase in size and proportion is higher for carbons generated at lower carbonisation temperature. In particular, activation of sample BF-900 causes a drastic increase in the proportion of pores larger than 15 Å, and the pore maxima shift from 20 Å to 25 Å. The overall picture that emerges from the pore size distribution curves is that for the activated ZIF-templated carbons, the proportion of larger micropores and small mesopores (15–25 Å) exceeds that of smaller (<15 Å) pores. Furthermore, activated ZIF-templated carbons possess some pores that are larger than 30 Å, which were not present before activation. The main effect of KOH activation on ZIF-templated carbons is, therefore, to generate pores of size between 15 and 25 Å, while largely retaining pores smaller than 15 Å. A similar trend has previously been observed for KOH activation of zeolite-templated carbons and activated carbide-derived carbons.20,21 (We, however, note that the apparent size of the pores (1.2 and 2.2–3.4 nm) may be overestimated, which is a general feature of NLDFT pore size obtained from nitrogen sorption data.)26 Despite the uncertainty about the actual pore size, the presented data are sufficiently robust for the comparative analysis in this work and do not affect the observed trends in pore size changes.
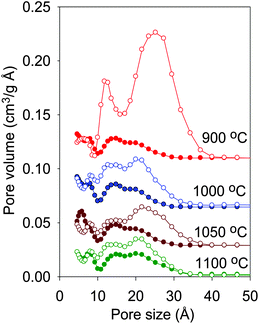 | ||
| Fig. 5 Pore size distribution curves of ZIF-templated carbon materials carbonised at various temperatures before (filled symbols) and after (empty symbols) activation with KOH. | ||
The textural properties of the activated ZIF-templated carbons are summarized in Table 1. A clear increase in the total surface area and pore volume is registered after the activation process. The total surface area increases from 933–1131 m2 g−1 to 1608–3188 m2 g−1 whereas the pore volume rises from ca. 0.7 cm3 g−1 to between 0.9 and 1.94 cm3 g−1. Especially remarkable is the case of ACBF-900, where there is an increase of 240% to the total surface area and pore volume. The large increase in textural properties for sample ACBF-900 may in part be explained by the removal of ZIF residues during the activation process. It is also likely that carbonisation at 900 °C generates a ZIF-templated carbon framework that is more active than those carbonised at higher temperature. The samples prepared at 1000 °C and above undergo surface area and pore volume increases of between 30 and 70% depending on their carbonisation temperature. Despite the large increases in textural properties, the proportion of micropore surface area (80–90%) and micropore volume (60–70%) remains high in the activated ZIF-templated carbons. This trend is rather different from that observed for KOH activated zeolite-templated carbons where, although activation caused an increase in the total surface area and pore volume, in some cases this was accompanied by a drastic decrease in microporosity (i.e., increase in overall surface area and pore volume was accompanied by decrease in micropore surface area and volume).20 Indeed it is noteworthy that for the ZIF-templated carbons, especially those carbonised at 1000 °C and above, activation causes a fairly uniform percentage increase in the total surface area, pore volume, micropore surface area and micropore volume. For example, in the case of sample ACBF-1000, the percentage increase in the total surface area, pore volume, micropore surface area and micropore volume are 67%, 64%, 60% and 60% respectively. Overall, therefore the proportion of microporosity for the ACBF-T samples remains high after activation, which may be explained by the generally non-changing pore size distribution after activation (Fig. 5) due to the relatively mild activation temperature of 700 °C. This means that activation of BF-T carbons (where T = 1000–1100 °C) allows the formation of carbons with higher textural properties but with no substantial change in the pore size distribution. For sample ACBF-900, where significant pore enlargement occurs after activation, the percentage increase in the total surface area and pore volume (ca. 240%) is higher than the increase in the micropore surface area (ca. 190%) and micropore volume (ca. 180%) due to formation of pores of size larger than the micropore range.
3.4 Hydrogen storage
The hydrogen sorption isotherms of the ZIF-templated carbon materials, measured by gravimetric analysis at −196 °C and 20 bar, are shown in Fig. 6a. The hydrogen uptake in wt% was calculated on the basis of a density of 1.5 g cm−3 for the carbon samples and a density of 0.04 g cm−3 for the hydrogen. All the hydrogen uptake isotherms are completely reversible, with the absence of hysteresis between the adsorption and desorption processes, and no saturation is achieved in the 20 bar pressure range, which suggests that higher hydrogen adsorption capacity can be obtained at pressures above 20 bar. The hydrogen uptake capacity of the carbons at 20 bar is summarised in Table 1. The BF-T samples carbonised at 1000, 1050 or 1100 °C have higher hydrogen uptake capacity of between 2.9 and 3.1 wt% compared to 2.6 wt% for sample BF-900 which was carbonised at 900 °C. The hydrogen uptake capacity therefore to some extent correlates with total surface area. Thus, in general, the lower the total surface area of the ZIF-templated carbon, the lower the hydrogen uptake capacity at −196 °C and 20 bar.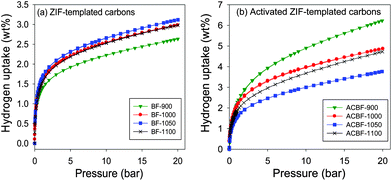 | ||
| Fig. 6 Hydrogen uptake isotherms of ZIF-templated carbon materials carbonised at various temperatures before (a) and (b) after activation with KOH (at a KOH/carbon ratio of 4) at 700 °C for 1 h. | ||
The hydrogen sorption isotherms for the activated ZIF-templated carbons are displayed in Fig. 6b, and the corresponding uptake at 20 bar is summarised in Table 1. The hydrogen storage capacity of the activated ZIF-templated carbons (at −196 °C and 20 bar) is between 3.9 and 6.2 wt%, which is comparable or superior to other activated carbons.8,27–29Activation enhances the hydrogen uptake of all the ZIF-templated carbons by between 25 and 140%. The desired effect of enhancing the hydrogen storage capacity of ZIF-templated carbons viaKOH activation is therefore achieved. This enhancement is clearly a consequence of increases in the textural properties after the chemical activation process. Especially remarkable is again the case of ACBF-900, where a hydrogen uptake as high as 6.2 wt% (140% enhancement) is achieved. A hydrogen uptake of 6.2 wt% at −196 °C and 20 bar is at the highest end of values so far reported for carbon materials.5–10,16,27–29
It is interesting to consider how changes in the textural properties after activation match with the increase in hydrogen storage capacity. We first note that there is no close match between increases in total surface area and pore volume with hydrogen uptake. For example, sample ACBF-900 has a surface area and pore volume increase of ca. 240% while the hydrogen uptake increases by only 140%. Therefore, some of the new porosity in sample ACBF-900 is not as efficient in hydrogen storage. This is unsurprising given that there is some pore enlargement when BF-900 is activated to ACBF-900. On the other hand, there is a closer match between increases in textural properties for the other three samples after activation and the enhancement in hydrogen uptake. For example, sample ACBF-1000 has a surface area and pore volume increase of ca. 65% and the hydrogen uptake also increases by ca. 65%. In this case the new porosity after activation is of similar dimensions to that present before activation (Fig. 5) and therefore equally efficient in hydrogen storage. Indeed for all the samples there is a much closer match between increase in micropore surface area and micropore volume and the enhancement in hydrogen uptake. This observation is further evidence that micropores are the more important spaces for hydrogen storage.5–10,30–32
The effect of the high microporosity of the present ZIF templated carbons is illustrated in Table 1 by the high hydrogen storage density values of (excepting sample ACBF-900) between 13.3 and 15.4 μmol H2 m−2. The hydrogen storage density values (a snapshot of uptake per surface area) are superior to those reported in the literature for a variety of carbons such as (i) KOH activated CDCs (10 ± 0.7 μmol H2 m−2) and CO2 activated CDCs (9 ± 0.1 μmol H2 m−2) (measured at −196 °C and 60 bar),7c (ii) composites of activated carbon and CNTs (9.55 μmol H2 m−2) (−196 °C and 60 bar)8a and activated carbons, SWNTs, SWNHs, and GCFs (11.75 μmol H2 m−2) (−196 °C and 20 bar)28 and (iii) chemically activated carbons obtained from anthracite (9 ± 0.1 μmol H2 m−2) (−196 °C and 20 bar).8b The hydrogen storage density values are also slightly higher than those we have recently reported for activated zeolite templated carbons20 and activated CDCs,21 and are comparable to the uptake density of activated carbons derived from hydrochar.33 Sample ACBF-900 has a lower hydrogen uptake density (9.7 μmol H2 m−2) due to the presence of mesopores.
Fig. 7a shows a plot of the hydrogen uptake (at 20 bar) as a function of surface area of the ZIF-templated carbons before and after activation wherein an approximately linear relationship is observed. A similar relationship is obtained between hydrogen uptake and pore volume as shown in Fig. 7b. It is noteworthy that all the carbons (except for sample ACBF-900) store more hydrogen than would be expected according to the Chahine rule (i.e., 1 wt% hydrogen stored per 500 m2 g−1 of carbon).34 Therefore the hydrogen uptake of these carbons does not generally fit into the Chahine rule due to higher uptakes per given surface area. We have previously observed similar behaviour for KOH activated zeolite-templated and carbide-derived carbons (CDCs).20,21 On the other hand, the hydrogen uptake of sample ACBF-900 fits into the Chahine rule. We attribute the behaviour of sample ACBF-900 to the presence of small mesopores, while all the other samples possess roughly similar pore size distribution mainly within the micropore range (Fig. 5). This clearly implies that although the mesopores in ACBF-900 contribute to the enhancement in hydrogen uptake, they store less per unit surface area compared to micropores. Indeed a plot of hydrogen uptake as a function of micropore surface area or pore volume (Fig. S7†) shows a linear relationship wherein sample ACBF-900 fits in with the other samples. This observation is consistent with our recent study where we have shown that a linear relationship can exist between the micropore surface area and hydrogen uptake for carbon samples that possess very similar pore size distribution.35 These observations clarify the fact that although a high pore volume is desirable for hydrogen storage, it is more advantageous if a significant proportion or all of the volume is from micropores.
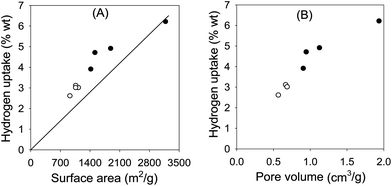 | ||
| Fig. 7 Plot of hydrogen storage capacity as a function of (A) surface area or (B) pore volume of ZIF-templated carbons before (○) and after (●) chemical activation with KOH (at a KOH/carbon ratio of 4) at 700 °C for 1 h. The line in (A) is a Chahine plot.34 | ||
4 Conclusions
We have shown that a commercially available zeolitic imidazolate framework (ZIF), namely Basolite Z1200, may be used to nanocast highly microporous carbon with a surface area of ca. 1000 m2 g−1 and a pore volume of ca. 0.7 cm3 g−1. The ZIF-templated carbons are prepared via liquid impregnation of furfuryl alcohol (FA) into the pores of the ZIF followed by polymerization of the FA and finally carbonization at 900–1100 °C. The ZIF framework is effectively removed during the carbonization step. The ZIF-templated carbons have 90–95% of their surface area arising from micropores. On chemical activation (with KOH at 700 °C for 1 h and a carbon/KOH weight ratio of 1:4), ZIF-templated carbons undergo enhancement of their porosity of between 30 and 240% depending on their carbonization temperature. A sample carbonized at 900 °C has the highest increase of 240% with surface area increasing to ca. 3200 m2 g−1 and pore volume to 1.94 cm3 g−1. Despite the drastic increase in porosity, the activated ZIF-templated carbons retain a predominantly microporous nature with micropores contributing 80–90% of surface area and 60–70% of pore volume. In general, the micropores present in the ZIF-templated carbons are retained after activation with most of the ‘new’ pores generated having dimensions similar to that of the ‘original’ pores. The activation results in an increase in hydrogen uptake capacity (at −196 °C and 20 bar) of between 25 and 140% from 2.6–3.1 wt% to the range 3.9–6.2 wt%. The increase in hydrogen uptake is strongly linked to rises in the micropore surface area and micropore volume. Especially remarkable is the case of the activated carbon obtained via carbonisation at 900 °C, which exhibits a surface area of ∼3200 m2 g−1 after activation and a hydrogen storage capacity of 6.2 wt% (at 20 bar and −196 °C).
Acknowledgements
This research was funded by the University of Nottingham. A. A. thanks King Abdulaziz University, Saudi Arabia, for a scholarship.References
- L. Schlapbach and A. Zuttel, Nature, 2001, 414, 353 CrossRef CAS.
- (a) Y. H. Hu and L. Zhang, Adv. Mater., 2010, 22, E117–E130 CrossRef CAS; (b) M. Hirscher, B. Panella and B. Schmitz, Microporous Mesoporous Mater., 2010, 129, 335 CrossRef CAS; (c) L. J. Murray, M. Dinca and J. R. Long, Chem. Soc. Rev., 2009, 38, 1294 RSC; (d) X. Lin, J. H. Jia, P. Hubberstey, M. Schroder and N. R. Champness, CrystEngComm, 2007, 9, 438 RSC.
- (a) D. J. Collins and H. C. Zhou, J. Mater. Chem., 2007, 17, 3154 RSC; (b) D. Zhao, D. Q. Yuan and H. C. Zhou, Energy Environ. Sci., 2008, 1, 222 RSC.
- (a) J. X. Dong, X. Y. Wang, H. Xu, Q. Zhao and J. Li, Int. J. Hydrogen Energy, 2007, 32, 4998 CrossRef CAS; (b) J. Weitkamp, M. Ftritz and S. Ernst, Int. J. Hydrogen Energy, 1995, 12, 967 CrossRef; (c) Y. W. Li and R. T. Yang, J. Phys. Chem. B, 2006, 110, 17175 CrossRef CAS.
- (a) Z. Yang, Y. Xia and R. Mokaya, J. Am. Chem. Soc., 2007, 129, 1673 CrossRef CAS; (b) A. Pacula and R. Mokaya, J. Phys. Chem. C, 2008, 112, 2764 CrossRef CAS; (c) N. Alam and R. Mokaya, Energy Environ. Sci., 2010, 3, 1773 RSC; (d) Z. Yang, Y. Xia, X. Sun and R. Mokaya, J. Phys. Chem. B, 2006, 110, 18424 CrossRef CAS; (e) L. Chen, R. K. Singh and P. Webley, Microporous Mesoporous Mater., 2007, 102, 159 CrossRef CAS; (f) Y. Xia, Z. Yang and R. Mokaya, Chem. Vap. Deposition, 2010, 16, 322 CrossRef CAS; (g) N. Alam and R. Mokaya, Microporous Mesoporous Mater., 2011, 142, 716 CrossRef CAS; (h) N. Alam and R. Mokaya, Microporous Mesoporous Mater., 2011, 144, 140 CrossRef CAS.
- (a) Y. Xia and R. Mokaya, J. Phys. Chem. C, 2007, 111, 10035 CrossRef CAS; (b) Z. X. Wu, Y. X. Yang, D. Gu, Y. P. Zhai, D. Feng, Q. Li, B. Tu, P. A. Webley and D. Y. Zhao, Top. Catal., 2009, 52, 12 CrossRef CAS; (c) A. Pacula and R. Mokaya, Microporous Mesoporous Mater., 2007, 106, 147 CrossRef CAS.
- (a) Y. Gogotsi, R. K. Dash, G. Yushin, T. Yildirim, G. Laudisio and J. E. Fischer, J. Am. Chem. Soc., 2005, 127, 16006 CrossRef CAS; (b) G. Yushin, R. Dash, J. Jagiello, J. E. Fischer and Y. Gogotsi, Adv. Funct. Mater., 2006, 16, 2288 CrossRef CAS; (c) Y. Gogotsi, C. Porteta, S. Osswald, J. M. Simmons, T. Yildirim, G. Laudisio and J. E. Fischer, Int. J. Hydrogen Energy, 2009, 34, 6314 CrossRef CAS.
- (a) B. Panella, M. Hirscher and S. Roth, Carbon, 2005, 43, 2209 CrossRef CAS; (b) M. Jordá-Beneyto, F. Suárez-García, D. Lozano-Castelló, D. Cazorla-Amorós and A. Linares-Solano, Carbon, 2007, 45, 293 CrossRef; (c) K. M. Thomas, Catal. Today, 2007, 120, 389 CrossRef CAS; (d) N. Texier-Mandoki, J. Dentzer, T. Piquero, S. Saadallah, P. David and C. Vix-Guterl, Carbon, 2004, 42, 2744 CrossRef CAS.
- (a) H. Wang, Q. Gao and J. Hu, J. Am. Chem. Soc., 2009, 131, 7016 CrossRef CAS; (b) M. Sevilla, R. Mokaya and A. B. Fuertes, Energy Environ. Sci., 2011, 4(8), 2930 RSC.
- (a) H. M. Cheng, Q. H. Yang and C. Liu, Carbon, 2001, 39, 1447 CrossRef CAS; (b) A. C. Dillon and M. J. Heben, Appl. Phys. A: Mater. Sci. Process., 2001, 72, 133 CrossRef CAS; (c) R. Strobel, J. Garche, P. T. Moseley, L. Jorissen and G. Wolf, J. Power Sources, 2006, 159, 781 CrossRef.
- (a) S. J. Allen, L. Whitten and G. Mckay, Dev. Chem. Eng. Miner. Process., 1998, 6, 231 Search PubMed; (b) J. A. Maciá-Agulló, B. C. Moore, D. Cazorla-Amorós and A. Linares-Solano, Carbon, 2004, 42, 1367 CrossRef; (c) D. Lozano-Castelló, M. A. Lillo-Róndeas, D. Cazorla-Amorós and A. Linares-Solano, Carbon, 2001, 39, 741 CrossRef; (d) D. Lozano-Castelló, D. Cazorla-Amorós and A. Linares-Solano, Fuel Process. Technol., 2002, 77–78, 325 CrossRef.
- (a) M. Wu, Q. Zha, J. Qiu, Y. Guo, H. Shang and A. Yuan, Carbon, 2004, 42, 205 CrossRef CAS; (b) K. Kierzek, E. Frackowiak, G. Lota, G. Gryglewicz and J. Machnikowski, Electrochim. Acta, 2004, 49, 515 CrossRef CAS; (c) W. Qiao, L. Ling, Q. Zha and L. J. Liu, J. Mater. Sci., 1997, 32, 4447 CrossRef CAS.
- B. Sakintuna and Y. Yurum, Ind. Eng. Chem. Res., 2005, 44, 2893 CrossRef CAS.
- (a) J. Lee, J. Kim and T. Hyeon, Adv. Mater., 2006, 18, 2073 CrossRef CAS; (b) C. Liang, Z. Li and S. Dai, Angew. Chem., Int. Ed., 2008, 47, 3696 CrossRef CAS; (c) A. Stein, Z. Y. Wang and M. A. Fierke, Adv. Mater., 2009, 21, 265 CrossRef CAS; (d) Y. Xia, Z. Yang and R. Mokaya, Nanoscale, 2010, 2, 639 RSC; (e) A. H. Lu and F. Schuth, Adv. Mater., 2006, 18, 1793 CrossRef CAS; (f) H. Yang and D. Zhao, J. Mater. Chem., 2005, 15, 1217 CAS; (g) J. Lee, S. Han and T. Hyeon, J. Mater. Chem., 2004, 14, 478 RSC.
- (a) T. Kyotani, Carbon, 2000, 38, 269 CrossRef CAS; (b) T. Kyotani, Z. Ma and A. Tomita, Carbon, 2003, 41, 1451 CrossRef CAS; (c) R. Ryoo, S. H. Joo, M. Kruk and M. Jaroniec, Adv. Mater., 2001, 13, 677 CrossRef CAS.
- (a) B. Liu, H. Shioyama, T. Akita and Q. Xu, J. Am. Chem. Soc., 2008, 130, 5390 CrossRef CAS; (b) B. Liu, H. Shioyama, H. L. Jiang, X. B. Zhang and Q. Xu, Carbon, 2010, 48, 456 CrossRef CAS.
- M. Choi and R. Ryoo, J. Mater. Chem., 2007, 17, 4204 RSC.
- J. Gorka, A. Zawialak, J. Choma and M. Jaroniec, Carbon, 2008, 46, 1159 CrossRef CAS.
- (a) J. A. Hu, H. L. Wang, Q. M. Gao and H. L. Guo, Carbon, 2010, 48, 3599 CrossRef CAS; (b) H. L. Wang, Q. M. Gao, J. Hu and Z. Chen, Carbon, 2009, 47, 2259 CrossRef CAS; (c) K. S. Xia, Q. M. Gao, C. D. Wu, S. Q. Song and M. L. Ruan, Carbon, 2007, 45, 1989 CrossRef CAS; (d) Z. J. Zheng, Q. M. Gao and J. H. Jiang, Carbon, 2010, 48, 2968 CrossRef CAS; (e) K. S. Xia, Q. M. Gao, S. Q. Song, C. D. Wu, J. H. Jiang, J. Hu and L. Gao, Int. J. Hydrogen Energy, 2008, 33, 116 CrossRef CAS.
- M. Sevilla, N. Alam and R. Mokaya, J. Phys. Chem. C, 2010, 114, 11314 CAS.
- (a) M. Sevilla and R. Mokaya, J. Mater. Chem., 2011, 21, 4727 RSC; (b) M. Sevilla, R. Foulston and R. Mokaya, Energy Environ. Sci., 2010, 3, 223 RSC.
- K. S. Park, Z. Ni, A. P. Cote, J. Y. Choi, R. Huang, F. J. Uribe-Romo, H. K. Chae, M. O'Keeffe and O. M. Yaghi, Proc. Natl. Acad. Sci. U. S. A., 2006, 103, 10186 CrossRef CAS.
- K. P. Gierszal, M. Jaroniec, T. W. Kim, J. Kimb and R. Ryoo, New J. Chem., 2008, 32, 981 RSC.
- Y. D. Xia, R. Mokaya, D. M. Grant and G. S. Walker, Carbon, 2011, 49, 844 CrossRef CAS.
- S. R. Venna and M. A. Carreon, J. Am. Chem. Soc., 2010, 132, 76 CrossRef CAS.
- C. Guan, K. Wang, C. Yang and X. S. Zhao, Microporous Mesoporous Mater., 2009, 118, 503 CrossRef CAS.
- Y. Kojima, Y. Kawai, A. Koiwai, N. Suzuki, T. Haga, T. Hioki and K. J. Tange, J. Alloys Compd., 2006, 421, 204 CrossRef CAS.
- W.-C. Xu, K. Takahashi, Y. Matsuo, Y. Hattori, M. Kumagai, S. Ishiyama, K. Kaneko and S. Iijima, Int. J. Hydrogen Energy, 2007, 32, 2504 CrossRef CAS.
- K. Xia, Q. Gao, S. Song, C. Wu, J. Jiang, J. Hu and L. Gao, Int. J. Hydrogen Energy, 2008, 33, 116 CrossRef CAS.
- (a) N. Texier-Mandoki, J. Dentzer, T. Piquero, S. Saadallah, P. David and C. Vix-Guterl, Carbon, 2004, 42, 2744 CrossRef CAS; (b) M. A. de la Casa-Lillo, F. Lamari-Darkrim, D. Cazorla-Amoros and A. Linares-Solano, J. Phys. Chem. B, 2002, 106, 10930 CrossRef CAS; (c) C. Vix-Guterl, E. Frackowiak, K. Jurewicz, M. Friebe, J. Parmentier and F. Beguin, Carbon, 2005, 43, 1293 CrossRef CAS.
- (a) M. Armandi, B. Bonelli, C. O. Arean and E. Garrone, Microporous Mesoporous Mater., 2008, 112, 411 CrossRef CAS; (b) I. Cabria, M. J. Lopez and J. A. Alonso, Carbon, 2007, 45, 2649 CrossRef CAS.
- (a) E. Terres, B. Panella, T. Hayashi, Y. A. Kim, M. Endo, J. M. Dominguez, M. Hirscher, H. Terrones and M. Terrones, Chem. Phys. Lett., 2005, 403, 363 CrossRef CAS; (b) J. Pang, J. E. Hampsey, Z. Wu, Q. Hu and Y. Lu, Appl. Phys. Lett., 2004, 85, 4887 CrossRef CAS.
- M. Sevilla, A. B. Fuertes and R. Mokaya, Energy Environ. Sci., 2011, 4, 1400 CAS.
- E. Poirier, R. Chahine and T. K. Bose, Int. J. Hydrogen Energy, 2001, 26, 831 CrossRef CAS.
- Y. Xia, G. S. Walker, D. M. Grant and R. Mokaya, J. Am. Chem. Soc., 2009, 131, 16493 CrossRef CAS.
Footnote |
| † Electronic supplementary information (ESI) available: Seven additional figures, powder XRD pattern, TGA curve, nitrogen sorption isotherm and PSD curve of commercially available ZIF (Basolite Z1200), powder XRD pattern and TGA curve of ZIF/FA composite (after heating at 80 °C for 24 h and then at 150 °C for 6 h under Ar), PSD curves of ZIF templated carbons, nitrogen sorption isotherms of ZIF templated carbons before and after activation, and plot of hydrogen storage capacity of ZIF templated carbons before and after activation as a function of micropore surface area and micropore volume. See DOI: 10.1039/c1jm13314d |
| This journal is © The Royal Society of Chemistry 2012 |