Supramolecular mechanisms in the synthesis of mesoporous magnetic nanospheres for hyperthermia†
Daniel
Arcos
ab,
Vanesa
Fal-Miyar
ab,
Eduardo
Ruiz-Hernández
ab,
Mar
Garcia-Hernández
c,
M. Luisa
Ruiz-González
d,
José
González-Calbet
d and
María
Vallet-Regí
*ab
aDepartamento de Química Inorgánica y Bioinorgánica, Fac. Farmacia, Universidad Complutense de Madrid (UCM), 28040, Madrid, Spain. E-mail: vallet@farm.ucm.es; Fax: +34 91 3941796; Tel: +34 91 394 1843
bCentro de Investigación Biomédica en Red de Bioingeniería, Biomateriales y Nanomedicina (CIBER-BBN), Madrid, Spain
cInstituto de Ciencia de Materiales Madrid, CSIC, Cantoblanco, 28049, Madrid, Spain
dDpto Química Inorgánica, Fac. C.C. Químicas, Universidad Complutense de Madrid (UCM), 28040, Madrid, Spain
First published on 11th October 2011
Abstract
The present work deals with the preparation of magnetic mesoporous nanocomposites with potential application for cancer treatment. The supramolecular mechanisms that govern the incorporation of γ-Fe2O3 nanoparticles into mesoporous silica spheres have been deeply analyzed. The modification of γ-Fe2O3 nanoparticles during the encapsulation into mesoporous SiO2 has been studied. The alkaline conditions of these processes lead to an enlargement of maghemite nanoparticles. We hypothesize that this particle enlargement results from Fe3+ cations present in solution. The results presented in this work indicate the importance of the appropriate surface functionalization to incorporate nanosystems into mesoporous silica materials, as well as the modifications that magnetic nanoparticles undergo during the process. Finally, the ability to produce magnetic hyperthermia makes this material a very promising candidate for multifunctional thermoseeds for cancer treatment.
Introduction
In the last decade, mesoporous magnetic nanocomposites (MMNs) have awakened a great scientific and technological interest.1–6 These systems combine the properties of magnetic nanoparticles (MNPs)7,8 with the outstanding textural properties of mesoporous materials.9–13 In this sense, MMNs exhibit high potential in the field of catalysis14,15 but also for biomedical and biotechnological applications, such as drug/gene delivery systems,16–19 NMR imaging,20,21 enzyme immobilization,22 cellular uptake23 and as thermoseeds for cancer treatment by hyperthermia.24Some authors have developed strategies based on impregnation of the mesoporous particles with the magnetic precursor.25,26 However, the most common strategy to prepare mesoporous magnetic nanocomposites encompasses the previous synthesis of MNPs like Fe3O4, γ-Fe2O3, etc. Thereafter, these MNPs are encapsulated into mesoporous particles (commonly silica) with controlled size and shape. For this purpose, C. Sanchez et al.27,28 and our research group29–31 have independently applied aerosol assisted techniques to obtain encapsulated NP into mesoporous silica microspheres. Although MMNs prepared by this method have demonstrated high potential for some biomedical applications, the microspheres obtained exhibit some degree of polydispersity, thus ranging in size between 200 and 4000 nm.
The most used strategies to obtain nanometrical and monodisperse MMNs are those based on the precipitation in alkaline media.1 This procedure is commonly based on a sol–gel process involving alkoxysilanes in the presence of a cationic structure directing agent.32 Commonly, the efficient incorporation of the MNPs requires the preparation of reverse microemulsions33,34 or, as an alternative, a phase-transfer process from an organic medium to an aqueous solution prior to the encapsulation within the mesoporous silica nanospheres.22,35–37 These procedures have resulted in MMNs with excellent magnetic properties and mesoporous ordering.
In this work, we have studied the mechanisms followed by functionalized γ-Fe2O3 nanoparticles to be encapsulated into silica mesoporous nanospheres. These nanocomposites have been designed to be used as thermoseeds for the cancer treatment by hyperthermia. In addition, the mesoporous SiO2 spheres could provide an excellent matrix for loading and release of antitumoral drugs.10–13 One of the questions most commonly considered when preparing MMNs is the extent of the defects, which are undergone by the mesoporous structure due to the incorporation of high amounts of MNPs. In this work we raise the opposite question, that is, to what extent MNPs are affected by the encapsulation process. The results obtained in this topic demonstrate that MNPs can undergo significant changes, which should be taken into account when preparing MMNs.
Materials and methods
γ-Fe2O3 magnetic nanoparticles have been synthesized following the Massart method.38 The solutions have been prepared by coprecipitation of ferric chloride and ferrous chloride (molar ratio 2![[thin space (1/6-em)]](https://www.rsc.org/images/entities/char_2009.gif) :
:![[thin space (1/6-em)]](https://www.rsc.org/images/entities/char_2009.gif) 1) in ammonium hydroxide. After removing the supernatant, the oxidation process has been performed with nitric acid 2 M followed by a ferric nitrate solution (0.33 M) heated at 100 °C with a vigorous stirring during 30 minutes. The obtained product was washed with acetone several times and resuspended in water to obtain a ferrofluid with 100 mg ml−1 of γ-Fe2O3 magnetic nanoparticles.
1) in ammonium hydroxide. After removing the supernatant, the oxidation process has been performed with nitric acid 2 M followed by a ferric nitrate solution (0.33 M) heated at 100 °C with a vigorous stirring during 30 minutes. The obtained product was washed with acetone several times and resuspended in water to obtain a ferrofluid with 100 mg ml−1 of γ-Fe2O3 magnetic nanoparticles.
Coating process
Three different series of magnetic mesoporous spheres were obtained through a coating/encapsulation 2-stage process (Scheme 1). Firstly, encapsulation of pure maghemite was attempted without any coating (sample γ-Fe2O3-0).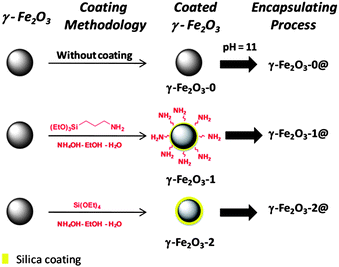 | ||
| Scheme 1 Schematic diagram of the magnetic nanoparticles coating and encapsulation process. | ||
The second series of maghemite nanoparticles (γ-Fe2O3-1) was coated with aminopropyltriethoxysilane (APTES), following a method previously described by Mornet et al.39
Another set of magnetic nanoparticles was coated with silica by using tetraethylorthosilicate (TEOS) hydrolysis in basic media (γ-Fe2O3-2).40
Encapsulation process
The preparation of mesoporous silica microspheres from solubilised silica precursors implies the use of cationic surfactants in basic medium (pH = 11). This procedure was developed by Grün et al.32 and our aim is to combine it with ferrofluids, thus supplying magnetic properties to these materials. For this purpose, the corresponding magnetic ferrofluid (γ-Fe2O3-0, γ-Fe2O3-1 or γ-Fe2O3-2), hexadecyltrimethylammonium bromide (CTAB), ethanol, ammonium hydroxide and distilled water were stirred for 15 min with a molar ratio of 1![[thin space (1/6-em)]](https://www.rsc.org/images/entities/char_2009.gif) :
:![[thin space (1/6-em)]](https://www.rsc.org/images/entities/char_2009.gif) 3.75
3.75![[thin space (1/6-em)]](https://www.rsc.org/images/entities/char_2009.gif) :
:![[thin space (1/6-em)]](https://www.rsc.org/images/entities/char_2009.gif) 710
710![[thin space (1/6-em)]](https://www.rsc.org/images/entities/char_2009.gif) :
:![[thin space (1/6-em)]](https://www.rsc.org/images/entities/char_2009.gif) 140
140![[thin space (1/6-em)]](https://www.rsc.org/images/entities/char_2009.gif) :
:![[thin space (1/6-em)]](https://www.rsc.org/images/entities/char_2009.gif) 1700. Then, TEOS (17.9 mmol) was added. After 2 hours of additional vigorous stirring, the precipitate was centrifuged and washed with distilled water. The dried powder was calcined at 425 °C in air for 3 hours with a heating rate of 5 °C min−1 to remove the template. All the samples were dried in order to be used for the powder studies at 60 °C for 3 days.
1700. Then, TEOS (17.9 mmol) was added. After 2 hours of additional vigorous stirring, the precipitate was centrifuged and washed with distilled water. The dried powder was calcined at 425 °C in air for 3 hours with a heating rate of 5 °C min−1 to remove the template. All the samples were dried in order to be used for the powder studies at 60 °C for 3 days.
For simplicity, the encapsulated pure maghemite samples were denoted as γ-Fe2O3-0@ and the previously coated samples were denoted as γ-Fe2O3-1@ and γ-Fe2O3-2@ for APTES and silica coated samples, respectively.
Characterization of materials
The size and the zeta potential determined by Dynamic Light Scattering and electrophoretic mobility, respectively, were carried out in a Zetasizer Nano ZS (Malvern Instruments) with a 633 nm laser. The ferrofluid was added to 10 ml of distilled water (used as the supporting electrolyte). The pH was adjusted by the multipurpose titrator MPT-2 adding volumes of 0.01 M and 0.05 M NaOH solutions.Transmission electron microscopy (TEM) was carried out with a JEOL JEM 2000 FX microscope operated at 200 kV. Particles were dried and suspended in acetone. A few drops were placed onto the copper grid and allowed to dry at room temperature.
A scanning electron microscope (JSM 74001F, Jeol, Japan) equipped with an energy dispersive X-ray spectrometer (EDS-INCA system, Oxford Instruments) was used to investigate the chemical composition of mesoporous magnetic nanocomposites. In order to confirm the MNPs encapsulation, cross-section polishing (CP) using an Argon ion beam was carried out on the materials.
The X-ray diffraction (XRD) patterns were recorded with a Philips X'Pert diffractometer using the Cu Kα radiation (wavelength 1.5406 Å). Rietveld refinements were carried out using the atomic position set and the space group of the maghemite structure, Fd3m, by means of the FullProf 2000 computer program.
Hysteresis loops at room temperature (RT) were obtained with a vibrating sample magnetometer (VSM) LakeShore 7304 in applied magnetic field between ±1.5 × 10⁴ Oe. Magnetization measurements M(T,H) in applied magnetic fields between ±5 × 10⁴ Oe at 4.2 K were performed in powders conditioned in gelatine capsules with a Quantum Design SQUID magnetometer. DC magnetization was measured after cooling the sample both in Zero-Field-Cooled (ZFC) and Field-Cooled (FC) magnetic conditions, being the measuring field 50 Oe and the cooling field 50 kOe.
The heating behaviour of magnetic mesoporous particles was studied at an AC magnetic field of 15 kA m−1 with a frequency of 100 kHz. The mesoporous magnetic particles were dispersed in distilled water under ultrasonication to create a ferrofluid with a concentration of 75 mg ml−1. Thermally insulated Petri dish containing 2 ml of ferrofluid was placed within a water-cooled copper coil driven by a CELES generator. A Luxtron I652 Fluoroptic® thermometer unit connected to a computer was used to measure the ferrofluid temperature.
Results
Fig. 1 shows the variations of zeta potential as a function of pH on MNPs with different coatings. The uncoated nanoparticles, γ-Fe2O3-0, show the characteristic neutral isoelectric point (IP) of maghemite at pH = 7.3. The amino groups present in the surface of γ-Fe2O3-1 produce an IP shift towards higher pH values (pH = 9.1). On the other hand, the silica layer in γ-Fe2O3-2 sample induces an IP shifted towards lower values of pH (4.8). The studies by DLS showed single-modal distributions of particle sizes in all cases. As can be seen in Table 1, the hydrodynamic size of maghemite nanoparticles clearly increases with the coating process, especially when coating with SiO2 (γ-Fe2O3-2). These results point out the efficiency of the coating process with these agents.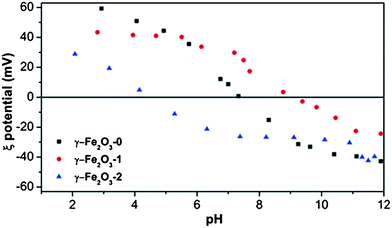 | ||
| Fig. 1 Zeta potential measurements as a function of pH of maghemite nanoparticles (γ-Fe2O3-0), APTES coated maghemite nanoparticles (γ-Fe2O3-1) and silica coated maghemite nanoparticles (γ-Fe2O3-2). | ||
| Sample | Coating | Isoelectric point (IP) | Ø p /nm |
|---|---|---|---|
| a Diameter of the particles by Dynamic Light Scattering. | |||
| γ-Fe2O3-0 | — | 7.3 | 8 |
| γ-Fe2O3-1 | NH2 | 9.1 | 18 |
| γ-Fe2O3-2 | SiO2 | 4.8 | 38 |
After the assessment of γ-Fe2O3 nanoparticles coating, we proceeded with the attempts to encapsulate them into mesoporous silica as described in the Materials and methods section and in ref. 32. Fig. 2 shows the TEM images obtained for the three attempts. In some images the particles appear as aggregated as a consequence of the sample preparation for the experiment. Fig. 2a and b correspond to γ-Fe2O3-0@. γ-Fe2O3 nanoparticles (darker contrast) appear as clearly segregated phases to the SiO2 mesoporous particles, which appear as larger mesoporous spheres at the right side. Fig. 2c and d correspond to γ-Fe2O3-1@ sample. In this case, mesoporous particles containing nanoparticles are observed, demonstrating the successful encapsulation of γ-Fe2O3-1 nanoparticles. The darker contrast can be distinguished within the mesoporous particles. Finally, Fig. 2e and f show the attempts for encapsulating γ-Fe2O3-2 nanoparticles, i.e. those previously coated with an inorganic SiO2 layer. The images are representative of the general scenario for this attempt and exhibit a complete segregation of γ-Fe2O3-2 nanoparticles with respect to silica mesoporous spheres.
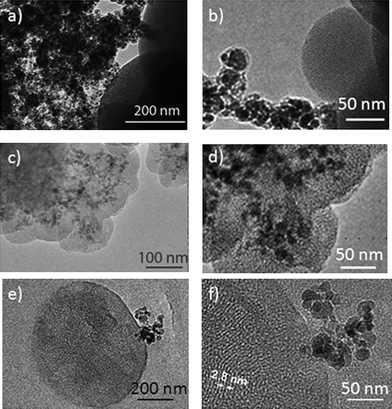 | ||
| Fig. 2 TEM images of the microspheres after the encapsulation process of γ-Fe2O3-0@ (a and b), γ-Fe2O3-1@ (c and d) and γ-Fe2O3-2@ (e and f). | ||
Since TEM images indicate that only γ-Fe2O3-1@ is successfully incorporated into the SiO2 mesoporous particles, we decided to carry out deeper studies on this sample. HR-TEM study provides valuable information about the encapsulation process as can be seen in Fig. 3. The size of these mesoporous particles could be estimated to be between 50 and 150 nm and, in some cases, γ-Fe2O3-1 nanoparticles are individually encapsulated into a SiO2 mesoporous sphere as observed in Fig. 3a. Fig. 3b and c display the characteristics of the γ-Fe2O3 nanocrystals of around 10–15 nm in diameter. It should be noticed that the nanoparticles contrast at the HREM images are very poor (Fig. 3b and c) since they are embedded in a mesoporous SiO2 matrix. In spite of it, it can be observed that the particles are crystalline and the interatomic distances are in agreement with the γ-Fe2O3 unit cell. Even more, due to the magnetic properties of the samples they have been embedded in a polymer in order to avoid the damage of the microscope lens and then making difficult the observation.
![(a) TEM image obtained for γ-Fe2O3-1@ with individual MNPs coated by SiO2. (b and c) HRTEM images show γ-Fe2O3 nanoparticles exhibiting an ordered contrast with a periodicity of 0.3 nm. The FFT showed in the inset of (c) is in agreement with a γ-Fe2O3 cell along [001] zone axis.](/image/article/2012/JM/c1jm13102h/c1jm13102h-f3.gif) | ||
| Fig. 3 (a) TEM image obtained for γ-Fe2O3-1@ with individual MNPs coated by SiO2. (b and c) HRTEM images show γ-Fe2O3 nanoparticles exhibiting an ordered contrast with a periodicity of 0.3 nm. The FFT showed in the inset of (c) is in agreement with a γ-Fe2O3 cell along [001] zone axis. | ||
Fig. 4 shows the study of the particle size and morphology for γ-Fe2O3-1@ mesoporous spheres. Fig. 4a shows a set of well defined spherical particles with a diameter ranging between 100 and 200 nm. DLS studies (Fig. 4b) confirm this observation, since a single modal size distribution centred at 150 nm is observed. It must be highlighted that no distribution appears around 18 nm, which would correspond to non-encapsulated γ-Fe2O3-1 MNPs.
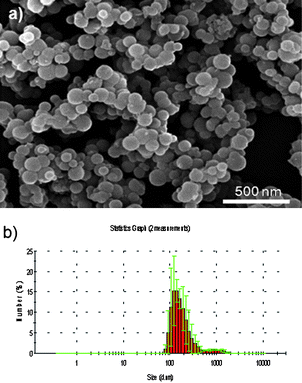 | ||
| Fig. 4 (a) SEM micrograph obtained for Fe2O3-1@ microspheres. (b) DLS analysis for Fe2O3-1@ demonstrating a single modal distribution centered around 200 nm. | ||
Fig. 5 (top) shows a HR-SEM micrograph of a γ-Fe2O3-1@ mesoporous sphere. In order to observe the incorporation of γ-Fe2O3 nanoparticles, cross-section polishing (CP) using an Argon ion beam was carried out on the silica sphere. Small agglomerates of nanoparticles can be observed inside the spheres. The EDX spectra taken from the nanoparticle agglomerates demonstrate the presence of iron, in a different way than the smooth areas where only silicon is observed. These results completely agree with the EDX experiments carried out during HRTEM observations (Fig. 5, bottom).
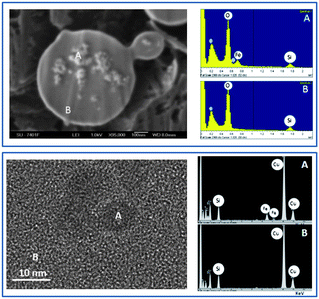 | ||
| Fig. 5 (Top) HRSEM image obtained for a Fe2O3-1@ microsphere after treatment with Ar ion beam. The image of the resulting hemisphere demonstrates the encapsulation of γ-Fe2O3 as confirmed by the corresponding EDX analysis. (Bottom) TEM image of a γ-Fe2O3 nanoparticle successfully encapsulated into mesoporous SiO2 as confirmed by the corresponding EDX analysis. | ||
Fig. 6 shows the wide angle XRD patterns and Rietveld refinements for pure maghemite nanoparticles γ-Fe2O3-0 and the pattern for the encapsulated sample γ-Fe2O3-1@. All the diffraction maxima can be assigned to a spinel-like phase as corresponding for maghemite. In addition a wide scattering signal is observed at low angle in the case of γ-Fe2O3-1@, as a consequence of the amorphous silica having part in this material.
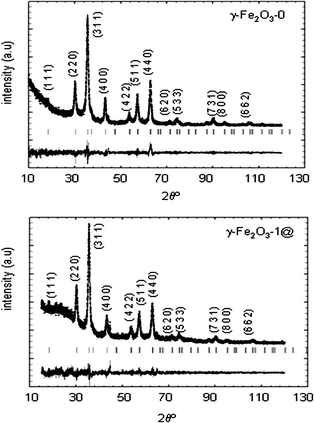 | ||
| Fig. 6 XRD patterns and Rietveld refinements of non-treated maghemite nanoparticles (γ-Fe2O3-0) and encapsulated nanoparticles into mesoporous silica Fe2O3-1@. | ||
Lattice parameters, (Fe)–O–[Fe] distances and angles as well as the chemical formula calculated from occupancy factors are shown in Table 2. These data are in agreement with a γ-Fe2O3 phase, exhibiting additional vacancies when compared with the theoretical occupancy considered for stoichiometric γ-Fe2O3,41 that is (Fe)[Fe1.67□0.33]O4. From the occupancy factor refinements, the vacancies in samples Fe2O3-0 and γ-Fe2O3-1@ are distributed in both tetrahedral and octahedral sites.
| Sample | a/Å | (Fe)–O–[Fe] distance/Å | (Fe)–O–[Fe] angle | Formulaa |
|---|---|---|---|---|
| a Calculated from refined occupancy factors. (Fe)[Fe1.67□0.33] O4 is considered as stoichiometric formula for maghemite. | ||||
| γ-Fe2O3-0 | 8.3552 (8) | 3.464 (0) | 123.9 (2) | (Fe0.83□0.17) [Fe1.55□0.45]O4 |
| γ-Fe2O3-1@ | 8.3486 (11) | 3.461 (0) | 124.3 (2) | (Fe0.90□0.10) [Fe1.50□0.50]O4 |
A detailed study of the crystallite size and strains of γ-Fe2O3 nanoparticles was carried out. Crystal size, maximum strains and agreement factors for the refinements are displayed in Table 3. The encapsulated magnetic nanoparticles, γ-Fe2O3-1@, undergo a significant size and strain increase with respect to non-treated maghemite. This fact was also observed when Rietveld refinements were made on γ-Fe2O3-0@ and also for γ-Fe2O3-2@ (see ESI†), indicating that γ-Fe2O3 nanoparticles grow during the coating/encapsulation process.
| Sample | Crystal sizea/nm | Maximum straina (%%) | R p | R wp | R Bragg | χ 2 |
|---|---|---|---|---|---|---|
| a The standard deviations appearing in the global average apparent size and strain are calculated using the different reciprocal lattice directions. It is a measure of the degree of anisotropy, not of the estimated error. | ||||||
| γ-Fe2O3-0 | 8.12 (1) | 16.72 (1) | 9.75 | 14.5 | 5.12 | 1.27 |
| γ-Fe2O3-1@ | 9.82 (1) | 39.43 (3) | 8.17 | 11.7 | 5.61 | 1.16 |
Fig. 7a shows the magnetization curves at room temperature (RT), as a function of the applied magnetic field for γ-Fe2O3-0 and γ-Fe2O3-1@ magnetic mesoporous microparticles. The saturation magnetization (Ms) of γ-Fe2O3-0 is 61.2 emu g−1 which is a typical value for maghemite nanoparticles.42 The magnetization curve corresponding to γ-Fe2O3-1@ sample has been normalized taking into account the % weight of maghemite determined by ICP spectroscopy (in this case 15.02% in weight). In this way, the magnetization curve displayed in emu g−1 refers only to maghemite encapsulated, discarding the SiO2 present in this sample. In this way, the possible differences between γ-Fe2O3 nanoparticles before and after encapsulation can be determined. Both curves indicate a superparamagnetic behaviour as can be deduced for the nearly zero coercive forces. In addition, a slight decrease of Ms value can be observed for γ-Fe2O3-1@ (57.4 emu g−1) with respect to γ-Fe2O3-0 (61.23 emu g−1). Since both values are expressed in terms of maghemite mass, the lower Ms value of γ-Fe2O3-1@ indicates that γ-Fe2O3 nanoparticles exhibit some degree of magnetic disorder in this sample, with respect to γ-Fe2O3 nanoparticles before being encapsulated into mesoporous silica.
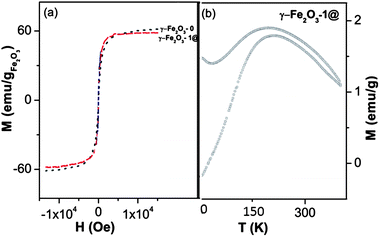 | ||
| Fig. 7 (a) Room temperature magnetic hysteresis loops of pure maghemite (γ-Fe2O3-0), and γ-Fe2O3-1@ obtained by VSM. (b) ZFC and FC magnetizations for γ-Fe2O3-1@ measured as a function of temperature. | ||
Magnetization measurements M(T,H) in applied magnetic fields between ±5 × 10⁴ Oe at 4.2 K were then performed. The magnetic parameters are displayed in Table 4, together with those obtained at 298 K (RT). In contrast to Ms values obtained at RT for γ-Fe2O3-1@ and γ-Fe2O3-0, the Ms values at 4.2 K are identical in both samples. These results indicate a misalignment of the antiferromagnetic sub-lattices at RT in γ-Fe2O3 nanoparticles after the coating/encapsulation process. This result would agree with the highest crystal strains calculated for γ-Fe2O3-1@ by the Rietveld refinements. Finally, the coercive field differences for samples γ-Fe2O3-1@ and γ-Fe2O3-0, although small, indicate a larger amount of pinning centres (defects) in the maghemite cores after the successful coating/encapsulation process.
Fig. 7b illustrates the ZFC/FC behaviour of the magnetic nanoparticles incorporated into the mesoporous matrix γ-Fe2O3-1@. The blocking temperature of this sample around 200 K gives an estimation of the size of the magnetic core around 5.3 nm using the relationship TB = KV/25kB, where K is the anisotropy constant and kB the Boltzmann constant. This size refers to the magnetic effective size of the encapsulated nanoparticles, pointing out that the magnetic volume is smaller than the crystallite size determined by XRD (9.82 nm as shown in Table 3). The broad peaks of ZFC curves also reveal the existence of aggregated and magnetic interactions between magnetic nanoparticles.
The in vitro hyperthermia capability of γ-Fe2O3-1@ was studied applying an alternating magnetic field of 15 kA m−1 and 100 kHz (Fig. 8). For comparison purposes, the temperature evolution for the ferrofluid of bare γ-Fe2O3 nanoparticles is also shown. The ferrofluid made of γ-Fe2O3 nanoparticles reaches the temperature equilibrium at 55 °C, out of the hyperthermia range. Encapsulated maghemite nanoparticles of γ-Fe2O3-1@ are able to heat the environment to 45 °C in 30 min, using concentrations of 75 mg ml−1. This temperature is in the hyperthermia range for the treatment of solid tumours, i.e. between 42 and 47 °C. The specific absorption rate (SAR) is used as the power of heating of a material per gram. SAR was defined as follows:
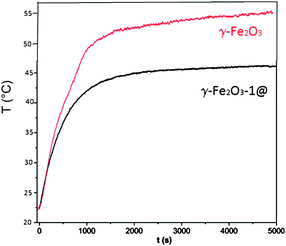 | ||
| Fig. 8 Temperature evolution as a function of time of hyperthermia experiment with the γ-Fe2O3-1@ sample. For comparison purposes, plot for bare γ-Fe2O3 nanoparticles (100 mg ml−1) is also shown. | ||
Discussion
MMNs have been prepared through the encapsulation of γ-Fe2O3 nanoparticles within mesoporous silica spheres. The encapsulation process involves alkaline pH values and the presence of a cationic surfactant such as C16TAB. The results described in this work evidence that previous surface functionalization is required for incorporating the magnetic nanoparticles into the mesoporous spheres.TEM, HRTEM and HRSEM together with EDX spectroscopy demonstrate that only those maghemite nanoparticles functionalized with APTS can be encapsulated into mesoporous silica microspheres. In contrast, pristine γ-Fe2O3 nanoparticles and SiO2 coated nanoparticles are mostly segregated out of the mesoporous microspheres.
In order to understand the mechanisms involved in the success or failure of encapsulation, we must consider the set of supramolecular interactions taking place between the different components during the synthesis. These interactions are supramolecular forces involving hydrophobic and electrostatic forces. The first ones refer to the attractive interactions established between the hydrophobic component of the surfactant (C16TAB) and the γ-Fe2O3 nanoparticles. This interaction is likely to occur if γ-Fe2O3 nanoparticles are previously coated with an agent containing a hydrophobic alkane component, such as APTS. Lin et al. demonstrated that supramolecular interactions can occur between propyl groups of APTS and the C16 hydrophobic chains of the hexadecyltrimethyl ammonium used as surfactant.43 This surfactant–magnetic nanoparticles interaction would facilitate the encapsulation of the magnetic nanoparticles into the silica matrix as represented in Scheme 2. As an aspect to improve, we must highlight that this interaction can lead to defective mesoporous structures. Actually, APTS coated nanoparticles interact during the mesophase formation with the surfactant through the alkane chain. Consequently, the cooperative liquid crystal mechanism that governs these processes44,45 is significantly affected. This fact would explain the lower textural properties observed for γ-Fe2O3-1@ compared to Fe2O3-0@ and Fe2O3-2@ (see ESI†), as well as the defective mesoporous structure observed by TEM and HRTEM.
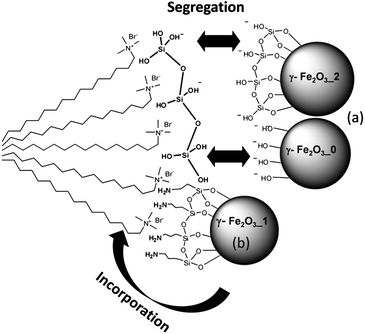 | ||
| Scheme 2 Supramolecular interactions that explain the formation of the mesoporous magnetic particles. (a) Electrostatic repulsion between the negatively charged nanoparticles and the soluble silica species (samples γ-Fe2O3-0, γ-Fe2O3-2). (b) Aminopropyl groups interact with hydrophobic organic chains of CTAB. In addition, the electrostatic repulsion is weaker due to the NH2 groups allowing γ-Fe2O3 incorporation in the system (case of γ-Fe2O3-1). | ||
The electrostatic forces refer to the electric potential at the γ-Fe2O3 nanoparticles surface and the electric charge of the hydrolyzed silica species at the pH of synthesis. In this case, the silica spheres are precipitated in basic media (pH around 11) and hydrolyzed silica species are negatively charged. In this way, γ-Fe2O3 nanoparticles with negative surface potential will be strongly repelled by the negatively charged silica species, avoiding their inclusion into the mesoporous spheres. This is the case for γ-Fe2O3-0 and γ-Fe2O3-2, which exhibit electrical surface potentials of around −30 mV. In contrast, γ-Fe2O3-1 nanoparticles undergo much lower electrostatic repulsion due to the primary NH2 groups of the APTS coating (around 10 mV at the synthesis pH) and are not enough to overcome the attractive supramolecular hydrophobic forces.
Microstructural analyses demonstrate that γ-Fe2O3 nanoparticles undergo significant changes during the coating/encapsulation process. In his pioneering work, Wu et al. hypothesized about the possibility of magnetic particles degradation during the coating with mesoporous silica.46 However, in our case, maghemite nanoparticles inside γ-Fe2O3-1@ are significantly larger than uncoated maghemite in the raw ferrofluid.
Before any treatment, γ-Fe2O3-0 nanoparticles exhibit entire volume size almost identical than coherent diffraction domain size (i.e. 8.0 nm and 8.1 nm determined by DLS and XRD, respectively), thus indicating that γ-Fe2O3-1@ nanoparticles constitute single nanocrystalline domains. However, after the coating/encapsulation process, both the entire volume and coherent diffraction domain increase. Actually, Rietveld refinements reveal a significant increase of the coherent diffraction domains for maghemite nanoparticles in γ-Fe2O3-1@ with respect to γ-Fe2O3-0. In addition, HRTEM images point out that some γ-Fe2O3 nanoparticles increased in size exhibiting diameters up to 15 nm (Fig. 3b and c). It must be highlighted that previous HRTEM studies of γ-Fe2O3-0 revealed nanoparticles ranging in size between 5 and 8 nm.30 This fact could be explained in terms of a further precipitation of γ-Fe2O3 onto pre-existing nanoparticles, from iron cations present in the raw ferrofluid. In fact, Fe3+ cations were detected in the raw ferrofluid by titration, without previous nanoparticles dissolution treatment. The presence of Fe3+ cations in dissolution is justified by the strategy followed to prepare maghemite ferrofluids, through the previous formation of magnetite nanoparticles and described by:
| Fe2+ + 2Fe3+ + 8OH− = Fe3O4 + 4H2O |
The subsequent treatment with nitric acid solution to form maghemite leads to
| Fe3O4 + 2H+ = γ-Fe2O3 + Fe2+ + H2O |
Finally, the addition of nitrates as of iron(III) nitrate would oxidize Fe2+ to Fe3+ cations.
During the encapsulation with mesoporous silica, pH increases until pH = 11 forming Fe(OH)3 from Fe3+ in solution. The hydroxide would be incorporated to nanoparticles during surfactant calcination:
| 2Fe(OH)3 + ΔQ = γ-Fe2O3 + 3H2O |
The newly grown γ-Fe2O3 seems to be structurally defective, resulting in larger particles with increased global strains as clearly demonstrated by the data collected in Table 3.
All the magnetic particles exhibit very small coercive forces and magnetic remanence at room temperature. S-like shape of the M(H) curve indicates a superparamagnetic dominating contribution for the majority of the particles, in accordance with the small size of the magnetic nanoparticles. After the coating/encapsulation, the saturation magnetization of γ-Fe2O3 nanoparticles slightly decreases at RT, which is associated with the existence of a surface layer where the iron cations possess unsaturated coordination spheres.47 This fact is in agreement with the defective maghemite phase growth during the coating/encapsulation. In addition, the interfaces between the SiO2 matrix and the magnetic nanoparticles are pinning sites that increase the coercive field (see Table 4).
For the magnetic mesoporous spheres the ZFC/FC curves suggest a wide size distribution of aggregated particles, which would be in agreement with the system consisting of groups of magnetic nanoparticles incorporated into mesoporous silica spheres, as observed by TEM. DLS results displayed in Table 1, indicated that γ-Fe2O3-0 and γ-Fe2O3-1 nanoparticles exhibit hydrodynamic size diameters expected for non-aggregated particles. Therefore, the aggregation must occur at the last stage of the synthesis, that is, during the encapsulation process. In the case of γ-Fe2O3-2 (coated with SiO2), the aggregation seems to occur also during the coating process (before encapsulation), showing hydrodynamic size diameters of 38 nm.
The large irreversibility observed in the explored temperature range points towards the existence of defects in the ferromagnetic lattice at the interfaces between nanoparticles and the mesoporous matrix. Moreover, comparing the magnetic size calculated from blocking temperature (5.3 nm) and the microstructural size calculated by XRD (9.82 nm) indicates that the magnetically defective shell could extend around 4 nm from the surface towards the core. It must be taken into account that the deposition of new γ-Fe2O3 takes place simultaneously with the interaction of soluble silica species with the nanoparticles. Even more, in the case of γ-Fe2O3-1 sample, the nanoparticles are previously coated with aminopropylsilane, justifying that the crystal growth over the nanoparticles was structurally defective.
HRTEM images evidenced that MNPs could be even larger, exhibiting diameters between 10 and 15 nm. This fact evidences that the entire volume size is also larger than structural coherence, having consequences over magnetic properties as has been demonstrated by Di Marco et al. for γ-Fe2O3 ferrofluids.48 Summarizing, the coating/encapsulation process leads to MNPs that exhibit significant changes when considering different size parameters, in such a way that entire volume > structure coherence > magnetic coherence.
In the hyperthermia experiment, the SAR value and the self-heating temperature indicate that the magnetic mesoporous spheres are suitable to be used as thermoseeds for hyperthermia treatment in the range of 42–45 °C. This temperature interval falls in the moderate hyperthermia range, which is characterized for its efficiency in cancer cell destruction without non-reversible damage on healthy cells.49 As demonstrated in this work, the preparation of magnetic mesoporous spheres requires the chemical modification of the raw ferrofluid. This strategy leads to a slight decrease of the magnetic properties, by means of the enlargement of the magnetically disordered shell at RT in nanoparticles. Anyway, the magnetic mesoporous spheres exhibit enough SAR to act as potential thermoseeds in cancer treatment by hyperthermia.
Conclusions
In this work, mesoporous magnetic nanocomposites have been designed to be used as thermoseeds for the cancer treatment by hyperthermia. The supramolecular mechanisms that govern the encapsulation of γ-Fe2O3 nanoparticles into silica mesoporous nanospheres have been proposed. Besides, the structural and magnetic modifications undergone by γ-Fe2O3 nanoparticles have been for the first time determined.The incorporation of γ-Fe2O3 nanoparticles into silica is determined by supramolecular forces, the γ-Fe2O3 surface electrical charge and the hydrophobic interaction between the γ-Fe2O3 coating and surfactant molecules.
The successful encapsulation of γ-Fe2O3 nanoparticles results in significant particle size changes as well as structure and magnetic coherence. After the coating/encapsulation process, a new defective γ-Fe2O3 phase is formed. Consequently, encapsulated γ-Fe2O3 nanoparticles exhibit entire volume > structure coherence > magnetic coherence.
Preliminary hyperthermia tests have shown that the magnetic mesoporous spheres reach the hyperthermia temperature range. This work opens up the possibility of synthesizing multifunctional mesoporous magnetic particles for hyperthermia treatment and drug delivery purposes, based on the superparamagnetic behaviour and the mesoporous structure.
Acknowledgements
This work was supported by the Spanish CICYT through the project MAT2008-00736 and by the CAM through project S2009/MAT-1472. We thank C. Aroca (ISOM, Universidad Politécnica de Madrid) for their technical assistance in the magnetic measurements and Prof. Osamu Terasaki for his valuable contribution in HRSEM studies.Notes and references
- J. Liu, S. Z. Qiao, Q. H. Hu and G. Q. Lu, Small, 2011, 7, 425–443 CrossRef CAS.
- M. Vallet-Regí, M. Colilla and B. González, Chem. Soc. Rev., 2011, 40, 596–607 RSC.
- J. L. Vivero-Escoto, I. I. Slowing, B. G. Trewyn, V. S.-Y. Lin. Small, 6, 1952–1967 Search PubMed.
- E. Prouzet, S. Ravaine, C. Sanchez and R. Backov, New J. Chem., 2008, 32, 1284–1299 RSC.
- C. Sanchez, L. Rozes, F. Ribot, C. Laberty-Robert, D. Grosso, C. Sassoye, C. Boissiere and L. Nicole, C. R. Chim., 2010, 13, 3–39 CrossRef CAS.
- Y. H. Deng, Y. Cai, Z. K. Sun and D. Y. Zhao, Chem. Phys. Lett., 2011, 510, 1–13 CrossRef CAS.
- A. H. Lu, E. L. Sabalas and F. Schüth, Angew. Chem., Int. Ed., 2007, 46, 1222–1244 CrossRef CAS.
- B. González, E. Ruiz-Hernández, M. J. Feito, C. López de Laorden, D. Arcos, C. Rámirez-Santillan, C. Matesanz, M. T. Portoles and M. Vallet-Regí, J. Mater. Chem., 2011, 21, 4598–4604 RSC.
- I. I. Slowing, J. L. Vivero-Escoto, C. W. Wu and V. S.-Y. Lin, Adv. Drug Delivery Rev., 2008, 60, 1278–1288 CrossRef CAS.
- M. Vallet-Regí, A. Rámila, R. P. del Real and J. Pérez-Pariente, Chem. Mater., 2001, 13, 308–311 CrossRef.
- M. Vallet-Regí, F. Balas and D. Arcos, Angew. Chem., Int. Ed., 2007, 46, 7548–7558 CrossRef.
- M. Vallet-Regí, J. Intern. Med., 2010, 267, 22–43 CrossRef.
- F. Balas, M. Manzano, P. Horcajada and M. Vallet-Regí, J. Am. Chem. Soc., 2006, 128, 8116–8117 CrossRef CAS.
- J. Ge, Q. Zhang, T. Zhang and Y. D. Yin, Angew. Chem., Int. Ed., 2008, 47, 8924–8928 CrossRef CAS.
- Y. H. Deng, Y. Cai, Z. K. Sun, J. Liu, C. Liu, J. Wei, W. Li, C. Liu, Y. Wang and D. Y. Zhao, J. Am. Chem. Soc., 2010, 1332, 8466–8473 CrossRef.
- S. Giri, B. G. Trewyn, M. P. Stellmaker and V. S. Y. Lin, Angew. Chem., Int. Ed., 2005, 44, 5038–5044 CrossRef CAS.
- D. Castanotto and J. J. Rossi, Nature, 2009, 457, 426–433 CrossRef CAS.
- F. Torney, B. G. Trewyn, V. S.-Y. Lin and K. Wang, Nat. Nanotechnol., 2007, 2, 295–300 CrossRef CAS.
- E. Ruiz-Hernández, A. Baeza and M. Vallet-Regí, ACS Nano, 2011, 5, 1259–1266 CrossRef.
- H. M. Liu, S. H. Wu, C. W. Lu, M. Yao, J. K. Hsiao, Y. Hung, Y. S. Lin, C. Y. Mou, C. S. Yang, D. M. Huang and Y. C. Chen, Small, 2008, 4, 619–626 CrossRef CAS.
- J. H. Lee, Y. M. Huh, Y. W. Jun, J. W. Seo, J. T. Jang, H. T. Song, S. Kim, E. J. Cho, H. G. Yoon, J. S. Suh and J. Cheon, Nat. Med., 2007, 13, 95–99 CrossRef CAS.
- L. Zhang, S. Z. Qiao, Y. G. Jin, H. G. Yang, S. Budihartono, F. Stahr, Z. F. Yan, X. L. Wang, Z. P. Hao and G. Q. Lu, Adv. Funct. Mater., 2008, 18, 3203–3212 CrossRef CAS.
- K. R. Lee, S. Kim, D. H. Kang, J. I. Lee, Y. J. Lee, W. S. Kim, D. H. Cho, H. B. Lim, J. Kim and N. H. Hur, Chem. Mater., 2008, 20, 6738–6742 CrossRef CAS.
- F. Martín-Saavedra, E. Ruíz-Hernández, A. Boré, D. Arcos, M. Vallet-Regí and N. Vilaboa, Acta Biomater., 2010, 6, 4522–4561 CrossRef.
- J. Kim, Y. Piao, N. Lee, Y. Park, I. H. Lee, J. H. Lee, S. R. Paik and T. Hyeon, Adv. Mater., 2010, 22, 57–60 CrossRef CAS.
- T. Coradin, J. Larionova, A. A. Smith, G. Rogez, R. Clerac, C. Guerin, G. Blondin, R. E. P. Winpenny, C. Sanchez and T. Malla, Adv. Mater., 2002, 14, 896–898 CrossRef CAS.
- B. Julian-López, C. Boissiere, C. Chaneac, D. Grosso, S. Vasseur, S. Miraux, E. Duguet and C. Sanchez, J. Mater. Chem., 2007, 17, 1563–1569 RSC.
- C. Boissiere, D. Grosso, A. Chaumonnot, L. Nicole and C. Sanchez, Adv. Mater., 2011, 23, 599–623 CrossRef CAS.
- E. Ruiz-Hernández, A. López-Noriega, D. Arcos, I. Izquierdo-Barba, O. Terasaki and M. Vallet-Regí, Chem. Mater., 2007, 19, 3455–3463 CrossRef.
- E. Ruiz-Hernández, A. López-Noriega, D. Arcos and M. Vallet-Regí, Solid State Sci., 2008, 10, 421–426 CrossRef.
- A. López-Noriega, E. Ruiz-Hernández, S. M. Stevens, D. Arcos, M. W. Anderson, O. Terasaki and M. Vallet-Regí, Chem. Mater., 2009, 21, 18–20 CrossRef.
- M. Grün, I. Lauer and K. K. Unger, Adv. Mater., 1997, 9, 254–257 CrossRef.
- D. K. Yi, S. S. Lee, G. C. Papaefthymiou and J. Y. Ying, Chem. Mater., 2006, 18, 614–619 CrossRef CAS.
- Y. S. Lin, S. H. Hu, Y. Hung, Y. H. Chou, C. Chang, M. L. Lin, C. P. Tsai and C. Y. Mou, Chem. Mater., 2006, 18, 5170–5172 CrossRef CAS.
- J. Kim, J. E. Lee, J. Lee, J. H. Yu, B. C. Kim, K. An, Y. Hwang, C. H. Shin, J. G. Park and T. Hyeon, J. Am. Chem. Soc., 2006, 128, 688–689 CrossRef CAS.
- J. Kim, H. S. Kim, N. Lee, T. Kim, H. Kim, T. Yu, I. C. Song, W. K. Moon and T. Hyeon, Angew. Chem., Int. Ed., 2008, 47, 8438–8441 CrossRef CAS.
- L. Zhang, S. Z. Quiao, Y. G. Jin, Z. G. Chen, H. C. Gu and G. Q. Lu, Adv. Mater., 2008, 20, 805–810 CrossRef CAS.
- R. Massart, IEEE Trans. Magn., 1981, 17, 1247–1248 CrossRef.
- S. Mornet, J. Portier and E. Duguet, J. Magn. Magn. Mater., 2005, 293, 127–134 CrossRef CAS.
- W. Stöber, A. Fink and E. Bohn, J. Colloid Interface Sci., 1968, 26, 62–69 CrossRef.
- Z. Somgyvári, E. Sváb, G. Mészáros, K. Krezhov, I. Nedkov, I. Sajó and F. Bourée, Appl. Phys. A: Mater. Sci. Process., 2002, 74, S1077–S1079 CrossRef.
- F. Šulek, M. Drofenik, M. Habulin and Ž Knez, J. Magn. Magn. Mater., 2010, 322, 179–185 CrossRef.
- S. Huh, J. W. Wiench, J. C. Yoo, M. Pruski and V. S. Lin, Chem. Mater., 2003, 15, 4247–4256 CrossRef CAS.
- F. Hoffman, M. Cornelius, J. Morell and M. Fröba, Angew. Chem., Int. Ed., 2006, 45, 3216–3251 CrossRef.
- G. J. A. A. Soler-Illia, C. Sanchez, B. Lebeau and J. Patarin, Chem. Rev., 2002, 102, 4093–4138 CrossRef.
- P. G. Wu, J. H. Zhu and C. G. Xu, Adv. Funct. Mater., 2004, 14, 345–351 CrossRef CAS.
- A. Millan, A. Urtizberea, N. J. O. Silva, F. Palacio, V. S. Amaral, E. Snoeck and V. Serin, J. Magn. Magn. Mater., 2007, 312, L5–L9 CrossRef CAS.
- M. Di Marco, M. Port, P. Couvreur, C. Dubernet, P. Ballirano and C. Sadun, J. Am. Chem. Soc., 2006, 128, 10054–10059 CrossRef CAS.
- J. Overgaard, Cancer, 1977, 2637–2646 CrossRef CAS.
Footnote |
| † Electronic supplementary information (ESI) available: Detailed synthesis method, FTIR characterization of γ-Fe2O3 nanoparticles, XRD studies on magnetic mesoporous silica spheres, N2 adsorption porosimetry studies on magnetic mesoporous silica spheres, inductive coupled plasma (ICP) elemental analysis, Rietveld refinement results. See DOI: 10.1039/c1jm13102h |
| This journal is © The Royal Society of Chemistry 2012 |

