Influence of the hydrogen contained in amorphous silicon thin films on a pulsed radiofrequency argon glow discharge coupled to time of flight mass spectrometry. Comparison with the addition of hydrogen as discharge gas
Pascal
Sánchez
ab,
Deborah
Alberts
a,
Beatriz
Fernández
*a,
Armando
Menéndez
b,
Rosario
Pereiro
a and
Alfredo
Sanz-Medel
*a
aDepartment of Physical and Analytical Chemistry, Faculty of Chemistry, University of Oviedo, Julian Clavería 8, 33006, Oviedo, Spain. E-mail: fernandezbeatriz@uniovi.es; asm@uniovi.es; Tel: +34 985 10 34 74
bEnergy Group (EN)—ITMA Materials Technology, Calafates 11, 33417, Avilés, Spain
First published on 22nd November 2011
Abstract
Thin film solar cells technology based on hydrogenated amorphous silicon (a-Si:H) has undergone a great expansion during recent years. Pulsed radiofrequency glow discharge time-of-flight mass spectrometry (rf-PGD-ToFMS) is able to perform depth profiling analysis of coated materials, providing an excellent tool for rapid and high sensitive chemical characterisation of photovoltaic devices. The hydrogen concentration on a-Si:H thin films is around 10%, which represents a challenge for quantitative depth profile analyses by using GD sources due to the so-called “hydrogen effect”. It is well-known that when hydrogen is present in the Ar discharge, even in small quantities, significant changes can occur in the ion signal intensities and sputtering rates measured. Therefore, a critical comparison has been carried out by rf-PGD-ToFMS in terms of pulse profiles, spectral interferences and depth resolution for two modes of hydrogen introduction in the discharge, exogenous hydrogen in molecular gaseous form (using the mixture 0.2% H2 + Ar as discharge gas) or endogenous hydrogen, sputtered as a sample constituent. For this purpose, non-hydrogenated materials (containing B, P and Si) and three types of a-Si:H thin films were investigated. Exogenous hydrogen was found to produce a noteworthy influence on the pulse profiles of the analytes, whereas the effect of the hydrogen sputtered from the samples could be considered less notorious. Moreover, the proper selection of the after-peak region was found to be critical to obtain optimum mass spectra (i.e. high analyte sensitivities free of interferences).
Introduction
Nowadays, the main energy supplies for human activities are represented by fossil and mineral fuels, hydroelectric sources, and nuclear plants. Nevertheless, such sources are very harmful to the environment, being responsible for global warming, biosphere destruction, ozone layer depletion and ecological devastation. As a clear example, the nuclear disaster that recently occurred in Fukushima (March 2011, Japan) has accelerated a new position of the governments regarding this technology and drastic decisions to phase-out atomic power are being adopted. Hence, it is obvious that renewable energies development, such as photovoltaic (PV) technology, solar-thermal systems, biomass technology, etc.1 will be boosted in the coming years since they provide a green solution for a healthier world.Worldwide PV market is currently dominated by bulk mono- and polycrystalline silicon (c-Si) solar cells. However, the development of thin films solar cells (TFSC) has undergone a great expansion in recent years. As an example, the TFSC sector grew over 30% in 2009 due to the implementation of efficient and cost effective manufacturing processes.2PV technology based on hydrogenated amorphous silicon (a-Si:H) thin films offers several advantages compared to c-Si solar cells, such as a well-known industrial fabrication process, low cost of manufacture, and the possibility to use cheap and flexible substrates.3 The main limitation of a-Si:H solar cells is, however, their lower conversion efficiency (7–10%) and, therefore, increasing research efforts are currently directed towards a-Si:H final efficiency enhancements.
Indirect and long procedure methods based on opto-electrical measurements have been traditionally used for the characterisation of PV devices.4 Nevertheless, the use of solid state spectrometric techniques, such as secondary ion mass spectrometry (SIMS) and glow discharge (GD) spectrometries,5 could allow valuable information to be obtained about the distribution of doping elements through the films, possible diffusion processes, and the influence of elemental concentrations on the efficiency of PV devices. Several works reported the quantitative analysis of implanted impurities and dopants into c-Si and a-Si substrates by SIMS.6,7 Although SIMS shows an excellent potential for depth profiling analysis, it also presents some drawbacks, such as severe matrix effects, high cost and long-time analysis.8 GDs coupled to mass spectrometry (MS) provide an alternative technique for rapid and high sensitive depth profile characterisation of major and trace elements.5,9 The application of analytical GDs is increasing because they offer several advantages, including high depth resolution (<5 nm), fast sputtering rate (>1 μm min−1), multielemental capability and low limits of detection (ppm–ppb).10 Moreover, atomisation and ionisation processes are separated in space and time, resulting in low matrix effects. Additionally, pulsed radiofrequency GDs (rf-PGDs) have been recently proposed as attractive analytical alternatives to the more common GD operation mode using continuous powering.11
Among the different mass analysers for GD detection, time-of-flight (ToF) MS is increasingly being used due to their high sampling rate and ability to collect complete mass spectra with the same precision, sensitivity and resolution regardless of the total number of isotopes being measured. PGD-ToFMS permits the quasi-simultaneous detection of ions along the GD pulse period and, thus, the observation of the different time domains with different ionization mechanisms in the formed plasma (denoted as pre-peak, plateau and after-peak regions). This allows the selection of the integration time detection window that provides the highest analyte signal with minimum spectral interferences. Recently, the analytical capabilities of rf-PGD-ToFMS have been successfully investigated for depth profile analysis of nanostructured materials,12polymers,13 implanted silicon14 and anodic tantala films.15
It is well known that the hydrogen content on high quality intrinsic and doped a-Si:H thin films is around 10%.4 It has been previously reported that the addition of hydrogen to Ar GD seriously affects the intensity of the analytes and reduces the sputtering rate.16,17 Tanaka et al.18 studied the effect of hydrogen on the analysis of insulating and conducting materials reporting that the 90Zr+ intensities decreased up to 10 times with a H2 concentration of 2%, whereas an increase of a factor 2 for the 120Sn+ intensity was observed up to 0.3% of H2 in Ar, using in both cases rf forward powers below 100 W. However, systematic studies to assess the effect of hydrogen on PGD-MS are still lacking. Thus, it seems crucial to obtain a better knowledge of the hydrogen role on pulsed GDs in order to carry out the quantitative analysis of TFSC based on a-Si:H.
In this paper, the effect of the hydrogen on the pulse profiles and mass spectra obtained by rf-PGD-ToFMS has been investigated in detail. A comparative study has been performed for non-hydrogenated materials (containing B, P and Si) and for three types of hydrogenated samples (an intrinsic, a B-doped and a P-doped layer based on a-Si:H) using pure Ar and a mixture 0.2% H2 + Ar as discharge gas. Thus, the influence of atomic hydrogen sputtered from the sample and molecular hydrogen externally added to the gas was critically investigated. Finally, qualitative depth profiles of P and B doped a-Si:H thin films were performed.
Experimental
Samples preparation: a-Si:H thin films
Three different a-Si:H thin films deposited on electronic quality Si wafers (University Wafer, USA) have been employed in this study: an intrinsic a-Si:H layer (334 ± 8 nm thickness), a B and C doped a-Si:H layer (p-a-SiC:H) (376 ± 7 nm thickness) and a P doped a-Si:H layer (n-a-Si:H) (242 ± 9 nm thickness). The thickness of the layers was experimentally determined by profilometry on cross-sectioned witness samples by using a mechanical step profilometer (Model Ambios XP1, AmbiosTechnology, USA). Moreover, a certified reference material (CRM) 13X-8110L with 1.07% of B (MBH Analytical Ltd., UK), a steel sheath coated with a 10 μm thick NiP layer with a P concentration of 6% (SWEREA-KIMAB AB, Sweden) and an electronic quality Si wafer (University wafer, USA) have been investigated as non-hydrogenated samples.The a-Si:H layers were deposited by using a rf plasma enhanced chemical vapour deposition instrument manufactured by Elettrorava (Torino, Italy). This equipment has a multi-chamber cluster configuration consisting of three independent deposition chambers to avoid cross-contaminations. Deposition processes were carried out in ultra-high vacuum conditions with a forward power to the electrodes of 1.8 W, a fixed frequency of 13.56 MHz and the substrate temperature and pressure during deposition varied, depending on the layers from 170–130 °C and 65–94 Pa, respectively. The Si deposition process was carried out by means of a gas reaction in the plasma using SiH4 (99.997%) as the plasma gas. The dopants were added using different gas mixtures: the p-a-SiC:H layer was deposited by mixing SiH4 (10 sccm), B2H6 (12 sccm) and CH4 (10 sccm), whereas the n-a-Si:H layer was deposited by mixing SiH4 (15 sccm) and PH3 (15 sccm). The gases were provided by Praxair-España S.L. (Spain). The gas flow rates used for the preparation of the a-Si:H thin films were in the range of those employed for the preparation of the complete TFSC devices.
Instrumentation: rf-PGD-ToFMS
The rf-PGD-ToFMS instrument consists of a rf-GD bay unit from Horiba Jobin Yvon (Longjumeau, France) coupled to a fast orthogonal time-of-flight mass spectrometer (TOFWERK, Switzerland) with a microchannel plate detector.19 Additionally, an interface, consisting of two extraction cones, connects the GD source to the ToFMS. This interface allows to extract and focus the ions as well as to reduce the pressure between the GD source and the mass analyser. A pure copper modified Grimm type GD source (EMPA, Switzerland), with a 4 mm diameter anode and a 2.5 mm inner diameter flow tube, was used. The power is supplied to the GD through the backside of the sample by a rf-power generator operating at 13.56 MHz. The rf power supply can be run either in pulsed mode with a frequency between 0.1 Hz and 10 kHz and a pulse width from 50 μs up to several milliseconds or in non-pulsed mode. Further details of the rf-PGD-ToFMS equipment are described elsewhere.19The ToFMS allows completed mass spectra to be recorded with a frequency of up to 100 kHz, allowing a minimal time resolution of 10 μs. It also provides an average mass resolving power of about 2500. In our case, experimental conditions (700 Pa Ar discharge pressure, 90 W rf forward power, 2 ms pulse width and 4 ms pulse period) were chosen as a compromise between high sensitivity and good depth resolution through the analysis of a-Si:H thin films. A delay signal acquisition time of 150 μs was used for all measurements. Analyte ion signals showed their maximum intensity in the after-peak region of the pulse. Therefore, pulsed rf-GD-ToFMS depth profiles were obtained by selecting the ion signals in the after-peak domain.
Discharge gases: Ar and H2–Ar mixtures
Beside high-purity Ar (99.999% minimum purity), a mixture of Ar and 0.2% v/v hydrogen, both from Air Liquide (Oviedo, Spain), was used as discharge gas. Its purpose was to investigate the influence of hydrogen on the analytical performance of rf-PGD-ToFMS with externally added hydrogen (H2 + Ar gas discharge) or, alternatively, with sputtered hydrogen from the sample itself (a-Si:H thin films). Therefore, it is important to secure that the amount of hydrogen introduced as gaseous impurity remains in the order of the amount occluded in those samples. It is known that about 10% (atomic) hydrogen is incorporated in a-Si:H deposited at low temperature.20 By considering our sample sputtering rate and sputtered surface area we estimated through eqn (1) that ∼0.2% v/v of H2 should be introduced in the mixture with Ar as discharge gas | (1) |
Results and discussion
Optimization of GD operating conditions for the analysis of a-Si:H thin films
A PGD is created when applying periodically a pulse of high power during milli- or even microseconds. An interesting characteristic of the pulsed mode is the observation of different behaviour in the temporal profiles for each pulse period, such as the pre-peak, plateau and after-peak regions.21 In the pre-peak, ion signals are mainly influenced by discharge gas species, whereas the plateau is characterized by a stabilization of the operating conditions and the beginning of the production of the ions sputtered from the sample. The after-glow or after-peak region is particularly interesting due to an increase of Ar metastable (Arm) density produced by electron-ion and dissociative molecular ions recombination.22,23 This high Arm population, through penning ionization, conduces to an enhancement of analyte atoms ionization. For example, Fig. 1a and b show respectively the pulse profiles observed for the gas species (40Ar+, 40Ar1H+ and 1H3+) and the analyte ions (28Si+, 29Si+, 11B+ and 31P+) for the analysis of B and P doped a-Si:H thin films using pure Ar as discharge gas. As can be observed in Fig. 1a, 40Ar+ and 40Ar1H+ ion signals showed their maxima just after the end of the GD pulse (<100 μs), whereas 1H3+ showed its maximum after ∼240 μs. It must be noted that the higher 40Ar1H+ ion intensity compared to 40Ar+ is due to the presence of hydrogen on the sample and that 1H3+ showed a later after-peak. As has been previously reported by Bogaerts,241H3+ ions are almost exclusively (99.5%) produced by proton transfer between ArH+ ions and H2 molecules. In a pure Ar discharge, these two species are not originally present in the plasma so an extra time should be needed to obtain ArH+ and H2 ions and, subsequently, 1H3+. As can be later seen in Fig. 3a, this explanation can be also confirmed throughout the experiments carried out by using the mixture 0.2% H2 + Ar as discharge gas: when H2 is externally added, 1H3+ ions show an earlier after-peak time. Moreover, analyte ion signals (Fig. 1b) showed also their maxima in the after-peak region. Only the after-peak domain will be considered for all the subsequent measurements and discussions.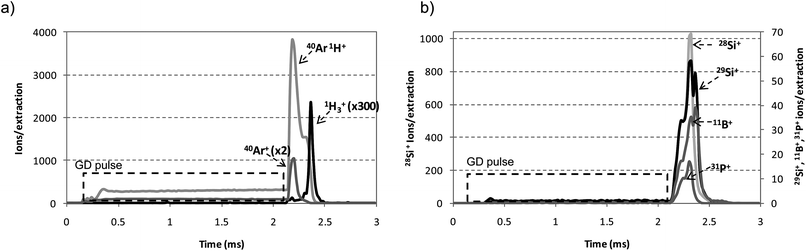 | ||
| Fig. 1 Ion signals profile measured for the analysis of P and B doped a-Si:H thin films by rf-PGD-ToFMS along the GD rf-pulse period using pure Ar as discharge gas. Operating conditions: 90 W, 700 Pa, 2 ms pulse width and 4 ms pulse period. (a) 1H3+, 40Ar+, and 40Ar1H+ and (b) 28Si+, 29Si+, 11B+ and 31P+ analyte ions. | ||
Optimization of GD operating conditions was carried out through the analysis of the Si wafer, both using Ar and the mixture 0.2% H2 + Ar as discharge gas. Fig. 2 shows the relationships obtained for 28Si+, 29Si+, 1H3+, 40Ar+ and 40Ar1H+ (measured by integrating the corresponding ion signals in the after-peak) with the discharge pressure (see Fig. 2a) and the rf forward power (see Fig. 2b) using Ar as discharge gas (28Si+ signal using the mixture 0.2% H2 + Ar as discharge gas was also included in the Figure). The pressure range was varied from 600 Pa to 900 Pa (Fig. 2a), whereas the rf forward power was studied in the range of 50–110 W (Fig. 2b). As can be observed, the maximum intensities were always obtained using 700 Pa and 90 W. Concerning the selection of the pulse parameters and, as has been previously selected for the analysis of different type of materials,12,14 2 ms of pulse width and 4 ms period (i.e. 250 Hz frequency) were chosen.
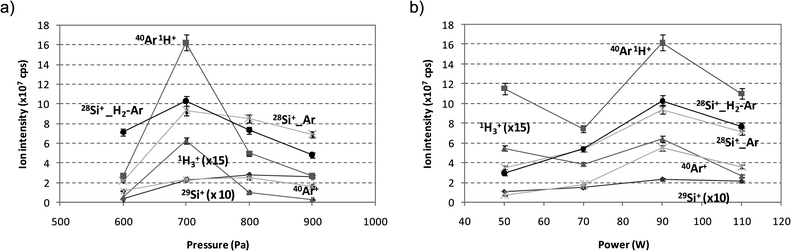 | ||
| Fig. 2 Ion signal intensities measured by integrating the ion signals in the after-peak for the analysis of the Si wafer by rf-PGD-ToFMS. Pure Ar and the mixture 0.2% H2 + Ar have been employed as discharge gas. Pulse conditions: 2 ms pulse width and 4 ms pulse period. (a) Effect of the pressure (90 W constant rf power) and (b) effect of the rf forward power (700 Pa Ar discharge pressure). | ||
Influence of endogenous and exogenous hydrogen on the pulse profiles
As the effect of added hydrogen had not been investigated before in PGD sources coupled to MS, the influence of hydrogen on the ions pulse profiles (ions/extractionvs. pulse time) was evaluated by using samples with and without hydrogen as a sample constituent as well as using Ar and mixtures 0.2% H2 + Ar as discharge gas. Results obtained in such experiments are shown as the pulse profiles at times between 2 and 2.6 ms of pulse period, since we are interested in investigating the shape of the after-peak region at the different conditions. It should be stated that the main purpose of this work leads to study the influence of exogenous and endogenous hydrogen for depth profiling analysis of hydrogenated samples by rf-PGD-ToFMS. Thus, a comparative study in terms of pulse profiles, mass spectra and qualitative depth profiles was carried out. However, due to the complexity of the reaction processes in the plasma (especially using mixtures 0.2% H2 + Ar) further fundamental studies are required in order to provide a complete explanation of the observed behaviours.1H3+, 40Ar+ and 40Ar1H+ pulse profiles
The influence of hydrogen on the 1H3+, 40Ar+ and 40Ar1H+ ions pulse profiles was evaluated by using Ar and mixtures 0.2% H2 + Ar as discharge gas and intrinsic a-Si:H thin films and silicon wafers as model samples. Results obtained in such experiments are shown in Fig. 3. As can be observed, the shape of the pulse profiles depends noticeably on the discharge gas selected and it varies also depending on the ion type detected. As can be seen in Fig. 3a, the presence of 1H3+ ion signal was clearly observed using the mixture 0.2% H2 + Ar, whereas significantly lower signals were observed by using Ar as discharge gas and adding endogenous hydrogen (i.e., a-Si:H thin film). Looking at the ion intensities, the maximum values were located between 220 and 240 μs after the end of the power supply pulse for both samples using pure Ar and only 20–40 μs after using the mixture H2 + Ar. This shorter time in the after-peak domain of the 1H3+ ion signal could be attributed to the presence of H2 in the plasma gas, which reduces the time for 40Ar1H+ production and, consequently, for 1H3+ ions production through the proton transfer mechanism between 40Ar1H+ and H2.24 Therefore, it could be stated that the effect of the molecular hydrogen added to the discharge gas on the 1H3+ pulse profile seems to play a more important role than the hydrogen sputtered directly from the sample.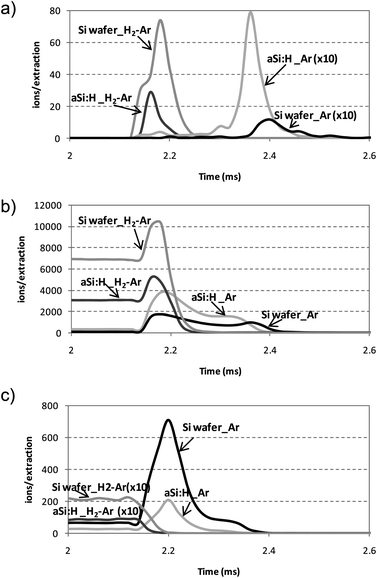 | ||
| Fig. 3 After-peak profiles measured for hydrogen related ions on Ar with the rf-PGD-ToFMS system for a-Si:H thin films and Si wafers using pure Ar and mixture 0.2% H2–Ar as discharge gas. Operating conditions: 90 W, 700 Pa, 2 ms pulse width and 4 ms pulse period. (a) 1H3+; (b) 40Ar1H+; (c) 40Ar+. | ||
A similar trend was observed for the 40Ar1H+ ion pulse profile (Fig. 3b), being in agreement with the models proposed by Bogaerts24,25 where it was predicted that 40Ar1H+ density increases with H2 through H-atom transfer between 40Ar+ and H2. Additionally, the densities of the hydrogen related ions (i.e., ArH+, H+, H2+ and H3+) increase with H2 or appear to pass over a maximum at a certain hydrogen concentration, which can be explained by a dependence on the discharge conditions and the importance of the different production and loss mechanisms. Moreover, the densities of the H atoms and H2 molecules (from the sample itself and from the discharge gas, respectively) continue to increase with the addition of hydrogen. This effect is, however, less pronounced for the H atoms than for the H2 molecules that could explain, at least partly, the differences observed in the pulse profiles by using endogenous and exogenous hydrogen.
This different behaviour observed for the hydrogen added as discharge gas or directly sputtered from the sample can be also seen in the 40Ar+ pulse profiles (Fig. 3c). No after-peak signals were detected using the mixture 0.2% H2 + Ar, whereas a maximum signal can be easily distinguished using pure Ar at 30–50 μs after the end of the power supply pulse for both samples. This is in agreement with previous studies25 where the presence of H atoms and H2 molecules on the Ar gas discharge results in a drop in 40Ar+ density due to these ions are involved into other hydrogen-related ions, mainly by H-atom transfer. In our case, the H atoms sputtered from the sample in a pure Ar discharge did not exhibit enough influence to suppress the after-peak signal.
Pulse profile of analytes
Once studied the pulse profiles of the Ar and hydrogen related ions using endogenous and exogenous hydrogen, the ion signals of the analytes (Si, B and P) were also evaluated. In this study, intrinsic a-Si:H, B and P doped a-Si:H thin films (p-a-SiC:H and n-a-Si:H, respectively) as well as two non-hydrogenated reference materials containing B and P were investigated by using pure Ar and the mixture 0.2% H2 + Ar as discharge gas. Fig. 4 shows the pulse profile of 28Si+, 11B+ and 31P+ studied at times from 2 to 2.6 ms. As can be seen in Fig. 4a, similar pulse profiles for 28Si+ were observed for the Si wafer and the a-Si:H thin film using pure Ar as discharge gas. The presence of hydrogen sputtered from the sample did not affect the pulse profile, showing in both cases a maximum occurring at 170 μs after the end of the power supply pulse. The pulse profiles were, however, significantly different when molecular hydrogen was added to the discharge gas and a new maximum occurring at 70 μs after the end of the pulse could be noticeably observed for both samples. A similar trend was also obtained for 11B+ and 31P+ pulse profiles when endogenous and exogenous hydrogen was employed (Fig. 4b and c, respectively). In both cases, the pulse profiles showed their maxima at positions closer to the plateau regime (i.e., closer to the end of the power supply pulse) in the presence of externally added hydrogen, following the same behaviour as 1H3+ (Fig. 3a). Thus, it could be stated that the external addition of H2 to the discharge gas has a noteworthy influence on the pulse profiles of the analytes along the after-peak domain, whereas the effect of the hydrogen sputtered from the samples (with hydrogen content below 10%) could be considered negligible.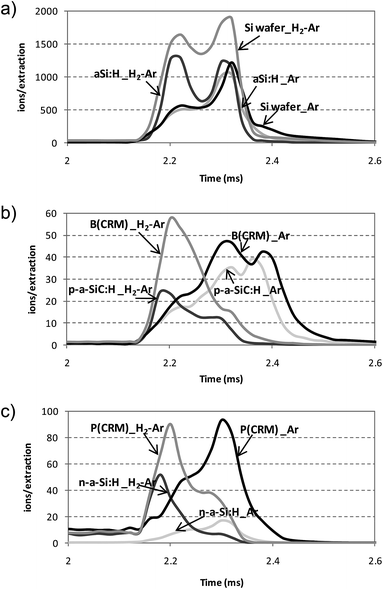 | ||
| Fig. 4 Pulse profiles measured with the rf-PGD-ToFMS system for the Si wafer, intrinsic a-Si:H thin film, doped a-Si:H thin films (n-a-Si:H and p-a-SiC:H) and two CRMs containing B and P using pure Ar and mixture 0.2% H2 + Ar as discharge gas. Operating conditions: 90 W, 700 Pa, 2 ms pulse width and 4 ms pulse period. (a) 28Si+ (Si wafer and intrinsic a-Si:H thin film); (b) 11B+ (CRM 13X-8110L and p-a-SiC:H thin film); (c) 31P+ (10 μm NiP layer on steel and n-a-Si:H thin film). | ||
Effect of hydrogen addition on the spectral interferences
It is well-known that mass resolving power is very important in MS to resolve analyte ion signals from polyatomic interferences. The rf-PGD-ToFMS system is able to further separate analyte ions from polyatomic and discharge gas species due to they are formed at different temporal and spatial locations. Thus, working in pulsed mode it is crucial to select the right region into the after-peak domain to obtain optimum analyte sensitivities free of interference signals. In our case, the main polyatomic interferences for the analytes of interest (i.e., 11B+, 28Si+, 29Si+, 30Si+ and 31P+) are 12C16O+, 14N2+, 14N21H+, 14N16O+ and 14N16O1H+. Therefore, the influence of hydrogen (sputtered from the sample or externally added to the discharge gas) on the resolution of such analytes has been investigated in detail.As an example, Fig. 5 shows the pulse profiles of 29Si+ and its polyatomic interference (14N21H+) obtained for the analysis of the Si wafer and the a-Si:H thin film using pure Ar and the mixture 0.2% H2 + Ar as discharge gas. Fig. 5a and b show the pulse profiles of ion signals using pure Ar. Three maxima were observed in the after-peak region for 29Si+ at 70 μs, 170 μs and 230–250 μs after the end of the GD pulse. The presence of sputtered hydrogen atoms on the plasma (Fig. 5b) had no significant influence on the pulse profiles since only a slight movement was observed on the maximum positions of 14N21H+ and 29Si+ from 250 μs to 230 μs. Nevertheless, a significant change in the pulse profiles of 14N21H+ could be observed when hydrogen was externally added to the discharge gas, appearing as maxima in the after-peak regions at 50 μs and 30 μs after the end of the pulse (Fig. 5c and d, respectively). Moreover, the external addition of hydrogen suppressed the third 29Si+ maximum located at 230–250 μs. Hence, it could be concluded that the presence of hydrogen in rf-PGD sources requires a careful selection of the appropriate temporal time window in the after-peak region for optimised conditions. Under such a correct time window, ion analyte signals should be more intense and free from spectral interferences, improving the analytical figures of merit. In our case, the optimal pulse profile position for 29Si+ was selected at 70 μs and 170 μs after the end of the power supply pulse using pure Ar and the mixture H2 + Ar, respectively.
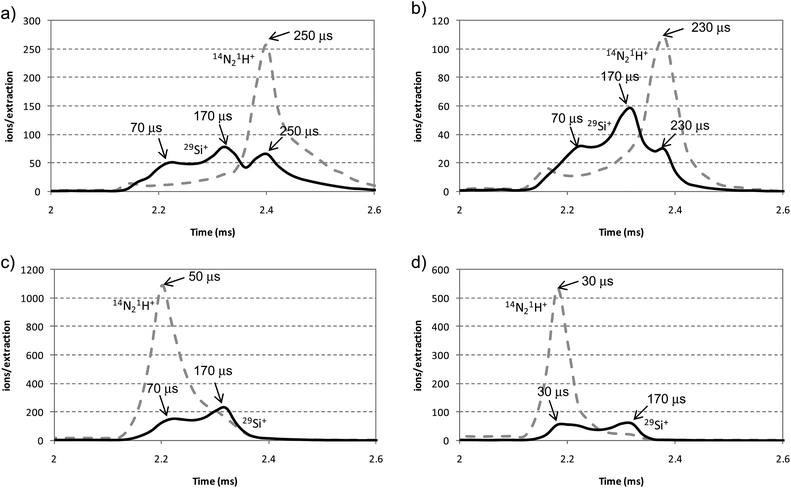 | ||
| Fig. 5 Pulse profiles of 29Si+ and 14N21H+ obtained for the analysis of the Si wafer and the intrinsic a-Si:H thin film using Ar and mixtures 0.2% H2 + Ar. (a) Si wafer (pure Ar); (b) a-Si:H thin film (pure Ar); (c) Si wafer (H2 + Ar mixture); (d) a-Si:H thin film (H2 + Ar mixture). | ||
For instance, Fig. 6 shows the mass spectrum interval between 27.5 m/z and 30.5 m/z, measured for the Si wafer using the mixture H2 + Ar as discharge gas. Fig. 6a shows the mass spectrum collected 170 μs after the end of the GD pulse. In this case, only one peak is observed at 28 m/z, which corresponds to 28Si+. Moreover, 29Si+ is well resolved from 14N21H+ and only one peak is observed at 30 m/z, corresponding to 30Si+. Furthermore, the isotopic ratios 28Si+/29Si+ and 28Si+/30Si+ are 18.48 and 31.61, respectively, which corresponds to a 6% deviation from the natural isotope abundance ratios. On the other hand, Fig. 6b shows the mass spectrum collected at 70 μs after the end of the GD pulse. At this earlier time a high contribution of polyatomic interferences (14N21H+ and 14N16O+) were detected at 29 m/z and 30 m/z, respectively.
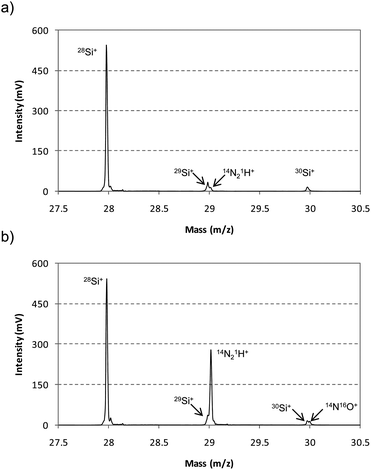 | ||
| Fig. 6 Mass spectrum obtained between m/z 27.5 and 30.5 for the analysis of the Si wafer using the mixture 0.2% H2 + Ar as discharge gas. Different after-peak window times were selected at the pulse profile. (a) Ion signals extracted at 170 μs after the end of the GD pulse (optimum position free of interferences) and (b) ion signals extracted at 70 μs after the end of the GD pulse. | ||
In order to evaluate the influence of endogenous hydrogen, the mass spectrum interval between 27.5 m/z and 31.5 m/z was studied for the analysis of the n-a-Si:H thin film (P doped) using pure Ar as discharge gas. Two different positions at the pulse profiles after the end of the GD pulse were investigated: 170 μs and 70 μs (Fig. 7a and b, respectively). As can be observed, 28Si+, 29Si+, 30Si+ and 31P+ were properly resolved from the polyatomic interferences in both cases and the isotopic ratios 28Si+/29Si+ and 28Si+/30Si+ showed always deviations below 6% from the natural isotope abundance ratios. It should be noted that the selected pulse profile positions were the same than those selected for the non-hydrogenated sample (Fig. 5a) and, therefore, it could be highlighted that the presence of endogenous hydrogen do not have a significant influence on the selection of the pulse profile position. However, the influence of exogenous hydrogen can be clearly appreciated again in Fig. 7c, where the mixture 0.2% H2 + Ar was employed as discharge gas. Ion signals were extracted at 70 μs after the end of the GD pulse and it can be observed as 28Si+ and, especially, 29Si+, 30Si+ and 31P+ were not well resolved from their polyatomic interferences. Hence, it could be concluded that a careful selection of the temporal time window in the after-peak region is critical to reduce the presence of polyatomic interferences when exogenous hydrogen is present in the plasma.
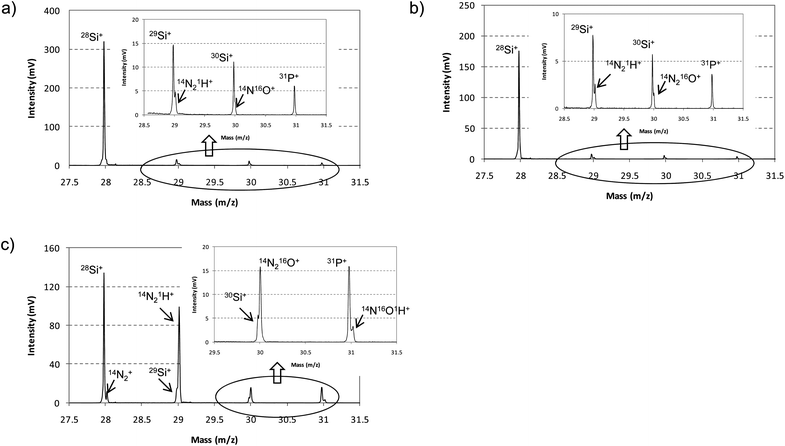 | ||
| Fig. 7 Mass spectrum obtained between m/z 27.5 and 31.5 for the analysis of the n-a-Si:H thin film using pure Ar and the mixture 0.2% H2 + Ar as discharge gas. Different after-peak window times were selected at the pulse profile. (a) Ion signals extracted at 170 μs after the end of the GD pulse (pure Ar); (b) ion signals extracted at 70 μs after the end of the GD pulse (pure Ar); (c) ion signals extracted at 70 μs after the end of the GD pulse (H2 + Ar mixture). | ||
Qualitative depth profiling analysis of B and P doped a-Si:H thin films
Considering the pulse profile positions selected in the after-peak region as the optimum for each analyte, the capability of rf-PGD-ToFMS for depth profiling analysis of a-Si:H thin films was investigated using both Ar and the mixture 0.2% H2 + Ar as discharge gas. Fig. 8 shows the qualitative depth profiles obtained for the n-a-Si:H (Fig. 8a) and p-a-SiC:H (Fig. 8b) thin films using pure Ar. As can be seen, the doping elements (11B+ and 31P+) were perfectly discriminated in both cases with a good depth resolution. Moreover, it should be stated that the presence of endogenous hydrogen in the samples can be clearly confirmed through the 1H3+ signal. Fig. 8c and d collect the corresponding qualitative depth profiles using the mixture 0.2% H2 + Ar. Reduced penetration rates were measured for the thin layers containing endogenous hydrogen together with externally added hydrogen in the plasma. Despite such lower penetration rates, enhanced signal intensities were obtained for Si (for P and, especially for B, were lower). However, it is worth noting that depth profiles for the doped hydrogenated amorphous silicon thin films showed a worse depth resolution compared to those obtained using pure Ar plasmas. This fact can be attributed to the discharge experimental conditions, which for ion signals comparison purposes were optimized by using pure Ar. Additionally, the maximum intensity obtained for 1H3+ ion signals was higher (15-fold higher) using the mixture 0.2% H2 + Ar than those obtained for pure Ar, and a high background signal along the profile can be observed due to the continuous addition of molecular hydrogen to the discharge gas.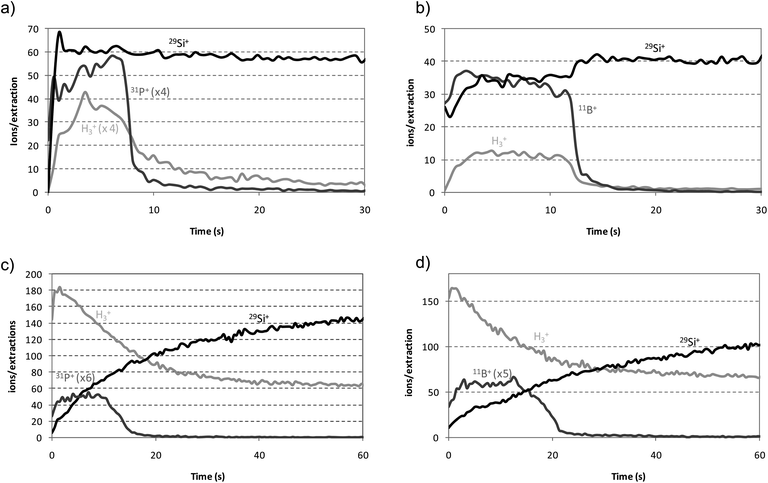 | ||
| Fig. 8 Qualitative depth profiles of doped a-Si:H thin films by rf-PGD-ToFMS. Operating conditions: 90 W, 700 Pa, 2 ms pulse width and 4 ms pulse period. (a) n-a-Si:H thin film (pure Ar); (b) p-a-SiC:H thin film (pure Ar); (c) n-a-Si:H thin film (H2 + Ar mixture); (d) p-a-SiC:H thin film (H2 + Ar mixture). | ||
Conclusions
To assess the potential of rf-PGD-ToFMS for the rapid analysis of a-Si:H thin films, the effect of two possible hydrogen sources (as discharge gas or sample constituent) on the pulse profiles, spectral interferences and depth resolution has been evaluated. A comparative study has been performed for non-hydrogenated materials (containing B, P and Si) and for three types of hydrogenated samples based on a-Si:H thin films using pure Ar and a mixture 0.2% H2 + Ar as discharge gas. Concerning the pulse profiles obtained by rf-PGD-ToFMS, the effect of molecular hydrogen added to the discharge gas plays a more important role than the hydrogen sputtered directly from the sample. In this later case, the H atoms sputtered from the sample in a pure Ar discharge did not exhibit enough influence to modify the pulse profile or even suppress the after-peak signals as has been observed for exogenous hydrogen (both for the hydrogen related ions and the analytes). Moreover, the effect of added hydrogen on the mass spectrum and the spectral interferences has also been evaluated, particularly for the analytes of interest (i.e., 11B+, 28Si+, 29Si+, 30Si+ and 31P+). Results have shown that the presence of exogenous hydrogen requires a careful selection of the appropriate temporal time window in the after-peak region in order to obtain mass spectra with more intense signals and free from polyatomic interferences. However, when the presence of hydrogen on the GD plasma is due to the sputtering of the sample, this optimisation is not so critical since endogenous hydrogen did not have a significant influence neither on the pulse profiles nor on the formation of polyatomic interferences. Concerning qualitative depth profiles, a good depth resolution was observed for the analysis of hydrogenated thin layers doped with B/C and P (p-a-SiC:H and n-a-Si:H, respectively).Therefore, it could be concluded that the results demonstrated that when hydrogen originates from the discharge gas the influence is always more pronounced than that of endogenous hydrogen present in the sample itself (samples with hydrogen content below 10%). These investigations can lead to future improvement in the quantification algorithms for routine rf-PGD-ToFMS analysis, developed to correct for such effects and, so, provide robust and accurate results for eventual quantitative depth profile analysis of these important types of modern solar cell materials.
Acknowledgements
Financial support from “Plan Nacional de I + D + I” (Spanish Ministry of Science and Innovation and FEDER Programme) through MAT2010-20921-CO2-01 is acknowledged. B. Fernandez acknowledges financial support from “Juan de la Cierva” Research Program of the Ministry of Science and Innovation of Spain co-financed by the European Social Fund. Finally, we are especially thankful for the contract with Horiba Jobin Yvon for the loan of the GD-ToFMS instrument.References
- E. Serrano, G. Rus and J. García-Martínez, Renewable Sustainable Energy Rev., 2009, 13, 2373–2384 CrossRef CAS.
- B. Parida, S. Iniyan and R. Goic, Renewable Sustainable Energy Rev., 2011, 15, 1625–1636 CrossRef CAS.
- L. V. Mercaldo, M. L. Addonizio, M. D. Noce, P. D. Veneri, A. Scognamiglio and C. Privato, Appl. Energy, 2009, 86, 1836–1844 CrossRef CAS.
- R. E. I. Schropp and M. Zeman, Amorphous and Microcrystalline Silicon Solar Cells: Modeling, Materials and Device Technology, Kluwer Academic Publishers, Massachusetts, 1998 Search PubMed.
- J. Pisonero, B. Fernández and D. Günther, J. Anal. At. Spectrom., 2009, 24, 1145–1160 RSC.
- I. Martin-Bragado and N. Zographos, Solid-State Electron., 2011, 55, 25–28 Search PubMed.
- B. C. Johnson, P. Caradonna and J. C. McCallum, Mater. Sci. Eng., B, 2009, 157, 6–10 Search PubMed.
- R. Escobar Galindo, R. Gago, A. Lousa and J. M. Albella, TrAC, Trends Anal. Chem., 2009, 28, 494–505 CrossRef.
- A. B. Tolstoguzov, J. Anal. Chem., 2010, 65, 1370–1376 CrossRef CAS.
- R. Pereiro, A. Solà-Vázquez, L. Lobo, J. Pisonero, N. Bordel, J. M. Costa and A. Sanz-Medel, Spectrochim. Acta, Part B, 2011, 66, 399–412 Search PubMed.
- Ph. Belenguer, M. Ganciu, Ph. Guillot and Th. Nelis, Spectrochim. Acta, Part B, 2009, 64, 623–641 CrossRef.
- M. Bustelo, B. Fernández, J. Pisonero, R. Pereiro, N. Bordel and A. Sanz-Medel, Anal. Chem., 2011, 83, 329–337 CrossRef CAS.
- N. Tuccitto, L. Lobo, A. Tempez, I. Delfanti, P. Chapon, S. Canulescu, N. Bordel, J. Michler and A. Licciardello, Rapid Commun. Mass Spectrom., 2009, 23, 549–556 CrossRef CAS.
- J. Pisonero, L. Lobo, N. Bordel, A. Tempez, A. Bensaoula, N. Badi and A. Sanz-Medel, Sol. Energy Mater. Sol. Cells, 2010, 94, 1352–1357 CrossRef CAS.
- A. Tempez, S. Canulescu, I. S. Molchan, M. Döbeli, J. A. Whitby, L. Lobo, J. Michler, G. E. Thompson, N. Bordel, P. Chapon, P. Skeldon, I. Delfanti, N. Tuccitto and A. Licciardello, Surf. Interface Anal., 2009, 41, 966–973 CrossRef CAS.
- V. D. Hodoroaba, E. B. M. Steers, V. Hoffmann, W. E. S. Unger, W. Paatsch and K. Wetzig, J. Anal. At. Spectrom., 2003, 18, 521–526 RSC.
- A. Martin, A. Menendez, R. Pereiro, N. Bordel and A. Sanz-Medel, Anal. Bioanal. Chem., 2007, 388, 1573–1582 CrossRef CAS.
- T. Tanaka, M. Matsuno, J. C. Woo and H. Kawaguchi, Anal. Sci., 1996, 12, 591–595 CrossRef CAS.
- M. Hohl, A. Kanzari, J. Michler, Th. Nelis, K. Fuher and M. Gonin, Surf. Interface Anal., 2006, 38, 292–295 CrossRef CAS.
- M. A. Green, J. Mater. Sci.: Mater. Electron., 2007, 18, S15–S19 Search PubMed.
- Ph. Belenguer, M. Ganciu, Ph. Guillot and Th. Nelis, Spectrochim. Acta, Part B, 2009, 64, 623–641 CrossRef.
- A. Bogaerts, R. Gijbels and G. P. Jackson, J. Anal. At. Spectrom., 2003, 18, 533–548 RSC.
- A. Bogaerts, J. Anal. At. Spectrom., 2007, 22, 502–512 RSC.
- A. Bogaerts, J. Anal. At. Spectrom., 2008, 23, 1476–1486 RSC.
- A. Bogaerts, J. Anal. At. Spectrom., 2002, 17, 768–779 RSC.
| This journal is © The Royal Society of Chemistry 2012 |