Combination of a multimode sample introduction system with a pre-evaporation tube to improve multi-element analysis by ICP-OES
Alemayehu
Asfaw
and
Diane
Beauchemin
*
Chemistry Department, Queen's University, Kingston, Ontario, Canada K7L 3N6. E-mail: diane.beauchemin@chem.queensu.ca
First published on 4th November 2011
Abstract
A pre-evaporation tube (heated to 400 °C) was inserted between a multi-mode sample introduction system (MSIS) and the plasma torch in inductively coupled plasma optical emission spectrometry (ICP-OES) to improve the simultaneous determination of hydride-forming and other elements. Multivariate optimisations were conducted to find operating conditions improving plasma robustness. Under these conditions and compared to conventional sample introduction with a pneumatic nebulizer and spray chamber, using MSIS with a pre-evaporation tube (PET) improved sensitivity and detection limits for hydride-forming elements (As, Sn, Hg, Sb and Bi) and other elements as well. In order to obtain a significant improvement for all elements, irrespective of hydride formation or not, the pneumatic nebulizer was replaced by an ultrasonic nebulizer (USN) and the same experimental conditions were used for the simultaneous introduction of aerosol and hydrides (from the MSIS) into a PET. With USN-MSIS-PET, the figures of merit of ICP-OES improved by over an order of magnitude for both hydride-forming elements and other elements compared to those with a conventional sample introduction system. Furthermore, using either PN-MSIS-PET or USN-MSIS-PET increased plasma robustness, likely as a result of the hydrogen gas by-product of hydride generation, which was reported to increase energy transfer within the plasma, and from the introduction of water vapor (with PET), which was reported to improve plasma stability as well as sensitivity. Good agreement with certified values was obtained when this approach was applied to the determination of hydride-forming and other elements in environmental certified reference materials.
Introduction
Among the available atomic spectrometry techniques, inductively coupled plasma mass spectrometry (ICP-MS) and optical emission spectrometry (ICP-OES) are the predominant methods for simultaneous multi-element analysis of various samples.1 In both cases, the sample (which is usually an aqueous solution) is introduced into the plasma via a conventional sample introduction system consisting of a pneumatic nebulizer (PN) and a spray chamber2 where, depending on the sample uptake rate, more than 95% of the sample goes down to the drain. With such a sample introduction system, analytes are not separated from the matrix, which may result in matrix-induced spectroscopic and non-spectroscopic interferences in ICP-OES and especially ICP-MS. For instance, although significant improvements were made to ICP-MS instruments, such as lower detection limit and decreased instrument size, matrix effects remain a most important shortcoming.3Many alternative sample introduction systems were developed to improve the analytical performance of plasma spectrometric techniques, including chemical vapor generation (CVG) by reaction with NaBH4 in acidic medium,4–6 which involves efficient generation of volatile hydrides, separation of the gaseous phase from the liquid phase and transportation of the gases to the detector. This translates into higher sensitivity and lower detection limits. Furthermore, separation of the volatile hydrides from the matrix minimizes potential spectroscopic and non-spectroscopic interferences. However, only a few elements (As, Bi, Cd, Hg, Ge, Pb, Sb, Se and Sn5,6) form stable hydride/cold vapor. Although some transition (Co, Cr, Cu, Fe, Mn, Ni, An, Ti, and Tl) and noble metals (Au, Ag, Pd, Pt, Rd, Rh, and Os) were also reported to form some volatile species,7–9 the efficiency of their chemical vapor generation is significantly inferior to that of conventional hydride-forming elements,9 and the resulting volatile species are unstable.6,7 Furthermore, vapor generation for the transition and noble metals follows different routes from the “classical” hydride-forming elements,10 which prevents the simultaneous determination of all these elements. Even different conventional hydride-forming elements require different reaction conditions for efficient generation of volatile hydrides.11,12 As a result, the technique is typically used for the determination of a single element or a few elements in most cases.5
Alternative sample introduction systems have thus been developed to enable the simultaneous introduction of volatile hydrides/vapors along with nonvapor-forming elements.13–20 For example, a commercially available multimode sample introduction (MSIS)15 has been used for the simultaneous determination of hydride-forming and other elements using ICP-OES13,15,21–23 or ICP-MS.13,21,24 Compared to conventional pneumatic nebulization, the sensitivity and detection limit of hydride-forming elements are improved significantly without affecting those for other elements when the MSIS is operated in dual mode (i.e., both nebulization and hydride generation).13,15,20–25 In most cases, however, the improvement in sensitivity of the vapor-forming elements is greater than in detection limits.13,15,24 Furthermore, the analytical figures of merit for some nonhydride-forming elements deteriorate.19,23 In addition, when both nebulization and vapour generation are performed simultaneously, the matrix separation advantage of CVG is lost. For example, matrix-derived spectroscopic interferences hindered the simultaneous determination of hydride-forming and nonhydride-forming elements in complex metallurgical samples by ICP-OES.23 In such cases, the two types of elements must then be determined separately with the apparatus in either CVG mode or nebulization mode.15
An alternative way of increasing the sample introduction efficiency in ICP spectrometry is to use an ultrasonic nebulizer (USN) with a desolvation system, which is required to reduce the solvent load and usually consists of a heater/condenser (HC) to respectively vaporize and condense as much solvent as possible. A further reduction in solvent load can be achieved by also using a membrane desolvator (MD).26 As solvent removal effectively pre-concentrates the analytes, increased sample introduction efficiency translates in orders of magnitude improvement in sensitivity and detection limit versus conventional nebulization systems in ICP-OES.27,28 However, desolvation preconcentrates the matrix along with analytes, which exacerbates matrix effects29 compared to those observed with either conventional sample introduction30–32 or hydride generation systems.32
On the other hand, inserting a pre-evaporation tube (PET) that is heated to about 400 °C between the spray chamber and the torch to vaporize the aerosol exiting the spray chamber without removing water improved both sensitivity and detection limits for multi-elemental analysis by ICP-MS.33–35 In fact, for most of the analytes, the improvement in detection limit was greater than in sensitivity, which may be attributed to a reduction in noise arising from droplet desolvation, as a result of the smaller average droplet size of the aerosol entering the plasma.33,34 Replacing the whole desolvation system of USN-HC-MD with a PET similarly improved the analytical performance (i.e. sensitivity, detection limit, and plasma robustness) of ICP-OES.36 The significant improvement in plasma robustness was attributed to the water vapour that was preserved by the PET,36 as water aerosol significantly increases the noise level and decreases both the ionization temperature and electron number density of the ICP,37 whereas improved sensitivity and detection limits result when water is introduced in the form of vapor, as was also demonstrated by Paredes et al.38 who heated the spray chamber of a low sample consumption system to 105 °C. Moreover, the hydrogen by-product of the hydride generation process can improve the plasma characteristics in ICP-OES,32,39 just like addition of hydrogen to the carrier gas of an USN system can increase both the ionization and excitation temperatures as well as the electron number density.40,41
Hence, coupling MSIS with PET could be valuable, as it may combine the improvement in sensitivity and detection limit afforded by MSIS for hydride-forming elements with that provided for other elements by PET. Indeed, an increased robustness should be provided by the water vapour that is preserved by the PET as well as from the hydrogen by-product of vapour generation in the MSIS. The objective of the current work was thus to investigate the effect of combining MSIS and PET with either pneumatic or ultrasonic nebulization systems on the analytical performance (sensitivity, detection limit and plasma robustness) of ICP-OES for the simultaneous determination of hydride-forming and other elements, and its applicability to the analysis of environmental samples. A multivariate experimental design was used to identify and optimize important experimental parameters so as to obtain robust plasma conditions, as assessed from the emission intensity ratio of MgII 280.270 nm to MgI 285.213 nm (MgII/MgI) and from the intensity of Ar emission line. The accuracy of the method was assessed by analyzing certified reference materials.
Experimental section
Instrumentation
A radial view ARCOS ICP-OES instrument (SPECTRO Analytical Instruments, Kleve, Germany) equipped with a cross-flow nebulizer and Scott double-pass spray chamber was used. This standard sample introduction system was also replaced by an MSIS with either a Mira-Mist parallel path nebulizer (Burgener Research, Mississauga, Ontario, Canada) or a U-6000 AT+ ultrasonic nebulizer (CETAC Technologies, Omaha, Nebraska, USA), which was coupled to the ICP torch using a PET fabricated in-house. Operating conditions, including the optimized ones that were used for the analysis of certified reference materials, are summarized in Table 1.| Radial view ICP-OES | SPECTRO ARCOS |
|---|---|
| a Optimized values used for the analysis of certified reference materials. | |
| RF-power /kW | 1.4 |
| Plasma observation height/mm | 11 |
| Ar plasma gas flow rate/ L min−1 | 12 |
| Ar auxiliary gas flow rate/ L min−1 | 1.00 |
| Pre-evaporation tube temperature/°C | 400 |
| Conventional PN | |
|---|---|
| Nebulizer | Cross-flow |
| Spray chamber | Scott-type double-pass |
| Sample uptake rate/mL min−1 | 2.0 |
| Ar aerosol carrier gas flow rate/L min−1 | 0.75 |
| PN- or USN-MSIS | |
|---|---|
| Nebulizer | Mira Mist or U-6000 AT+ USN with heater at 140 °C and condenser at 3 °C |
| Ar aerosol carrier gas flow rate/L min−1 | 0.60a |
| Sample uptake rate/mL min−1 | 2.0 |
| Vapor generation sample uptake rate/mL min−1 | 2.0 |
| NaBH4 solution uptake rate/mL/min−1 | 2.0 |
| HNO3 concentration/mol L−1 | 1.0a |
| NaBH4 solution concentration (% m/m) | 2.0a |
| USN | |
|---|---|
| Sample uptake rate/mL min−1 | 2.0 |
| Ar aerosol carrier gas flow rate/L min−1 | 0.75 |
| USN heater temperature/°C | 140 |
| USN condenser temperature/°C | 3 |
| MD temperature/°C | 140 |
| MD Ar sweep gas flow rate/L min−1 | 2.0 |
Combination of MSIS with PET
Fig. 1 shows a schematic diagram of the MSIS-PET sample introduction system used for the simultaneous introduction of hydride-forming and other elements into ICP-OES, i.e. the MSIS was operated in dual mode.15 Samples/standards and NaBH4 solutions were pumped to the inlets of the MSIS using the ICP-OES instrument's peristaltic pump. The sample passed through both the vapor generation line (VG line) and pneumatic nebulizer (Fig. 1a), or USN (Fig. 1b). Hydrides formed in the MSIS upon reaction of the acidified sample (passing through the VG line) with NaBH4, and the aerosols from the PN (Fig. 1a) or USN (Fig. 1b) were simultaneously entrained into the ICP through the pre-evaporation tube by Ar aerosol carrier gas. In the case of USN-MSIS-PET (Fig. 1b), the aerosol sequentially passed through a heater and condenser before flowing into the MSIS.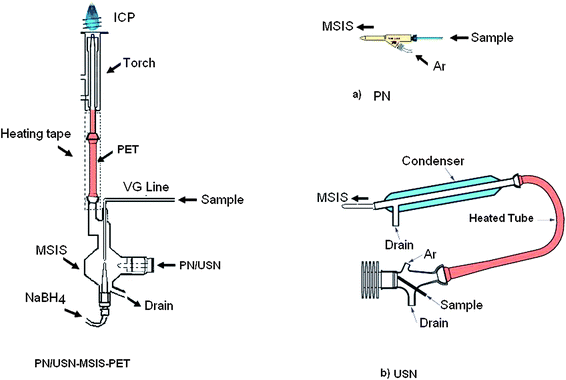 | ||
| Fig. 1 PN/USN-MSIS-PET: multimode sample introduction system (MSIS) combined with a pre-evaporation tube (PET) for simultaneous introduction of aerosol from Mira-Mist parallel path pneumatic nebulizer, PN, (a) or ultrasonic nebulizer, USN (b) and vapors from MSIS into ICP-OES. With permissions from Burgener and CETAC to reproduce figures of their nebulizers. | ||
Pre-evaporation tube
An 8 cm long pre-evaporation glass tube, with a 5 mm internal diameter and 12 mm/5 mm ground glass ball and socket joint, was used to connect the MSIS with ICP-OES, as shown in Fig. 1. The tube and the bottom 3 cm of the ICP torch were heated to 200–400 °C with OMEGALUX flexible heating tape (OMEGA Engineering Inc., Stamford Connecticut, USA), which was controlled by a Mantle-Minder temperature controller PL512 (GLAS-COL apparatus company), using a temperature probe inserted between the tube and the heating tape.Samples, standards and reagents
A multi-element 10 mg L−1 stock solution (Al, As, Ba, Be, Bi, Ca, Cd, Co, Cr, Cu, Fe, Ga, Ge, Hg, K, La, Mg, Mn, Mo, Ni, P, Pb, S, Sb, Sc, Sn, Sr, Ti, V, W, Y, Zn and Zr) was prepared through dilution of 1000 mg L−1 mono-elemental plasma standard solutions (SPEX Industries Inc. Edison, NJ, USA and SCP Science, Baie d'Urfé, Quebec, Canada) with 2% HNO3. More diluted multi-element solutions were prepared daily by dilution of this stock solution with 1 mol L−1HNO3. The dilution was made using doubly de-ionized water, DDW (18 Ω cm−1 Milli-Q, Millipore, Harrick Scientific Corporation, Ossining NY, USA), and high-purity nitric acid (J. T. Baker, Phillipsburg, NJ, USA).For hydride generation, 2.0% m/v NaBH4 was prepared from 98% pure NaBH4 (ACROS ORGANICS, New Jersey, USA) in 0.1 mol L−1 ACS reagent grade NaOH (Bio Shop Canada Inc., Burlington, ON, Canada). L-Cysteine solution (10% m/m) was prepared by dissolving SigmaUltra >99% grade L-cysteine hydrochloride monohydrate (Sigma-Aldrich Chemie Gmbh, Steinheim, Germany) in DDW. ULTREX II ultrapure reagent grade acids (HCl, 37%, and HNO3, 70%) and hydrogen peroxide (30%) (J. T. Baker, Phillipsburg, NJ, USA) were used to digest two Montana soil standard reference materials (SRM 2710 “with highly elevated trace element concentration” and SRM 2711 “with moderately elevated trace element concentration”) from the National Institute of Standards and Technology (NIST, Gaithersburg, MD, USA) and a fish protein certified reference material (DORM-3) from the National Research Council of Canada (NRCC, Ottawa, Canada).
Sample preparation
SRM 2711 and 2710 soils were digested using either an aqua-regia reflux or hot plate digestion, as described previously.36 Briefly, for hot plate digestion, 0.5 g of soil SRM was accurately weighed into a Teflon decomposition vessel (Savillex), to which 5.0 mL each of concentrated HNO3 and concentrated HCl were added. The mixture was heated on a hot plate at 200 °C for 48 h and taken to dryness at 60 °C for 24 h. Then, 1 mL of HF, 3 mL of HNO3 and 2 mL of HCl were added to the dried sample, which was heated and dried as above. To the dried samples, 5 mL of 2% HNO3 was added to make a suspension. The suspension was then sonicated for 10 min followed by centrifugation. The filtrate was diluted to 20 g with 2% HNO3 and stored in polyethylene bottles. For aqua regia reflux, 0.5 g of soil SRM was placed in a 100 mL round bottom flask, to which 12 mL of aqua regia (3![[thin space (1/6-em)]](https://www.rsc.org/images/entities/char_2009.gif) :1, HNO3:HCl) was added and a condenser was attached. The mixture was pre-digested for 24 h at room temperature; then, the suspension was refluxed at 90 °C for 2 h. Finally, the suspension was filtered through an ashless Whatman 40 filter (Fisher Scientific, Ottawa, Ontario, Canada), after which the filtrate was diluted with 2% HNO3 and stored in polyethylene bottles. For the analyses using PN-MSIS-PET or USN-MSIS-PET, L-cysteine and HNO3 were added to 2.0 g of filtrate, which was diluted to 25 g with DDW, yielding final concentrations of 1.0 M HNO3 and 1% m/m L-cysteine.
:1, HNO3:HCl) was added and a condenser was attached. The mixture was pre-digested for 24 h at room temperature; then, the suspension was refluxed at 90 °C for 2 h. Finally, the suspension was filtered through an ashless Whatman 40 filter (Fisher Scientific, Ottawa, Ontario, Canada), after which the filtrate was diluted with 2% HNO3 and stored in polyethylene bottles. For the analyses using PN-MSIS-PET or USN-MSIS-PET, L-cysteine and HNO3 were added to 2.0 g of filtrate, which was diluted to 25 g with DDW, yielding final concentrations of 1.0 M HNO3 and 1% m/m L-cysteine.
A CEM Mars 5 (CEM, Matthews, NC, USA) closed-vessel microwave digestion system was used to digest 0.1–0.2 g DORM-3 in 1.75 mL of concentrated HNO3, 1.25 mL of concentrated H2O2 and 3 mL of DDW, with the oven temperature increasing linearly from 25 to 200 °C for 10 min and staying constant for 20 min at 200 °C. After cooling, each digest was transferred into glass vials. Prior to analysis, L-cysteine and HNO3 were added to each digest, which was diluted to 15 g with DDW to yield 1.0 M HNO3 and 1% m/m L-cysteine.
Multivariate optimization
Depending on the operating conditions, a local thermodynamic equilibrium (LTE) may be reached in an ICP,42 which translates into efficient energy transfer between the bulk plasma and the central channel. Under such robust conditions, plasma excitation is not significantly affected by changes in matrix composition or solvent loading. Due to the similarity in their excitation energies, the MgII 280.270 nm and MgI 285.213 nm lines are most widely used to assess plasma robustness, which varies proportionately to the MgII/MgI intensity ratio, a ratio of at least 10 indicating a robust plasma.42,43 Parameters that most affect plasma temperatures and electron number densities are the RF power, carrier gas flow rate, plasma observation height, and internal diameter of the torch injector. With hydride generation, the concentrations of acid and NaBH4, which affect the vapour generation efficiency,5 also influence the plasma characteristics.32,39 As a robust plasma is often obtained at high RF power,43 1.4 kW was used while other parameters were optimized by multivariate experimental design using a 100 μg L−1 multi-element solution.For PN-MSIS-PET, two experimental designs were used to identify and then optimize important parameters. A Plackett–Burman experimental design (Table 2), which is a simple two-level factorial design that provides information on the main effects of factors without their interaction,44 was used to assess the effect of sample flow rate, carrier gas flow rate, plasma observation height, and concentrations of HNO3 and NaBH4 on plasma robustness and on vapor generation efficiency. The plasma observation height was measured relative to the base position (which is itself 11 mm above the load coil). Analysis of the response gave the significance of the estimated effects with p < 0.05.
| Run | Experimental designa (coded unit) | Experimental valuesa | ||||||||
|---|---|---|---|---|---|---|---|---|---|---|
| A | B | C | D | E | A | B | C | D | E | |
| a A, sample and NaBH4 uptake rate (mL min−1); B, aerosol carrier gas flow rate (L min−1); C, relative plasma observation height (mm); D, NaBH4 concentration (%); and E, HNO3 concentration (mol L−1). | ||||||||||
| 1 | +1 | −1 | +1 | −1 | −1 | 3 | 0.5 | 6 | 0.5 | 0.1 |
| 2 | +1 | +1 | −1 | +1 | −1 | 3 | 1.0 | 0 | 2.0 | 0.1 |
| 3 | −1 | +1 | +1 | −1 | +1 | 1 | 1.0 | 6 | 0.5 | 2.0 |
| 4 | +1 | −1 | +1 | +1 | −1 | 3 | 0.5 | 6 | 2.0 | 0.1 |
| 5 | +1 | +1 | −1 | +1 | +1 | 3 | 1.0 | 0 | 2.0 | 2.0 |
| 6 | +1 | +1 | +1 | −1 | +1 | 3 | 1.0 | 6 | 0.5 | 2.0 |
| 7 | −1 | +1 | +1 | +1 | −1 | 1 | 1.0 | 6 | 2.0 | 0.1 |
| 8 | −1 | −1 | +1 | +1 | +1 | 1 | 0.5 | 6 | 2.0 | 2.0 |
| 9 | −1 | −1 | −1 | +1 | +1 | 1 | 0.5 | 0 | 2.0 | 2.0 |
| 10 | +1 | −1 | −1 | −1 | +1 | 3 | 0.5 | 0 | 0.5 | 2.0 |
| 11 | −1 | +1 | −1 | −1 | −1 | 1 | 1.0 | 0 | 0.5 | 0.1 |
| 12 | −1 | −1 | −1 | −1 | −1 | 1 | 0.5 | 0 | 0.5 | 0.1 |
A central composite design, which is the most commonly used response surface methodology for multivariate optimization in analytical chemistry,45 was then applied to the optimization of the most influential parameters (i.e., carrier gas flow rate, concentrations of NaBH4 and HNO3) in 20 randomized experiments (Table 3). During optimization, emission lines of As and Mn were monitored in addition to the MgII/MgI ratio and Ar emission line to assess their sensitivity under robust conditions. Sensitive atomic and ionic emission lines that are free from potential spectroscopic interference were selected.
| Run | Experimental design (coded unit) | Experimental values | ||||
|---|---|---|---|---|---|---|
| [NaBH4] | [HNO3] | Aerosol carrier gas flow rate | [NaBH4] (%) | [HNO3]/mol L−1 | Aerosol carrier gas flow rate/L min−1 | |
| 1 | −1 | −1 | −1 | 0.50 | 0.10 | 0.50 |
| 2 | +1 | −1 | −1 | 2.00 | 0.10 | 0.50 |
| 3 | −1 | +1 | −1 | 0.50 | 2.00 | 0.50 |
| 4 | +1 | +1 | −1 | 2.00 | 2.00 | 0.50 |
| 5 | −1 | −1 | +1 | 0.50 | 0.10 | 1.00 |
| 6 | +1 | −1 | +1 | 2.00 | 0.10 | 1.00 |
| 7 | −1 | +1 | +1 | 0.50 | 2.00 | 1.00 |
| 8 | +1 | +1 | +1 | 2.00 | 2.00 | 1.00 |
| 9 | −1.68 | 0 | 0 | 0.00 | 1.05 | 0.75 |
| 10 | 1.68 | 0 | 0 | 2.51 | 1.05 | 0.75 |
| 11 | 0 | −1.68 | 0 | 1.25 | 0.00 | 0.75 |
| 12 | 0 | 1.68 | 0 | 1.25 | 2.65 | 0.75 |
| 13 | 0 | 0 | −1.68 | 1.25 | 1.05 | 0.40 |
| 14 | 0 | 0 | 1.68 | 1.25 | 1.05 | 1.17 |
| 15 | 0 | 0 | 0 | 1.25 | 1.05 | 0.75 |
| 16 | 0 | 0 | 0 | 1.25 | 1.05 | 0.75 |
| 17 | 0 | 0 | 0 | 1.25 | 1.05 | 0.75 |
| 18 | 0 | 0 | 0 | 1.25 | 1.05 | 0.75 |
| 19 | 0 | 0 | 0 | 1.25 | 1.05 | 0.75 |
| 20 | 0 | 0 | 0 | 1.25 | 1.05 | 0.75 |
Data analysis
MINITAB Release 14 software (Minitab Inc.) was used to perform experimental designs, Student's t-test and data analysis. Two points (one on each side of each emission peak) were used for polynomial background correction (Smart Analyzer Vision software, SPECTRO Analytical Instruments, Kleve, Germany) of the atomic and ionic emission signals.Results and discussion
Identification of important parameters
The Pareto chart (p = 0.05) produced by the Plackett–Burman design is shown in Fig. 2 for MgII/MgI emission ratio as well as for the emission intensities of Ar, As and Mn. Evidently, over the studied range, different parameters had different effects on the MgII/MgI ratio and on the emission intensities of As, Ar and Mn. As expected,43,46–47 increasing plasma observation height above the load coil (i.e. above 11 mm) had a negative effect on plasma robustness (MgII/MgI and Ar emission intensity) and on the intensities of both hydride- and nonhydride-forming elements, as exemplified by As and Mn, respectively. Hence, the plasma observation height was set to the base position, i.e., 11 mm above the load coil, for the rest of this work.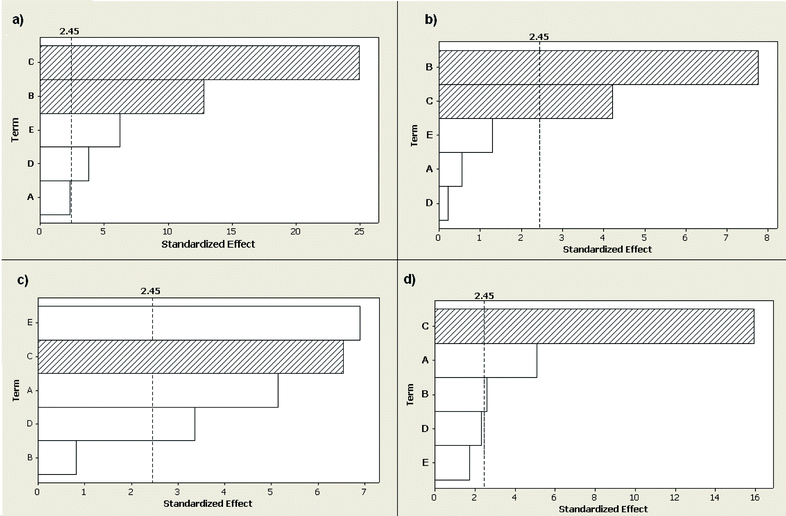 | ||
| Fig. 2 Standardized main effect Pareto chart obtained from Plackett–Burman experimental design for: (a) Mg 280.270 nm to Mg 285.213 nm line intensity ratio (MgII/MgI); (b) emission intensity of Ar 430.010 nm; (c) emission intensity of As I 189.042 nm; (d) emission intensity of MnII 257.611 nm; with factors: sample and NaBH4 uptake rate (A); aerosol carrier gas flow rate (B); relative plasma observation height (C); concentration of NaBH4 (D); and concentration of HNO3 (E). White and crossed bars indicate positive and negative effects, respectively. The dotted line indicates an effect that becomes significant at a 95% confidence level. | ||
Also as expected,43 increasing the aerosol carrier gas flow rate had a negative effect on MgII/MgI and on Ar emission intensity, the optimum carrier gas flow rate in terms of robustness depending on the instrument.32 However, it also had a slight positive effect on Mn emission intensity and no significant effect on As intensity (Fig. 2). Because the aerosol carrier gas flow rate affects analyte transport efficiency and residence time in the plasma, further optimization of this parameter was warranted to achieve both plasma robustness and efficient analyte transport into the ICP.
On the other hand, 1–3 mL min−1 sample and NaBH4 uptake rates had no significant effect on MgII/MgI emission intensity ratio and Ar emission line intensity, while they had a positive effect on the emission intensities of As and Mn. This is in agreement with the work of Grotti et al.32 under robust plasma conditions, where the Mg ratio was not significantly affected by sample uptake rate over the 0.25–1.8 mL min−1 range, which was attributed to tolerance of the plasma to water loading. However, in another work with dual mode sample introduction using a different design than the MSIS, increasing the uptake rate above 0.4 (for NaBH4) and 0.8 mL min−1 (for the sample) significantly decreased the Mg ratio.19 The increased robustness observed in the present work with PN-MSIS-PET likely arises from the combined effect of hydrogen, a by-product of hydride generation,39 which is known to improve energy transfer from the plasma to the central channel because of its high thermal conductivity,42 and water pre-evaporation (further discussed below). It enabled an increase in sample and NaBH4 uptake rates up to 2.0 mL min−1 without significantly affecting plasma robustness while increasing analyte emission intensity.
The concentrations of HNO3 and NaBH4, which have been reported to affect the plasma characteristics,11,32,39 had a positive effect on the MgII/MgI emission intensity ratio and, as expected, on As emission intensity, without significantly affecting Mn and Ar emission intensities. Indeed, the hydrogen by-product of CVG can reduce the analyte signal suppression48 induced by increasing nitric acid concentration in ICP-OES49,50 with conventional nebulization under robust plasma conditions. This is likely why increasing the concentration of HNO3 did not significantly affect the emission intensity of the Mn ionic line in this work. In any case, the concentrations of NaBH4 and acid also critically influence vapour generation efficiency and plasma stability,5 the optimum acid concentration depending on the element.11,12 Thus, the combined effect of the carrier gas flow rate and the concentrations of acid and NaBH4 on the MgII/MgI intensity ratio and on the emission intensities of Ar, As and Mn was further investigated using a five-level central composite design, shown in Table 3.
Optimization using the combined effect of parameters
Regression analysis of the response surface generated by the composite design resulted in the following model for the MgII/MgI intensity ratio (MgR), considering only the terms at 95% confidence level:| MgR = 5.3 + 2.1[NaBH4] + 1.2[HNO3] + 6.2(Ar) − 0.6[NaBH4]2 − 0.4[HNO3]2 − 6.5(Ar)2 + 0.4[NaBH4][HNO3] − 0.8(Ar)[NaBH4] | (1) |
Analysis of variance confirmed that the experimental data fitted the model significantly (p < 0.05), the agreement between the experimental data and the model being characterized by correlation coefficient (R2) values higher than 0.985. Increasing the aerosol carrier gas flow rate above 0.6 L min−1 decreased the Mg ratio (Fig. 3a) and Ar emission intensity (not shown). With the carrier gas flow rate at 0.6 L min−1 (Fig. 3b), the Mg ratio went through a maximum upon increasing the acid concentration, and increasing the concentration of NaBH4 from 0.5 to 2.0% greatly increased plasma robustness, in agreement with previous reports.11,39 A Mg ratio of 10.4 was obtained with 1.0 mol L−1HNO3 and 2% NaBH4, which indicates the attainment of a robust plasma.43 These HNO3 and NaBH4 concentrations were also the optimum in terms of As sensitivity. Although the optimum carrier gas flow rates for As and Mn (0.7–0.8 L min−1) were different than that for the Mg ratio (0.6 L min−1), As and Mn emission intensities at the latter were not greatly sacrificed.
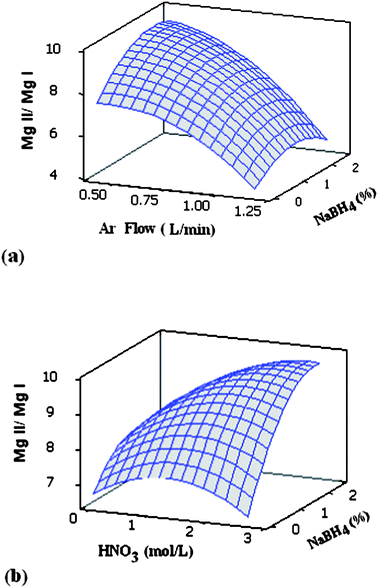 | ||
| Fig. 3 Combined effect of: (a) carrier gas flow rate (Ar flow) and concentration of NaBH4, (b) concentrations of HNO3 and NaBH4 on the MgII 280.270 nm/MgI 285.213 nm line intensity ratio (MgII/MgI). The concentrations of HNO3 (a) and carrier gas flow rate (b) were 1.05 mol L−1 and 0.6 L min−1, respectively. | ||
On the other hand, because an analyte's oxidation state can strongly affect its CVG efficiency, the use of an oxidizing agent such as HNO3 may be detrimental.51 Thus, the concentration of L-cysteine, a pre-reducing agent that can also act as a masking agent,52 was optimized over the range 0–2.5% m/m. As 1% m/m L-cysteine provided higher As, Bi and Sb intensities while having no significant effect on other elements, it was subsequently used for all standards and samples.
Sensitivity, detection limits and precision
Table 4 shows that the sensitivity, defined as the slope of the calibration curve, for hydride/vapour forming elements was significantly increased with either PN-MSIS-PET or USN-MSIS-PET compared to when using conventional USN or PN. In comparison to PN and USN, the average sensitivity increase with PN-MSIS-PET was by a factor of 58 ± 20 and 8.6 ± 4.8, respectively. Similarly, the average sensitivity enhancement factor with USN-MSIS-PET was 65 ± 26 and 10.1 ± 5.9 compared to PN and USN, respectively. Using USN instead of PN with MSIS-PET had no significant effect on sensitivities for hydride-forming elements, the average increase between USN-MSIS-PET and PN-MSIS-PET is 1.2 ± 0.4. For the other elements, it was 1.5 ± 0.4 with PN-MSIS-PET and 10.1 ± 2.1 with USN-MSIS-PET compared to that with PN, which is commensurate with the increased sample introduction efficiency achieved with USN. Hence, using USN-MSIS-PET, a significant improvement in sensitivity was obtained for all elements, not just elements forming stable hydride/vapour. In contrast, when the conventional USN is compared to PN, the average increase in sensitivity for all elements (hydride-forming or not) is 5.0 ± 3.7. The improvement in sensitivity for nonhydride-forming elements can be attributed to the MSIS and PET improving the plasma excitation efficiency. For instance, Pohl and Broekaert20 reported a higher electron number density during the simultaneous introduction of hydride and aerosol, which translated into more efficient excitation of elements.| Analyte line/nm | (A) | (B) | (C) | (D) | Factors | ||||||
|---|---|---|---|---|---|---|---|---|---|---|---|
| PN | USN | PN-MSIS-PET | USN-MSIS-PET | B/A | C/A | C/B | D/B | D/C | D/A | ||
| a Hg is lost in the USN desolvation system. | |||||||||||
| As I | 189.042 | 8 | 30 | 280 | 410 | 3.8 | 35.0 | 9.33 | 13.7 | 1.5 | 51.3 |
| Bi I | 223.061 | 6 | 60 | 220 | 250 | 10.0 | 36.7 | 3.67 | 4.2 | 1.1 | 41.7 |
| Ge II | 164.919 | 4 | 70 | 270 | 460 | 17.5 | 67.5 | 3.86 | 6.6 | 1.7 | 115.0 |
| Hg I | 184.950 | 20 | 1480 | 1300 | a | 74.0 | a | a | 0.9 | 65.0 | |
| Sb I | 206.833 | 7 | 50 | 580 | 380 | 7.1 | 82.9 | 11.60 | 7.6 | 0.7 | 54.3 |
| Sn II | 189.991 | 20 | 70 | 1030 | 1300 | 3.5 | 51.5 | 14.71 | 18.6 | 1.3 | 65.0 |
| Ba II | 455.400 | 1120 | 7080 | 922 | 7010 | 6.3 | 0.8 | 1.0 | 7.6 | 6.3 | |
| Be I | 234.861 | 1090 | 6910 | 985 | 8120 | 6.3 | 0.9 | 1.2 | 8.2 | 7.4 | |
| Cd II | 214.438 | 200 | 280 | 410 | 2510 | 1.4 | 2.1 | 9.0 | 6.1 | 12.6 | |
| Co II | 228.616 | 110 | 270 | 160 | 950 | 2.5 | 1.5 | 3.5 | 5.9 | 8.6 | |
| Cr II | 267.716 | 40 | 130 | 60 | 400 | 3.3 | 1.5 | 3.1 | 6.7 | 10.0 | |
| Cu II | 224.700 | 25 | 130 | 40 | 260 | 5.2 | 1.6 | 2.0 | 6.5 | 10.4 | |
| Fe II | 238.204 | 90 | 270 | 110 | 826 | 3.0 | 1.2 | 3.1 | 7.5 | 9.2 | |
| Mn II | 257.611 | 250 | 980 | 310 | 2200 | 3.9 | 1.2 | 2.2 | 7.1 | 8.8 | |
| Mo II | 202.095 | 30 | 110 | 40 | 300 | 3.7 | 1.3 | 2.7 | 7.5 | 10.0 | |
| Ni II | 231.604 | 40 | 120 | 70 | 460 | 3.0 | 1.8 | 3.8 | 6.6 | 11.5 | |
| Pb II | 220.353 | 8 | 33.9 | 13 | 100 | 4.2 | 1.6 | 2.9 | 7.7 | 12.5 | |
| V II | 292.464 | 30 | 170 | 50 | 350 | 5.7 | 1.7 | 2.1 | 7.0 | 11.7 | |
| W II | 207.911 | 17 | 40 | 30 | 150 | 2.4 | 1.8 | 3.8 | 5.0 | 8.8 | |
| Zn II | 206.200 | 80 | 115 | 160 | 1100 | 1.4 | 2.0 | 9.6 | 6.9 | 13.8 | |
For the sake of brevity, Table 4 contains only the emission lines that were used for the analyses, which were selected based on their freedom from spectroscopic interference. In general, the improvement was greater for ionic than atomic lines, the largest improvements being observed for emission lines with higher total excitation potential (TEP), i.e. excitation potential for atomic lines or sum of ionization and excitation potentials for ionic lines.53,54 For example, Table 4 shows essentially no improvement for BaII 455.400 nm and BeI 234.861 nm with TEPs of 7.9 and 5.3 eV, respectively, upon switching from USN to USN-MSIS-PET, whereas 2- and 4-fold improvements were obtained for BaII 233.527 nm and BeII 313.042 nm (not shown) with TEPs of 11.2 and 13.3 eV, respectively. Similarly, a 10-fold increase resulted under the same conditions for ZnII 206.200 nm (TEP of 15.5 eV), in contrast to a 1.5-fold increase for ZnI 213.856 nm (TEP of 5.8 eV) (not shown). Such difference was observed independently of vapor formation. For example, there was a 7-fold improvement for GeII 164.919 nm (TEP of 16.0 eV) versus only a 2-fold one using GeI 265.118 nm (TEP of 4.9 eV) (not shown). Given that the intensities of emission lines with TEP ≥ 13 are depressed to a greater extent with USN than with PN in the presence of matrix elements such as Ca,30i.e. they are more susceptible to changes in plasma excitation conditions, whereas such conditions are improved by MSIS-PET, this likely explains why sensitivities for ionic lines were improved more than those for atomic lines when switching from USN to USN-MSIS-PET.
Table 5 shows that the instrumental detection limits, based on three times the standard deviation of the signal from a reagent blank, for vapour/hydride-forming elements (As, Bi, Ge, Hg, Sb and Sn) using PN-MSIS-PET, which are similar to those with USN-MSIS-PET, are significantly lower than those obtained with either PN or USN, the average improvement factor being 44 ± 16 and 7 ± 6, respectively. For the other elements, there is no significant improvement in detection limit with PN-MSIS-PET compared to PN, whereas using USN-MSIS-PET improved them by, on average, 6.4 ± 4.4. In both cases, the improvement in detection limit is slightly less than in sensitivity. Indeed, because 98–99% purity reagents (NaBH4, NaOH, L-cysteine) were used without purification, the background increase commensurate with using a more efficient sample introduction system likely translated into a higher noise level, hence precluding as large an improvement in detection limit as in sensitivity. In any case, it should be noted that, although Hg is lost in the desolvation system of USN, it can nonetheless be detected with USN-MSIS-PET because the portion of sample that was introduced directly into the MSIS was transformed into stable cold vapour,5,6 resulting in a significant improvement in sensitivity and detection limit with USN-MSIS-PET compared to PN.
| Analyte line/nm | (A) | (B) | (C) | (D) | Factor | |||||
|---|---|---|---|---|---|---|---|---|---|---|
| PN | USN | PN-MSIS-PET | USN-MSIS-PET | A/B | A/C | B/C | B/D | C/D | A/D | |
| a Hg is lost in the USN desolvation system. | ||||||||||
| As 189.042 | 5 | 3 | 0.2 | 0.2 | 1.7 | 25 | 15 | 15 | 1.0 | 25 |
| Bi 223.061 | 20 | 1 | 0.5 | 0.3 | 20 | 40 | 2.0 | 3.3 | 1.7 | 67 |
| Ge 164.919 | 10 | 0.5 | 0.2 | 0.2 | 20 | 50 | 2.5 | 2.5 | 1.0 | 50 |
| Hg 184.95 | 5 | 0.1 | 0.1 | a | 50 | a | a | a | 50 | |
| Sb 206.833 | 10 | 0.8 | 0.5 | 0.4 | 13 | 20 | 1.6 | 2.0 | 1.3 | 25 |
| Sn 189.991 | 4 | 1 | 0.09 | 0.08 | 4.0 | 44 | 11 | 13 | 1.1 | 50 |
| Ba 455.400 | 0.3 | 0.04 | 0.2 | 0.02 | 7.5 | 1.5 | 2.0 | 10 | 15 | |
| Be 234.861 | 0.2 | 0.01 | 0.2 | 0.02 | 20 | 1.0 | 0.5 | 10 | 10 | |
| Cd 214.438 | 0.8 | 0.2 | 0.5 | 0.06 | 4.0 | 1.6 | 3.3 | 8.3 | 13 | |
| Co 228.616 | 1 | 0.4 | 0.7 | 0.3 | 2.5 | 1.4 | 1.3 | 2.3 | 3.3 | |
| Cr 267.716 | 2 | 0.4 | 2 | 0.2 | 5.0 | 1.0 | 2.0 | 10 | 10 | |
| Cu 224.700 | 4 | 0.4 | 3 | 0.4 | 10 | 1.3 | 1.0 | 7.5 | 10 | |
| Fe 238.204 | 1 | 0.2 | 8 | 1 | 5.0 | 0.1 | 0.2 | 8.0 | 1.0 | |
| Mn 257.611 | 0.2 | 0.06 | 0.3 | 0.05 | 3.3 | 0.7 | 1.2 | 5.8 | 3.9 | |
| Mo 202.095 | 2 | 0.5 | 2 | 0.5 | 4.0 | 1.0 | 1.0 | 4.0 | 4.0 | |
| Ni 231.604 | 2 | 0.4 | 3 | 0.5 | 5.0 | 0.7 | 0.8 | 6.0 | 4.0 | |
| Pb 220.353 | 10 | 3 | 8 | 2 | 3.3 | 1.3 | 1.5 | 4.0 | 5.0 | |
| V 292.464 | 2 | 0.6 | 1 | 0.6 | 3.3 | 2.0 | 1.0 | 1.7 | 3.3 | |
| W 207.911 | 4 | 1 | 3 | 0.9 | 4.0 | 1.3 | 1.1 | 3.3 | 4.4 | |
| Zn 206.200 | 1 | 2 | 0.6 | 0.5 | 0.5 | 1.7 | 4.0 | 1.2 | 2.0 | |
Detection limits by ICP-OES with PN-MSIS-PET and USN-MSIS-PET are compared to those obtained using various dual-mode sample introduction systems in Table 6. Despite the fact that the axial view provides lower detection limits for most elements while the radial view is more robust,53 detection limits obtained in this work with the radial view are comparable to or better than previous reports, including those with the axial view. The improvement is especially impressive for vapour/hydride-forming elements. The approach is also advantageous for the determination of Hg, which would be lost in the heater/condenser of the conventional USN system,36 and would lead to low sensitivity and a notorious memory effect by conventional PN,55,56 as it leads to a 50-fold improvement in detection limit compared to PN (Table 5). However, because of the longer path that the aerosol has to follow compared to a simple PN system, the washout time for other elements was increased slightly. For instance, following the aspiration of a 100 ng mL−1 multielement solution, the washout time, i.e. from the start of signal decay to baseline, was 43 s for Hg and 35 s for the other elements. The fact that the washout is similar for the other elements suggests that decomposition of thermally unstable hydrides, if it occurred, did not result in significant carry-over effects.
| Analyte line/nm | This work radial PN-MSIS-PET, USN-MSIS-PET | Ref. 61, radiala | Ref. 19, radialb | Ref. 23, axial MSISc | Ref. 15, axial MSISd | Ref. 20, radial CMAe | Ref. 27, radial USN | Ref. 30, axial USN |
|---|---|---|---|---|---|---|---|---|
| Dual mode | ||||||||
| a Nebulizers with 45° configuration. b Nebulizers with parallel configuration. c Values in parentheses are for hydride-generation mode only. d Values in parentheses are for hydride-generation mode only. e Values in parentheses are for hydride-generation mode only; emission lines for non-HG elements are not given. f As 228.8 nm. g Sb 231.1 nm. h Sn 284.0 nm. | ||||||||
| As 189.042 | 0.2, 0.2 | 3 | 0.7 (0.5) | 0.2 (0.2) | 2 | |||
| As 193.759 | 2, 4 | 2 | 0.3 (0.2) | 4 (4)f | 9 | 2 | ||
| Bi 190.241 | 0.2, 0.2 | 0.3 (0.5) | 0.6 (0.6) | |||||
| Bi 223.061 | 0.5, 0.3 | 0.5 (0.8) | 0.6 (0.4) | 3 (1) | ||||
| Ge164.919 | 0.2, 0.2 | 0.2 (0.3) | ||||||
| Ge 265.118 | 1, 1 | 1.2 (0.8) | ||||||
| Hg 184.95 | 0.1, 0.1 | 0.1 | ||||||
| Sb 206.833 | 0.5, 0.4 | 20 | 0.8 (0.5) | 0.2 (0.3) | 2 (2)g | 0.6 | ||
| Sb 217.581 | 0.2, 0.2 | 4 | 0.6 (1.0) | 0.3 (0.2) | 0.9 | |||
| Sn 189.991 | 0.09, 0.08 | 0.1 (0.1) | 0.2 (0.1) | |||||
| Sn 242.949 | 0.7, 1 | 0.1 (1.5) | 2 (2)h | |||||
| Ba 233.527 | 0.6, 0.06 | 0.9 | 0.4 | |||||
| Ba 455.400 | 0.2, 0.02 | 40 | 0.6 | 0.6 | ||||
| Be 234.861 | 0.2, 0.02 | 0.4 | 0.002 | |||||
| Be 313.042 | 0.1, 0.04 | 0.01 | ||||||
| Cd 226.502 | 0.3, 0.07 | 1 | 2 | 0.1 | ||||
| Co 228.616 | 0.7, 0.3 | 0.9 | 0.7 | 0.07 | ||||
| Co 238.892 | 1, 0.5 | 4 | 0.6 | 2 | 0.06 | |||
| Cr 205.618 | 1, 0.05 | 6 | 2 | 0.1 | ||||
| Cr 267.716 | 2, 0.2 | 3 | 0.5 | 0.02 | ||||
| Cu 224.700 | 3, 0.4 | 0.1 | ||||||
| Cu 324.754 | 1, 0.4 | 3 | 70 | 1 | 0.4 | 0.1 | ||
| Fe 238.204 | 8, 1 | 4 | 0.2 | |||||
| Fe 259.941 | 9, 3 | |||||||
| Mn 257.611 | 0.3, 0.06 | 0.7 | 3 | 0.3 | 0.05 | 0.6 | 0.1 | 0.01 |
| Mn 259.373 | 0.3, 0.1 | 0.2 | 0.06 | |||||
| Mo 202.095 | 2, 0.5 | 10 | 2 | 0.06 | ||||
| Mo 281.615 | 3, 1 | 2 | ||||||
| Ni 221.648 | 3, 1 | 2 | 1.3 | 1.4 | 0.1 | |||
| Ni 231.604 | 3, 0.5 | 8 | 1 | 0.6 | 5 | 0.02 | ||
| Pb 220.353 | 8, 2 | 20 | 1.4 | 5.5 | 0.6 | |||
| Pb 217.000 | 10, 3 | 21 | 0.4 | |||||
| V 292.464 | 1, 0.6 | 4 | 3 | 2 | 0.02 | |||
| V 311.071 | 2, 2 | 1 | ||||||
| W 207.911 | 3, 0.9 | 7 | ||||||
| W 239.709 | 10, 10 | 8 | ||||||
| Zn 206.200 | 0.6, 0.5 | 0.4 | ||||||
| Zn 213.856 | 1, 1 | 2 | 2 | 0.5 | 0.1 | |||
The instrumental precision, expressed as relative standard deviation (RSD, n = 5), with PN/USN-MSIS-PET is given in Table 7 for each element. The average precision for all elements was 2.4 ± 1.5% and 2.7 ± 2.0% using PN-MSIS-PET and USN-MSIS-PET respectively, which is comparable to what has been reported in the literature for the simultaneous determination of hydride-forming and other elements by ICP-OES.57 This similarity combined with the fact that no drift was observed for elements forming thermally unstable hydrides further suggest that decomposition, if it occurred, did not have a significant detrimental effect.
| Analyte line/nm | PN-MSIS-PET | USN-MSIS-PET |
|---|---|---|
| As 189.042 | 4.1 | 1.6 |
| Bi 223.061 | 1.4 | 5.0 |
| Ge164.919 | 2.9 | 6.5 |
| Hg 184.950 | 1.3 | 1.9 |
| Sb 206.833 | 4.1 | 6.6 |
| Sn 189.991 | 7.0 | 4.6 |
| Ba 455.400 | 1.4 | 0.8 |
| Be 234.861 | 1.5 | 0.7 |
| Cd 214.438 | 1.4 | 1.4 |
| Co 228.616 | 2.3 | 1.3 |
| Cr 267.716 | 2.0 | 1.1 |
| Cu 224.700 | 1.9 | 5.6 |
| Fe 238.204 | 1.6 | 1.4 |
| Mn 257.611 | 1.4 | 2.8 |
| Mo 202.095 | 1.6 | 1.9 |
| Ni 231.604 | 1.1 | 0.7 |
| Pb 220.353 | 3.7 | 3.5 |
| V 292.464 | 2.8 | 1.1 |
| W 207.911 | 4.0 | 2.3 |
| Zn 206.200 | 1.4 | 3.9 |
Plasma robustness
Using PN/USN-MSIS-PET not only improves sensitivity and detection limits compared to those achieved with conventional PN or USN but also plasma robustness, as shown in Fig. 4. The improvement is particularly important compared to the conventional USN system (which includes a desolvator), which further demonstrates that preserving water is important because water affects the excitation and ionization characteristics of the plasma37 and acts as a load buffer, which minimizes matrix effects.41 With MSIS-PET in combination with either PN or USN, a MgII/MgI emission ratio of at least 10 is readily achieved, indicating plasma excitation conditions close to LTE values,43,58 and a robust plasma. In fact, plasma robustness with MSIS-PET is higher than previously achieved by replacing the entire desolvation system of an USN with a PET,36 where the MgII/MgI ratio was 10.5. This indicates that the hydrogen by-product of hydride generation exerts a significant beneficial effect, as previously reported by others.18,20,23 Thus, the improvement in plasma robustness obtained with PN/USN-MSIS-PET stems from the addition of hydrogen by-product from using the MSIS in dual mode and the preservation of water along with its pre-evaporation by the PET.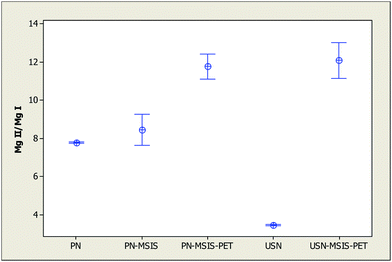 | ||
| Fig. 4 Average Mg 280.270 nm to Mg 285.213 nm line intensity ratio (MgII/MgI) (with 95% confidence limits, n = 5) for different sample introduction systems, using operating conditions in Table 1. | ||
In addition to the above robustness, no significant buildup of condensed products was observed either inside the pre-evaporation tube or inside the MSIS. Because both the pre-evaporation tube and the bottom of the torch were wrapped with heating tape, condensation was prevented in these regions. Only after over two days of continuous operation was a slight accumulation of condensed matter noticed inside the torch, which required dismantling and cleaning of the torch.
Analysis of certified reference materials
Plasma robustness was further verified through the analysis of soils and biological reference materials by PN/USN-MSIS-PET-ICP-OES under robust conditions using a simple external calibration (without matrix matching) and internal standardization with an Ar emission line (Ar I 763.511 nm). Soil samples were prepared by either aqua-regia reflux or hot plate digestion. Recoveries of all elements, except Ba and Hg, were satisfactory after hot plate digestion. For Hg, an aqua-regia reflux was used instead. The results summarized in Table 8 demonstrate that the sole use of an Ar emission line as an internal standard enabled accurate determination of all elements, except Ba in SRM 2710 and 2711 with PN/USN-MSIS-PET, Pb in SRM 2711 using USN-MSIS-PET and Cd in SRM 2710 using PN-MSIS-PET. As no clean room was used, contamination could have occurred in the latter two cases, whereas incomplete digestion of the soils was likely the culprit for Ba. Note that Student's t-tests were only performed for elements for which certified values were available. Internal standardization with an Ar emission line is advantageous, as it eliminates the problems associated with the physical addition of internal standards to solutions, such as possible contamination and the requirement that internal standards not be present in the sample.| Montana soilbSRM 2711 | Montana soilbSRM 2710 | Fish Protein DORM-3 | ||||||
|---|---|---|---|---|---|---|---|---|
| PN-MSIS-PET | USN-MSIS-PET | Certified | PN-MSIS-PET | USN-MSIS-PET | Certified | USN-MSIS-PET | Certified | |
| a All results are in μg g−1, except Fe in SRM 2711/2710 and Mn in SRM 2710 which are in % m/m; results in bold are in agreement with the certified values according to Student's t-test at the 95% confidence level; ND = not detected; values given in parentheses are not certified. b Hot plate digestion except for Hg where aqua regia reflux was used. c From ref. 62. | ||||||||
| As | 115.7 ± 4.6 | 107.3 ± 7.3 | 105 ± 8 | 633 ± 13 | 597 ± 127 | 626 ± 38 | 6.59 ± 0.64 | 6.88 ± 0.3 |
| Ba | 600 ± 3 | 640 ± 20 | 726 ± 38 | 593 ± 11 | 660 ± 24 | 707 ± 51 | 4.38 ± 0.29 | |
| Be | ND | 1.91 ± 0.39 | (2.0)c | ND | 2.05 ± 0.14 | (2.0)c | ND | |
| Cd | 42.06 ± 0.08 | 41.9 ± 8.2 | 41.70 ± 0.25 | 22.70 ± 0.17 | 21.0 ± 1.2 | 21.8 ± 0.2 | 0.29 ± 0.03 | 0.290 ± 0.020 |
| Co | 9.93 ± 0.31 | 12.4 ± 2.4 | (10.0) | 10.00 ± 0.24 | 12.35 ± 0.59 | (10.0) | 0.36 ± 0.08 | |
| Cr | 43.11 ± 0.11 | 41.6 ± 8.3 | (47.0) | 35.86 ± 0.40 | 34.1 ± 1.3 | (39.0) | 1.79 ± 0.26 | 1.89 ± 0.17 |
| Cu | 116 ± 1 | 117 ± 3 | 114 ± 2 | 3060 ± 10 | 3030 ± 75 | 2950 ± 130 | 13.6 ± 2.8 | 15.5 ± 0.63 |
| Fe | 2.98 ± 0.05 | 2.94 ± 0.49 | 2.89 ± 0.06 | 3.31 ± 0.03 | 3.31 ± 0.28 | 3.38 ± 0.1 | 270 ± 20 | 347 ± 20 |
| Hg | 6.9 ± 1.1 | 6.7 ± 2.4 | 6.25 ± 0.19 | 32.1 ± 5.3 | 31.9 ± 1.0 | 32.6 ± 1.8 | 0.36 ± 0.04 | 0.382 ± 0.060 |
| Mn | 648.4 ± 6.6 | 680 ± 120 | 638 ± 28 | 1.07 ± 0.01 | 1.02 ± 0.09 | 1.01 ± 0.04 | 3.5 ± 1.0 | (4.6) |
| Mo | 1.39 ± 0.10 | 2.4 ± 0.6 | (1.6) | 20.35 ± 0.80 | 21.0 ± 1.2 | (19.0) | 0.28 ± 0.05 | |
| Ni | 22.33 ± 0.01 | 22.5 ± 1.0 | 20.6 ± 1.1 | 14.27 ± 0.26 | 13.8 ± 1.9 | 14.3 ± 1.0 | 1.30 ± 0.34 | 1.28 ± 0.21 |
| Pb | 1230 ± 4 | 1295 ± 19 | 1162 ± 31 | 5380 ± 70 | 5550 ± 150 | 5532 ± 80 | 0.40 ± 0.12 | 0.395 ± 0.050 |
| Sb | 19.1 ± 3.7 | 18.9 ± 1.2 | 19.4 ± 1.8 | 40.4 ± 4.2 | 42.7 ± 2.5 | 38.4 ± 3 | ND | |
| V | 80.0 ± 1.2 | 92.8 ± 5.3 | 81.6 ± 2.9 | 77.48 ± 0.80 | 80.6 ± 4.1 | 76.6 ± 2.3 | 1.62 ± 0.02 | |
| Zn | 352.8 ± 1.8 | 356 ± 72 | 350.4 ± 4.8 | 6940 ± 130 | 6890 ± 320 | 6952 ± 91 | 51.5 ± 8.0 | 51.3 ± 3.1 |
Although using an Ar emission line as an internal standard is convenient, it might only be expected to compensate for small changes taking place in the plasma, unlike an internal standard added to the solutions, which may also correct for changes in aerosol formation and/or transport into the plasma. However, the agreement of the results with certified values by external calibration, without matrix-matching, and using only an Ar emission line as internal standard further suggests that matrix effects during aerosol transport were either minimized by pre-evaporation of the aerosol, which unavoidably resulted in a finer tertiary aerosol, and/or made similar by adjusting all samples and standards to 1 M HNO3 and 1% m/m L-cysteine. The fact remains that analysis of the same materials (SRM 2710 and SRM 2711) using PN and especially USN-HC-MD (without MSIS-PET) on the same ICPOES instrument gave results that were biased low, whereas the results obtained using USN-PET with internal standardization using an Ar emission line were generally in agreement with certified values.36 Nonetheless, efficient compensation is clearly possible using a single internal standard under robust conditions, unlike with nonrobust conditions, which have been reported to complicate internal standardization.59
Internal standardisation with an Ar emission line was also successfully done previously.36,60 For example, with USN-PET sample introduction, an Ar emission line compensated the matrix effect caused by matrix elements (0.1% Ca), which would have otherwise induced a significant signal suppression, and enabled the determination of trace elements in soil digests using USN-PET with a simple external calibration, without matrix matching.36 Similarly, Hoenig et al.60 successfully used an Ar emission line as internal standard for the determination of most trace elements in environmental samples with a conventional USN, poor recovery only being observed for volatile elements (such as As and Se), which were likely partially lost in the desolvation system of the USN.
Conclusions
Inserting a PET between the sample introduction system and the torch is a simple way of improving sensitivity, plasma robustness and detection limits in ICP-OES. It is particularly recommended in combination with USN, as the latter substantially increases sample introduction efficiency.36 The addition of MSIS-PET to a conventional PN or USN further improved plasma robustness, which enabled the simultaneous determination of vapour/hydride forming elements in environmental samples with a simple external calibration and using an argon emission line for internal standardization. The improvement in analytical performance can be attributed to both the addition of hydrogen as MSIS CVG by-product and pre-evaporation of the aerosol. The applicability of this sample introduction system to ICP-MS will be studied to see if it will offer similar advantages. Because of the much greater sensitivity of ICP-MS compared to ICP-OES, which makes its detection limit more blank-limited, cleaner reagents will likely be required along with a cleaner environment (no clean room was used in this work).Acknowledgements
The authors gratefully acknowledge Anglo American Plt for the donation of the SPECTRO ARCOS ICP-OES instrument and for sponsoring the postdoctoral fellowship to A.A. The authors also acknowledge research funding from the National Science and Engineering Research Council of Canada.References
- J. D. Winefordner, I. B. Gornushkin, T. Correll, E. Gibb, B. W. Smith and N. Omenetto, J. Anal. At. Spectrom., 2004, 19, 1061–1083 RSC.
- J. Mora, S. Maestre, V. Hernandis and J. L. Todoli, TrAC, Trends Anal. Chem., 2003, 22, 123–132 CrossRef CAS.
- D. Beauchemin, Anal. Chem., 2008, 80, 4455–4486 CrossRef CAS.
- I. D. Brindle, Anal. Bioanal. Chem., 2007, 388, 735–741 CrossRef CAS.
- P. Pohl, TrAC, Trends Anal. Chem., 2004, 23, 87–101 CrossRef CAS.
- R. E. Sturgeon and Z. Mester, Appl. Spectrosc., 2002, 56, 202A–213A CrossRef CAS.
- P. Pohl, TrAC, Trends Anal. Chem., 2004, 23, 21–27 CrossRef CAS.
- P. Pohl and B. Prusisz, Anal. Bioanal. Chem., 2007, 388, 753–762 CrossRef CAS.
- T. Matousek, Anal. Bioanal. Chem., 2007, 388, 763–767 CrossRef.
- Y.-L. Feng, R. E. Sturgeon, J. W. Lam and A. D'Ulivo, J. Anal. At. Spectrom., 2005, 20, 255–265 RSC.
- M. Grotti, C. Lagomarsino and R. Frache, J. Anal. At. Spectrom., 2005, 20, 1365–1373 RSC.
- G. Centineo, M. M. Bayon and A. Sanz-Medel, J. Anal. At. Spectrom., 2000, 15, 1357–1362 RSC.
- A. Asfaw and G. Wibetoe, J. Anal. At. Spectrom., 2007, 22, 158–163 RSC.
- B. Huang, Z. Zhang and X. Zeng, Spectrochim. Acta, Part B, 1987, 42, 129–137 CrossRef.
- R. L. J. McLaughlin and I. D. Brindle, J. Anal. At. Spectrom., 2002, 17, 1540–1548 RSC.
- P. Pohl and W. Zyrnicki, Chem. Anal., 2000, 45, 699–708 CAS.
- I. Rojas, M. Murillo, N. Carrion and J. Chirinos, Anal. Bioanal. Chem., 2003, 376, 110–117 CAS.
- K. A. Wolnik, F. L. Fricke, M. H. Hahn and J. A. Caruso, Anal. Chem., 1981, 53, 1030–1035 CrossRef CAS.
- L. R. Gomez, G. D. Marquez and J. R. Chirinos, Anal. Bioanal. Chem., 2006, 386, 188–195 CrossRef CAS.
- P. Pohl and J. A. C. Broekaert, Anal. Bioanal. Chem., 2010, 398, 537–545 CrossRef CAS.
- M. Mulugeta, G. Wibetoe, C. J. Engelsen and A. Asfaw, Anal. Bioanal. Chem., 2009, 393, 1015–1024 CrossRef CAS.
- H. Matusiewicz and M. Slachcinski, Microchem. J., 2007, 86, 102–111 CrossRef CAS.
- H. Wiltsche, I. B. Brenner, K. Prattes and G. Knapp, J. Anal. At. Spectrom., 2008, 23, 1253–1262 RSC.
- A. Asfaw and G. Wibetoe, J. Anal. At. Spectrom., 2006, 21, 1027–1035 RSC.
- A. Asfaw and G. Wibetoe, Anal. Bioanal. Chem., 2005, 382, 173–179 CrossRef CAS.
- R. I. Botto and J. J. Zhu, J. Anal. At. Spectrom., 1994, 9, 905–912 RSC.
- J. Borkowska-Burnecka, A. Lesniewicz and W. Zyrnicki, Spectrochim. Acta, Part B, 2006, 61, 579–587 CrossRef.
- K. V. Desboeufs, R. Losno and J. L. Colin, Anal. Bioanal. Chem., 2003, 375, 567–573 CAS.
- J. L. Todoli, L. Gras, V. Hernandis and J. Mora, J. Anal. At. Spectrom., 2002, 17, 142–169 RSC.
- I. B. Brenner, M. Zischka, B. Maichin and G. Knapp, J. Anal. At. Spectrom., 1998, 13, 1257–1264 RSC.
- Y. C. Sun, S. H. Wu and C. C. Lee, J. Anal. At. Spectrom., 2003, 18, 1163–1170 RSC.
- M. Grotti, C. Lagomarsino and J. M. Mermet, J. Anal. At. Spectrom., 2006, 21, 963–969 RSC.
- G. R. Peters and D. Beauchemin, Anal. Chem., 1993, 65, 97–103 CrossRef CAS.
- S. L. Liu and D. Beauchemin, Spectrochim. Acta, Part B, 2006, 61, 965–970 CrossRef.
- S. L. Liu and D. Beauchemin, Spectrochim. Acta, Part B, 2006, 61, 965–970 CrossRef.
- A. Asfaw and D. Beauchemin, Spectrochim. Acta, Part B, 2010, 65, 376–384 CrossRef.
- S. E. Long and R. F. Browner, Spectrochim. Acta, Part B, 1988, 43, 1461–1471 CrossRef.
- E. Paredes, M. Grotti, J. M. Mermet and J. L. Todoli, J. Anal. At. Spectrom., 2009, 24, 903–910 RSC.
- M. Welna and W. Zyrnicki, J. Anal. At. Spectrom., 2009, 24, 832–836 RSC.
- P. E. Walters and C. A. Barnardt, Spectrochim. Acta, Part B, 1988, 43, 325–337 CrossRef.
- I. Novotny, J. C. Farinas, J. L. Wan, E. Poussel and J. M. Mermet, Spectrochim. Acta, Part B, 1996, 51, 1517–1526 CrossRef.
- M. Murillo and J. M. Mermet, Spectrochim. Acta, Part B, 1989, 44, 359–366 CrossRef.
- J. M. Mermet, Anal. Chim. Acta, 1991, 250, 85–94 CrossRef CAS.
- J. N. Miller and J. C. Miller, Statistics and Chemometrics for Analytical Chemistry, Pearson Education Ltd, Gosport, 5th edn, 2005 Search PubMed.
- M. A. Bezerra, R. E. Santelli, E. P. Oliveira, L. S. Villar and L. A. Escaleira, Talanta, 2008, 76, 965–977 CrossRef CAS.
- M. W. Blades and G. Horlick, Spectrochim. Acta, Part B, 1981, 36, 861–880 CrossRef.
- M. W. Blades and G. Horlick, Spectrochim. Acta, Part B, 1981, 36, 881–900 CrossRef.
- M. Murillo, R. Amaro and A. Fernandez, Talanta, 2003, 60, 1171–1176 CrossRef CAS.
- I. I. Stewart and J. W. Olesik, J. Anal. At. Spectrom., 1998, 13, 1249–1256 RSC.
- A. Fernandez, M. Murillo, N. Carrion and J. M. Mermet, J. Anal. At. Spectrom., 1994, 9, 217–221 RSC.
- A. Risnes and W. Lund, J. Anal. At. Spectrom., 1996, 11, 943–948 RSC.
- A. R. Kumar and P. Riyazuddin, TrAC, Trends Anal. Chem., 2010, 29, 166–176 CrossRef CAS.
- I. B. Brenner and A. T. Zander, Spectrochim. Acta, Part B, 2000, 55, 1195–1240 CrossRef.
- Y. Ralchenko, A. E. Kramida and J. Reader, NIST Atomic Spectra Database (version 3.1.5), National Institute of Standards and Technology, Gaithersburg, MD, http://www.nist.gov/physlab/data/asd.cfm, 2010, August 20 Search PubMed.
- C. F. Harrington, S. A. Merson and T. M. D. D'Silva, Anal. Chim. Acta, 2004, 505, 247–254 CrossRef CAS.
- T. Hirata, J. Anal. At. Spectrom., 2000, 15, 1447–1450 RSC.
- P. Pohl and R. E. Sturgeon, TrAC, Trends Anal. Chem., 2010, 29, 1376–1389 CrossRef CAS.
- J. M. Mermet, Spectrochim. Acta, Part B, 1989, 44, 1109–1116 CrossRef.
- X. Romero, E. Poussel and J. M. Mermet, Spectrochim. Acta, Part B, 1997, 52, 487–493 CrossRef.
- M. Hoenig, H. Docekalova and H. Baeten, J. Anal. At. Spectrom., 1998, 13, 195–199 RSC.
- Z. Benzo, D. Maldonado, J. Chirinos, E. Marcano, C. Gomez, M. Quintal and J. Salas, Microchem. J., 2009, 93, 127–132 CrossRef CAS.
- S. A. Wilson, P. H. Briggs, J. S. Mee and D. F. Siems, Geostand. Geoanal. Res., 1994, 18, 85–89 CrossRef CAS.
| This journal is © The Royal Society of Chemistry 2012 |