The use of controlled surface topography and flow-induced shear stress to influence renal epithelial cell function
Else M.
Frohlich
ab,
Xin
Zhang
b and
Joseph L.
Charest
*a
aDraper Laboratory, 555 Technology Square, Cambridge, MA 02139, USA
bDepartment of Mechanical Engineering, Boston University, 110 Cummington St., Boston, MA 02215, USA
First published on 5th December 2011
Abstract
Physiologically-representative and well-controlled in vitro models of human tissue provide a means to safely, accurately, and rapidly develop therapies for disease. Current in vitro models do not possess appropriate levels of cell function, resulting in an inaccurate representation of in vivo physiology. Mechanical parameters, such as sub-micron topography and flow-induced shear stress (FSS), influence cell functions such as alignment, migration, differentiation and phenotypic expression. Combining, and independently controlling, biomaterial surface topography and FSS in a cell culture device would provide a means to control cell function resulting in more physiologically-representative in vitro models of human tissue. Here we develop the Microscale Tissue Modeling Device (MTMD) which couples a topographically-patterned substrate with a microfluidic chamber to control both topographic and FSS cues to cells. Cells from the human renal proximal tubule cell line HK-2 were cultured in the MTMD and exposed to topographic patterns and several levels of FSS simultaneously. Results show that the biomaterial property of surface topography and FSS work in concert to elicit cell alignment and influence tight junction (TJ) formation, with topography enhancing cell response to FSS. By administering independently-controlled mechanical parameters to cell populations, the MTMD creates a more realistic in vitro model of human renal tissue.
Insight, innovation, integrationRenal proximal tubule epithelial cells are exposed to cues from both a basement membrane and luminal flow-induced shear stress (FSS) in vivo. In this work, we precisely controlled similar, physiologically-inspired cues of surface topography and FSS, to study the influence of these cues on structure and function of renal tissue in vitro. We combined microfabricated topographic features with microfluidics in a microscale tissue modeling device (MTMD) to provide well-controlled stimuli to renal proximal tubule cells. We discovered topography and FSS to be working in concert to elicit cell alignment and influence tight junction formation. These results highlight the potential of using multiple, user-defined stimuli to drive proximal tubule cells towards formation of physiological tissue structures in vitro. |
1. Introduction
To provide platforms for disease study and therapeutic development, in vitro tissue models seek to precisely control the microenvironment of cells. Microenvironments that support physiologically-relevant tissue formation require a multitude of signals, including matrix proteins, soluble or immobilized growth factors, cytokines, cell-to-cell interactions and physical parameters.3 Physical parameters such as biomaterial substrate topography and flow-induced shear stress (FSS) directly affect cell response and tissue structure formation. The topographic cues present in the extracellular matrix (ECM) in vivo play a significant role in cell survival, migration, organization, and function.4 The basement membrane (BM) is an integral part of the ECM; it contacts all epithelial and endothelial monolayers5 and is a supporting meshwork of specialized proteins that can be involved in structural, filtering and signaling roles. Present within the BM are sub-micron topographical structures in the form of fibers and pores.4,6–9 The BM of the kidney tubule is comprised of proteins such as laminin, fibronectin, osteonectin, fibulin, agrin, and mainly type IV collagen.6,10–12 Replicating elements of the tubule protein composition and topographical structures would provide native cues for in vitro kidney tissue culture. Additionally, kidney epithelial cellsin vivo are subjected to varying FSS due to renal filtrate flow along the kidney tubule, which plays an important role in tight junction (TJ) formation, ion regulation, water balance and waste removal.13–17 Incorporation of FSS in an in vitro model of kidney tissue would provide a means to regulate and potentially enhance these critical kidney-specific functions. The deliberate combination and control of topography and FSS result in a tubule-like mechanical environment to encourage formation of tissue in vitro with native in vivo kidney physiology.Topographic patterns influence morphological and functional cell response,1,18 but their likely impact on kidney cell function has yet to be thoroughly explored. Well-defined topographic patterns influence cell response, most notably through contact guidance, and result in controlled, directed cell migration, alignment, elongation, and structural reorganization.19,20Cell response to topography depends on many factors, including cell type, feature size and feature geometry.2,9 Three basic nanotopographic geometries, gratings, consisting of ridges and grooves, posts, and pits have effects on cell morphology, migration, attachment, adhesion, and proliferation.21 In addition, cell-topography interactions have the ability to control higher order cell function, such as stem cell differentiation and cellular superstructure formation.18,22,23 In general, epithelial cells show increased alignment and elongation along topographic features.24Cells from a highly modified human embryonic kidney cell line (HEK-293) demonstrate enhanced adhesion, proliferation and alignment to substrate topography,25 though the impact of topography on more physiologically-relevant kidney cells is not well documented. As the basement membrane of the kidney tubule contains micro- and nano-scale topographic structures,26–29 and line-grating sub-micron topography in vitro mediates cellular organization,30 topographic patterns provide a promising, yet unexplored, avenue to influence kidney epithelial cell function in vitro.
Flow-induced shear stress (FSS) significantly influences cell monolayers, particularly renal epithelial and vascular endothelial cell monolayers, since they receive FSS stimulus in their native environment. FSS induced by vascular flow modifies ion channel properties and growth factor synthesis in endothelial cells,31–33 while FSS influences proliferation and differentiation in mesenchymal stem cells34 and human osteoblasts.35 In the kidney, epithelial cells line the tubular lumen and receive stimulus from FSS caused by renal filtrate flow passing through the nephron to the collecting ducts. Since nephron size and flow vary across tubule sections14,36 a wide range of shear stress is exerted on tubule epithelial cells, with one estimate predicting tubule shear stress between 0.2–20 dynes cm−2.15,37 In the proximal tubule, accurate levels of FSS are not known because tubular reabsorption causes the filtrate flow to be continuously modified along the tubule. In addition, changes in the proximal tubular flow rate and tubule diameter38 make the exact value of in vivotubule FSS hard to define. Presumably, the FSS induced by the renal filtrate flow has an effect on the proximal tubule cell structure and function. Indeed, in vitro kidney cell studies show that FSS induces reorganization of the cytoskeleton39 by reinforcing the apical and lateral domains of actin filaments,40 spurs the formation of TJs and adherens junctions, and dramatically reinforces expression of vinculin.39In vitro kidney tissue model systems that incorporate FSS will encourage highly functional responses from kidney epithelial cells leading to a physiologically-accurate representation of native tissue.
Current in vitro systems influence kidney cell function through delivery of FSS. Systems controlling FSS stimulation of cellsin vitro typically have one of two configurations: (1) a commercially-available, parallel-plate flow chamber which typically uses a non-patterned substrate or, (2) a microfluidic device with a porous or electrospun membrane for cell attachment which allows solute transport. In a parallel-plate flow chamber, pulsatile shear stress in the range of 3.3–30 dynes cm−2 modulates nitric oxide production in the inner medullary collecting duct cells,37 while flow rates of approximately 1 μL s−1 in a 3 mm wide, 3 mm deep flow chamber increase intracellular concentration of Ca2+ in cortical collecting duct cells.41 Alternatively, cells cultured on a porous membrane in a microfluidic device and exposed to 1 dyne cm−2 over 5 hours demonstrated enhanced cell polarization, cytoskeletal reorganization and molecular transport.15 Confluent kidney cells, when cultured on a synthetic basement membrane of supramolecular polymers and ECM-peptides, remained in a tight monolayer and retained epithelial phenotype and function for periods of up to 19 days when subjected to FSS in a microfluidic device.42 Clearly, administering FSS in vitro encourages physiologically-representative kidney cell function. Coupling a substrate with user-defined topographical patterns to a system with controlled FSS will provide simultaneous and independent control of these highly-influential mechanical parameters. The resulting system would provide further influence of kidney cellsin vitro, in an environment replicating additional, crucial features of the in vivo kidney cell microenvironment. As kidney malfunction and disease often parallel disruption of mechanical features, such as tissue architecture and FSS, a model including these features would inform study of disease progression and development of therapies, and potentially provide a pathway to regenerative and tissue engineering solutions to the problem of kidney failure.
In the present work, we couple both well-defined topographical patterns and well-controlled FSS in one system to stimulate renal proximal tubule cell function. Deliberately-formed, user-defined submicron features mimic naturally occurring features in the kidney tubule and are presented to cells in the form of topographical substrates. Flow through a microfluidic channel which contains the topographical substrates generates FSS to stimulate the cells, thereby mimicking the stimulation from passing renal filtrate in vivo. Together, these physical parameters provide a well-controlled in vitro environment in which we can control and observe kidney cell behavior in a microscale tissue modeling device (MTMD).
2. Materials and methods
2.1 Fabrication of substrate topography
Hot embossing generated the submicron-scale topographical substrates using a nickel mold created by a two-step molding process shown in Fig. 1. First, a silicon master mold was fabricated using standard photolithography and reactive ion etching (RIE) to produce sub-micron topographical features in the form of grooves of 0.75 μm wide and 0.75 μm deep with a 1.5 μm pitch. A seed metal of 10 nm Cr and 50 nm Au was applied to the silicon master mold using an electron-beam evaporator (Temescal, Livermore, CA). Approximately 0.75 mm of a nickel–cobalt alloy was electroformed to the silicon master mold (NiCoForm Inc., Rochester, NY). The silicon master mold was dissolved using hot KOH for 20+ hours to release a nickel alloy inverse replica of the master mold. For the embossing step, the nickel alloy mold was placed with the submicron features in contact with a polystyrene blank in a uniformly heated, temperature- and pressure-controlled automatic hydraulic press (Carver Inc., Wabash, IN). Under a light load, the temperature was ramped to 130 °C. The force was then increased to 1500 lbs and held for 45 minutes. The sample was cooled under constant pressure to 60 °C and released from the nickel alloy mold. The resulting substrate was a replica of the silicon master mold and served as the platform for cell culture experiments. The samples were then sputter-coated with 100 Å of chrome and 200 Å of gold to enable subsequent surface chemistry preparation.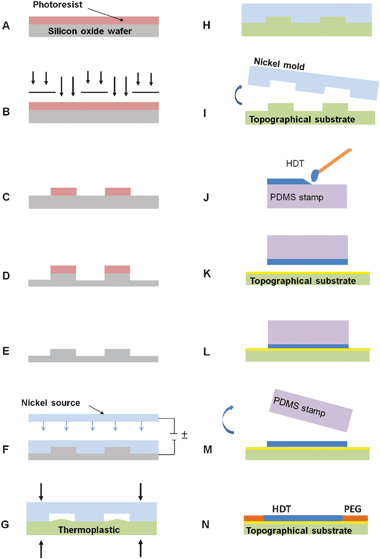 | ||
| Fig. 1 Polystyrene topographical substrates were fabricated by (A) spin-coating a silicon oxide wafer with photoresist, (B) photolithographically patterning the resist, (C) developing the photoresist to create an etch mask, (D) anisotropically etching to transfer photoresist features to the silicon oxide at a depth of 1 μm and (E) stripping the photoresist to create the master mold. Nickel, (F) was electroformed to the silicon wafer to form an inverse mold, (G) to hot emboss using elevated temperature and pressure. The embossed polystyrene (H) was cooled under constant pressure and demolded, (I) from the nickel mold to create the topographical substrate. After gold-coating the substrate, a PDMS stamp (J) was swabbed with HDT solution, placed in contact (K) with the gold-coated surface and (L) held under pressure. The stamp was released (M) to reveal a SAM of hydrophobic HDT. The sample was then back-filled (N) with an EG-terminated thiol solution to create a SAM resistant to protein adsorption. | ||
2.2 Microcontact printing (μCP) of cell adhesive areas
A microcontact printing (μCP) method was used to apply areas of specific surface chemistry to the embossed substrate surface. PDMS stamps were made from the Sylgard 184 (Dow Corning, Midland, MI) pre-polymer and hardener mixed in a 10![[thin space (1/6-em)]](https://www.rsc.org/images/entities/char_2009.gif) :1 ratio by mass, purged of air in a vacuum, and cured at 65° according to the manufacturer's specifications. Prior to μCP, the stamps were thoroughly rinsed in 70% ethanol and dried under nitrogen. A 1 mM solution of hexadecanethiol (HDT), in 200-proof ethanol, was swabbed on the bottom of the stamp, which was again dried under nitrogen. The stamp was brought in contact with the gold-coated substrate and held under light pressure for 30 seconds, forming a hydrophobic self-assembled monolayer (SAM). To ensure the HDT spots corresponded with the MTMD channel placement, a stencil was used to correctly align the stamp during the microcontact printing process.
:1 ratio by mass, purged of air in a vacuum, and cured at 65° according to the manufacturer's specifications. Prior to μCP, the stamps were thoroughly rinsed in 70% ethanol and dried under nitrogen. A 1 mM solution of hexadecanethiol (HDT), in 200-proof ethanol, was swabbed on the bottom of the stamp, which was again dried under nitrogen. The stamp was brought in contact with the gold-coated substrate and held under light pressure for 30 seconds, forming a hydrophobic self-assembled monolayer (SAM). To ensure the HDT spots corresponded with the MTMD channel placement, a stencil was used to correctly align the stamp during the microcontact printing process.
A SAM of poly(ethylene glycol)-terminated alkylthiol (EG-terminated thiol) was applied to the bare gold areas of the cell culture substrates by flooding the samples with a 2 mM solution of EG-terminated thiol in 200-proof ethanol for a minimum of 2 hours. Samples were thoroughly rinsed in ethanol followed by PBS. The substrates were then exposed to a solution of 20 μg mL−1collagen IV in PBS for 2 hours and rinsed in PBS for at least 20 minutes. Since the EG-terminated thiols resisted the adsorption of protein, only the areas stamped with HDT adsorbed the collagen. Thus, when cells were seeded onto the substrate surfaces, they were restricted to the protein-coated regions, which corresponded to the HDT spots.
2.3 Cell culture
Cells from the human renal proximal tubule epithelial cell line (HK-2) were cultured at 37 °C and 5% CO2 with renal tubular epithelial medium (DMEM/F12 supplemented with 0.5% FBS, 10 ng mL−1 hEGF, 5 μg mL−1insulin, 0.5 μg mL−1hydrocortisone, 0.5 μg mL−1epinephrine, 6.5 ng mL−1 tri-idothyronine, 10 μg mL−1 transferrin, 100 U ml−1penicillin, and 100 μg ml−1streptomycin). Media were renewed two to three times weekly and cells were passaged when they reached 80% confluence. Cells were seeded on MTMD substrates, both blank and topographical, at an initial density of 800 cells mm−2 and grown to confluence over a four day period. The MTMD substrates were used 24 hours after cells reached confluency. All cells used in this study were used at a passage number less than 15.2.4 Device fabrication
The flow system was designed to be compatible with a syringe pump (KD Scientific, Holliston, MA). PDMS microfluidic channels with dimensions of 18 mm length, 3 mm width and 150 μm deep, arranged in a 3 × 1 array, were fabricated by curing the PDMS pre-polymer on a micromachined stainless steel mold. The PDMS replicas were released from the molds and holes were punched to serve as inlet and outlet ports of the microfluidic devices. To generate the MTMD, the microfluidic channels were aligned and assembled to the topographical substrates such that the confluent cell monolayers resided strictly within the channel boundaries as illustrated in Fig. 2. Microfluidic channels were also assembled with blank substrates to serve as one set of controls. A fixture, specifically designed with tubing access and real time imaging access ports, locked the MTMD together to prevent leakage.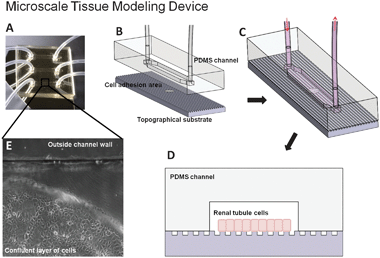 | ||
| Fig. 2 The complete and functioning Microscale Tissue Modeling Device (A) consists of three channels, each of which contains a predetermined area selectively treated for cell adhesion. The disassembled (B) and assembled (C) device consists of two layers: micromolded channels in PDMS and a blank or embossed topographical substrate with selective cell adhesion areas. (D) A cross section of the device illustrates a confluent layer of renal tubule cells within the microfluidic channel and adherent to the topographical substrate. (E) A phase contrast image of cells restricted within the channel and adhered to the cytophilic hexadecanethiol SAM-coated region to avoid edge effects and other external influences. | ||
2.5 Flow tests
HK-2 complete growth media were pre-conditioned by exposing it to 5% CO2 and 37 °C for at least 12 hours, and then delivered to the MTMD in a controlled fashion via a syringe pump. For both blank and topographical substrate types, three conditions were tested: no FSS (τ = 0), low FSS (τ = 0.02 dynes cm−2) and high FSS (τ = 1.0 dyne cm−2). For low FSS and high FSS, samples were exposed to continuous flow of media solution for 2 hours. The flow rate was calculated using , where μ is the medium viscosity at 37 °C (dynes cm−2), Q is the volumetric flow rate (cm3 s−1), b is the channel width and h is the channel height. For the no FSS condition, cells on blank and topographical substrates remained in static media for the duration of the flow tests. Each condition contained at least 3 independent replicates per trial and the entire battery of experiments was repeated over 3 independent trials.
2.6 Cell fixing and staining
After completion of the flow test, samples were rinsed with PBS then fixed with a solution of 3.7% paraformaldehyde in PBS. After an additional PBS rinse, samples were incubated in a permeabilizing solution of 1% Triton-X in PBS. Samples were blocked with 3% FBS in PBS for a minimum of 15 minutes and incubated for 30 minutes with a mouse anti-ZO-1 IgG primary antibody, diluted 1:200 in 1% FBS to label cell TJs. The samples were then rinsed 3 times with PBS, blocked with 3% FSB for 10 minutes, and rinsed again in PBS. The primary antibody was labeled with anti-mouse IgG conjugated to an Alexa fluor 488 dye. F-actin was labeled with rhodamine phalloidin at a 1:200 dilution in 1% FBS and nuclei were labeled with a Hoechst dye at 1:1000 dilution in 1% FBS. Samples were again rinsed three times in PBS, blocked with 3% FBS and rinsed three times with DI water. Glass coverslips were mounted directly on the polystyrene substrates using mounting media and sealed.
2.7 Image collection and statistics
An inverted fluorescent microscope with an attached Coolsnap camera and the image acquisition software, Metavue, were used to collect all cell images. Exposure time was controlled during each image acquisition. For each experiment, over 200 data points, consisting of one cell each, were taken from each sample. At least three replicate samples were analyzed per group. Groups were compared for statistical significance using a one-way ANOVA test with a paired Tukey analysis. Experimental results were verified for 3 independent experiments.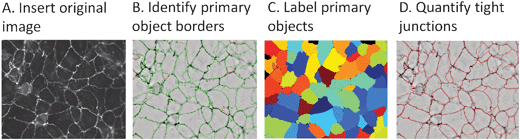 | ||
| Fig. 3 CellProfiler image analysis software receives an image of fluorescently-labeled cells (A) and normalizes intensities across the image. It then identifies object borders (B) and labels primary objects (C) based on user-defined intensity thresholds. Tight junction formation properties are quantified by specifically defining (D) and analyzing the intensity and distribution of labeled ZO-1 protein around cell borders. | ||
3. Results
3.1 Topographical substrates
The master mold silicon wafer possessed submicron topography of grooves of 0.75 μm wide and 0.75 μm deep with a 1.5 μm pitch. The two subsequent pattern transfers to nickel alloy and polystyrene were accurately replicated to within 5% of the original feature sizes. Fig. 4 illustrates this pattern replication with SEM images of the nickel alloy mold and embossed polystyrene. The nickel alloy mold survived for at least 50+ embossing presses with no signs of degradation. The polystyrene released easily from the nickel alloy mold, aided by a SAM of HDT molecules applied to the mold surface. The μCP and collagen-coated embossed topographical substrates indicated the presence of collagen on tops of ridges, bottoms of grooves, and sidewalls of ridges within the μCP areas, with no evidence of collagen outside the μC areas. The resulting chemistry is an adhesive “island” of collagen that exists on both topographically-patterned and non-patterned substrates.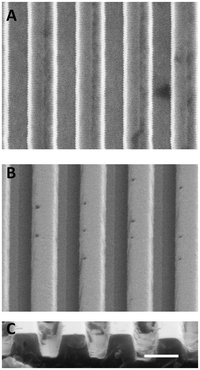 | ||
| Fig. 4 SEM images of ridge/groove topography. The topographical features were accurately transferred via hot embossing from a nickel alloy mold (A) to a polystyrene substrate (B). The edge profile of the polystyrene substrate (C) shows defined ridge/groove features. Ridges and grooves are 0.75 μm wide and 0.75 μm deep with a 1.5 μm pitch (scale bar, 1 μm). | ||
3.2 COMSOL simulation of flow in flow chamber channels
Computer simulation predicted the FSS across the cell adhesion areas to vary less than 5%. Wall shear stress values were highest at the inlet and outlet regions of the channel, but became evenly distributed approximately 4 mm from the inlet and outlet ports, as seen in Fig. 5. Streamline plots showed laminar flow across the main chamber and across the cell adhesion areas. This was also predicted with hand-calculations of the Reynolds number for flow in a wide duct, where the characteristic dimensions were twice the distance between the parallel plates (top and bottom walls of our chamber). Our calculations led to a Re < 50; where fully developed flow with a Reynolds number below 2000 was considered laminar.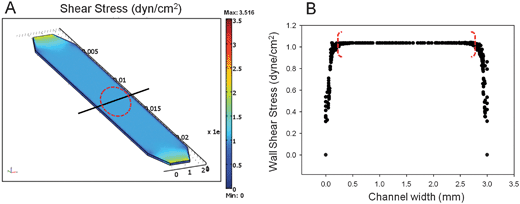 | ||
| Fig. 5 COMSOL simulations predicted relatively uniform shear stress across cell adhesion areas. (A) The shear stress distribution showed higher shear stress at the inlet and outlets of the channel, uniform shear stress at the walls, and zero at the chamber corners. The line indicates location of the profile plot, dashed ellipse indicates the cell adhesion area. (B) The shear stress profile plot was taken across the chamber floor, 12.5 mm from the inlet. Cell adhesion would occur within the dashed lines. The plot indicates that shear stress varies less than 5% across the width of the channel. | ||
3.3 Cell alignment
Quantitative analysis of nuclear alignment showed an influence of both topographical features and FSS on nuclear alignment. Nuclear alignment angles were measured with respect to the ridge/groove features on topographical substrates, oriented at 90°, and cell angles varied from 0–90°. On blank substrates, nuclear alignment was measured with respect to an arbitrary axis at 90°. Fig. 6 shows stained HK-2 nuclei and a corresponding bar graph depicting the fraction of nuclei alignment for each of the six sample sets. Cells on blank substrates appeared randomly oriented, regardless of applied FSS. All three alignment percentages on blank substrates were not significantly different from the theoretical alignment of 11% for randomly oriented cells. FSS coupled with topographic substrates resulted in an increase in nuclear alignment as compared to blank substrates. Cells on topographical substrates not exposed to FSS showed 23.8% of nuclei aligned within 10° of the ridge/groove features. For cells on topographic substrates, the high level of FSS resulted in a significant increase in alignment compared to cells not subjected to FSS. Error bars in Fig. 6 represent the standard deviation of nuclear alignment across sample replicates. Data between replications did not differ significantly from one another.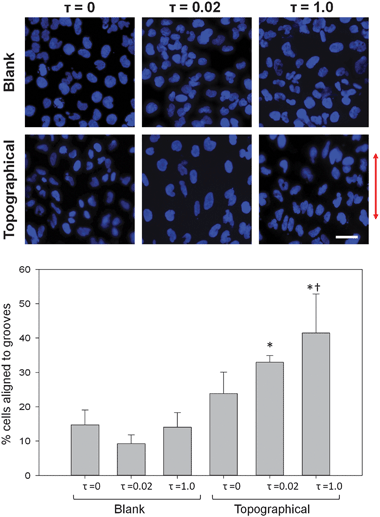 | ||
| Fig. 6 FSS enhanced alignment of cells to topographic patterns. (A) Fluorescently-labeled nuclei of confluent layers of HK-2 cells on topographical substrates exposed to 2 hours of either 0, 0.02 or 1.0 dyne cm−2 FSS exhibited alignment to grooves, while cells on blank substrates did not. The arrow indicates direction of grooves on topographical substrates. (B) Percentage of nuclei aligned to grooves within 10° increased significantly due to the presence of grooves and FSS. The presence of 1 dyne cm−2 FSS significantly increased alignment of nuclei for cells adherent to topographic substrates. Data are presented as mean ± standard deviation. *, P < 0.001 versus blank, τ = 0 samples; †, P < 0.005 versus topographical, τ = 0 substrates (scale bar, 30 μm). | ||
3.4 Tight junction formation
Shear stress and topography both influenced formation of TJs in HK-2 cells. Fig. 7A shows HK-2 cells with fluorescently-labeled ZO-1. The perimeters of cells, as defined by the ZO-1 TJs, transition to a higher intensity with more fluorescence signal as topography and FSS are applied. Overall fluorescent signal, as well as location of the fluorescent signal, indicated increased ZO-1 expression and translocation to cell perimeters. In addition, the cell perimeters transition from a more punctuate morphology to a continuous morphology with the application of topography and FSS. Crisp cell perimeters were less frequently observed for cells on blank substrates without FSS as opposed to cells on topographical substrates with FSS. Both ZO-1 intensity and continuity were analyzed through image processing to quantify the observed effects of topography and FSS on TJ formation.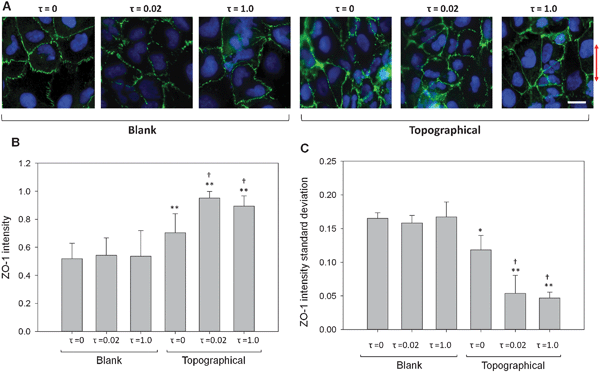 | ||
| Fig. 7 FSS and topography synergistically influenced expression and distribution of ZO-1. (A) Representative images of ZO-1 expression for cells cultured on blank and topographical substrates and exposed to either 0, 0.02 or 1.0 dyne cm−2 FSS. With the addition of topography and FSS stimuli, morphology of the ZO-1 borders transitions from punctate to continuous. The arrow indicates the direction of ridge/groove topography. (B) Intensity of ZO-1, integrated along cell perimeters and normalized by cell perimeter, quantified tight junction expression and distribution. The ZO-1 intensity increased significantly in cells cultured on topographical substrates compared to those on blank surfaces. Cells exposed to all levels of FSS on topographical substrates showed a significant increase in ZO-1 intensity compared to cells on topographical substrates exposed to τ = 0 conditions. (C) Standard deviation of ZO-1 intensity measured along cell perimeters quantifies tight junction continuity. Standard deviation of ZO-1 intensity decreased for all topographical samples compared to cells on blank surfaces and was lowest for cell populations exposed to both topographical substrates and FSS. Cell populations on blank surfaces did not present ZO-1 intensity differences after two hours of FSS. Data are presented as mean ± standard deviation. *, P < 0.05 versus blank, τ = 0 samples; **, P < 0.001 versus blank, τ = 0 samples; †, P < 0.001 versus topographical τ = 0 samples (scale bar, 15 μm). | ||
4. Discussion
In the kidney, tubule epithelial cells are sealed together by tight junctions, which reside on the apical side of the cell and function as a selectively permeable barrier between the renal filtrate in the lumen and fluids in the interstitium. These apical junctional complexes characterize cell–cell adhesion properties and are the main determinant of the permeability characteristics of the proximal tubule.45 The quantification of tight junction formation is, therefore, a model measurement of the quality of renal epithelium.High-throughput image analysis of TJ formation is necessary for accurate and objective data quantification. Evaluation of the TJ quality in confluent cell monolayers exposed to FSS typically involves quantification of ZO-1 or other TJ protein expression with image processing techniques to examine isolated areas of TJ formation.15,39,46 Common image processing methods quantify TJ intensity across a particular cell–cell junction, as well as TJ space between cells39 for discrete, user-defined points along the cell perimeter. To examine the TJ formation of the entire cell perimeter, we used CellProfiler to analyze ZO-1 expression of hundreds of individual cells, across multiple samples. Unlike conventional image processing systems, this technique allowed a large number of cells, over 700 for a given condition in this study, to be analyzed simultaneously. In addition, automated and objective normalization and quantification of parameters occurred without the need for user-selection of analysis sites. Since the entire cell perimeter may respond to extracellular cues, this technique is particularly attractive as it evaluates complete TJ expression around the border of a cell, rather than at discrete points, thus providing a method for robust and objective data analysis.
Cell alignment may be enhanced by FSS in combination with topographic cues. Numerous types of cells align and elongate along ridge/groove topography of substrate surfaces,9 and as a result, cell alignment is used as a common metric of cell influence due to topography. Here, we have chosen to use nuclear alignment as a measure of cell alignment as nuclear alignment has been shown to be at least as stringent a metric as cell body alignment.47 We confirmed alignment of cells to topography through observation of HK-2 renal proximal tubule epithelial cell alignment to sub-micron ridge/groove patterns. In addition, we noted a new observation: FSS alone did not cue alignment of cells but instead enhanced alignment of cells to topography. For the 2 hour duration of FSS used, topography and FSS worked in concert to influence cell alignment, while FSS in the absence of topographical cues did not result in alignment.
The presence of topography may alter the duration and amount of FSS exposure required to significantly influence a population of cells. The 0.75 μm wide grooves approximate the sub-micron feature sizes observed in the BM. In addition, they have feature sizes large enough to elicit significant cellular response yet remain much smaller than the average cell diameter in order to allow formation of a continuous cell monolayer. FSS levels of 1.0 dyne cm−2 and 0.02 dynes cm−2 were chosen based on values obtained from the literature,15,39 which show 1.0 dyne cm−2 to have significant influence on proximal tubule cells. Renal proximal tubule cells have also been shown to respond to a FSS value of as low as 0.17 dynes cm−2,40 which is a stark contrast to endothelial cells, for example, which can experience FSS of 10–40 dynes cm−2in vivo.31 In a blank-substrate flow chamber, 5 hours of FSS at 1 dyne cm−2 has proven sufficient to encourage the alterations in formation of TJs in renal proximal tubule cells.39 Over a range of times, however, cell responses such as actin depolymerization begin to take effect at a minimum of 3 hours of FSS and do not become fully developed until 5 hours of FSS.48 Furthermore, epithelial cell response to a FSS of 0.2 dynes cm−2 over 5 hours has been shown sufficient to induce cytoskeletal reorganization, but not enough to yield full actin depolymerization48 indicating that lower FSS values still impact cell function. Our data confirmed that a short duration of FSS exposure and low values of FSS do not have a significant effect on TJ formation in cell populations cultured on blank substrates. However, cells in this study, stimulated via topographical substrates, exhibited significant TJ response after only 2 hours of exposure to FSS. Also, for cells on topographical patterns, a FSS of 0.02 dynes cm−2 yielded significant changes in cell response compared to zero FSS conditions, but did not differ significantly from high FSS levels. Based on these findings, topographical substrates appeared to accelerate the rate of cell response and increase cell sensitivity to FSS.
FSS in combination with topography enhances the formation of tight junctions. Labeled TJs represent points of cell–cell contact within a monolayer of cells and the degree of fluorescent expression is proportional to junctional “tightness”.49 We noticed higher levels of ZO-1 intensity and continuity in cells cultured on topographical substrates, with the highest levels presented in cells exposed to combined topographical and FSS cues. Previous studies indicate that prolonged exposure to FSS results in a significant reassembly of intercellular junctions,15,39,42 with a dramatic reinforcement of ZO-1 staining.48 Here we confirmed the reassembly of intercellular junctions and reinforcement of ZO-1 staining due to exposure to FSS for 2 hours. However, our studies indicated a requirement of surface topography as an additional cue to signal the alterations in ZO-1 expression. Regardless of substrate topography, however, cells not exposed to FSS frequently presented zig-zag segments of ZO-1 borders as seen in Fig. 7A. Although the degree of local intensity of these regions was unaffected by the irregular pattern, the zig-zag appearances were presumably a sign of incomplete TJ formation. The discontinuity of intensity within the zig-zag features was taken into account when quantifying ZO-1 intensity continuity, and contributed to higher levels of variance among zero FSS samples. The zig-zag segments became less frequent with increased FSS on topographical substrates, indicating a transition to more complete TJ formation. Cells that exhibited high and continuous intensity of ZO-1-labeled TJs were likely poised to form a well-developed, highly functioning epithelial layer with the natural filtering behavior of the renal proximal tubule.
5. Conclusions
The MTMD controlled the mechanical cues of sub-micron topography and FSS independently in vitro resulting in significant influence of kidney epithelial cells and encouragement of in vivo physiology. The modular format of the MTMD allowed the device substrate to possess user-defined biomaterial surface and bulk properties, including combinations of controlled chemistry and topography. In addition, the fabrication methods employed to make the MTMD, particularly micro-contact printing and hot-embossing, enabled discrete placement of cells on a chemically functionalized surface to limit unwanted external influence of the cells. The MTMD was primarily manufactured using non-clean room based fabrication techniques that allow for the replication of high resolution features using inexpensive polymer-based materials in a low-cost, high-throughput manner. The MTMD provides a cell culture platform capable of sustaining and modeling kidney tissues with controlled physiological responses in an in vitro environment.A kidney epithelial cell model, HK-2, cultured within the MTMD responded to both topography and FSS as demonstrated by nuclear alignment analysis and quantification of tight junction characteristics. Advanced image analysis software examined entire cell perimeters to construct a robust, accurate analysis of TJ formation in response to topography and FSS. Consideration of the entire cell perimeter led to observations of altered morphology, or zig-zag sections, around ZO-1 borders that were altered by FSS levels. Topography and FSS worked in concert to elicit an increased rate of alignment and enhanced TJ formation, with topography speeding cell response to FSS when compared to previous studies. Furthermore, cell response to FSS was enhanced on topographical substrates, indicating the synergistic influence of these two mechanical stimuli. Ultimately, the combination of the biomaterial surface property of topography and the fluid flow property of FSS resulted in the creation of a more physiologically-representative in vitro model of kidney tissue. This model can support prevention of kidney disease by improving testing of kidney toxicity while providing a controlled platform to study kidney cell biology, evaluate mechanisms for tissue engineering, and guide development of disease therapies.
Role of the funding source
Draper Laboratory's Internal Research and Development program provided financial support for the conduct of this research. The funding source did not have any involvement in the study design, in the collection, analysis or interpretation of data, in writing of the report or in the decision to submit the paper for publication.Acknowledgements
The authors would like to thank William A. Teynor for guidance in MEMS fabrication, James C. Hsiao and Joseph M. Bauer for technical consultation, and Joan Kelly for cell culture assistance. This work was supported by a Charles Stark Draper Laboratory Internal Research and Development Grant.References
- A. I. Teixeira, G. A. McKie, J. D. Foley, P. J. Bertics, P. F. Nealey and C. J. Murphy, Biomaterials, 2006, 27, 3945–3954 CrossRef CAS.
- M. J. Dalby, N. Gadegaard, R. Tare, A. Andar, M. O. Riehle, P. Herzyk, C. D. Wilkinson and R. O. Oreffo, Nat. Mater., 2007, 6, 997–1003 CrossRef CAS.
- E. A. Ross, M. J. Williams, T. Hamazaki, N. Terada, W. L. Clapp, C. Adin, G. W. Ellison, M. Jorgensen and C. D. Batich, J. Am. Soc. Nephrol., 2009, 20, 2338–2347 CrossRef.
- B. Alberts, Molecular Biology of the Cell, Garland, New York, 2000 Search PubMed.
- V. S. LeBleu, B. Macdonald and R. Kalluri, Exp. Biol. Med. (Maywood), 2007, 232, 1121–1129 CrossRef CAS.
- R. Timpl, Eur. J. Biochem., 1989, 180, 487–502 CrossRef CAS.
- G. A. Abrams, S. S. Schaus, S. L. Goodman, P. F. Nealey and C. J. Murphy, Cornea, 2000, 19, 57–64 CrossRef CAS.
- S. J. Liliensiek, P. Nealey and C. J. Murphy, Tissue Eng., 2009, 15, 2643–2651 CrossRef CAS.
- R. G. Flemming, C. J. Murphy, G. A. Abrams, S. L. Goodman and P. F. Nealey, Biomaterials, 1999, 20, 573–588 CrossRef CAS.
- A. C. Erickson and J. R. Couchman, J. Histochem. Cytochem., 2000, 48, 1291–1306 CrossRef CAS.
- R. Timpl, Curr. Opin. Cell Biol., 1996, 8, 618–624 CrossRef CAS.
- P. D. Yurchenco, Ann. N. Y. Acad. Sci., 1990, 580, 195–213 CrossRef CAS.
- A. Saito, R. Kaseda, M. Hosojima and H. Sato, Int. J. Nephrol., 2010, 2011, 957164 Search PubMed.
- V. Kumar, A. K. Abbas and N. Fausto, Robbins and Cotran Pathological Basis of Disease, Elsevier Saunders, Philadelphia, seventh edn, 2005 Search PubMed.
- K. J. Jang and K. Y. Suh, Lab Chip, 2010, 10, 36–42 RSC.
- A. Vasilyev, Y. Liu, S. Mudumana, S. Mangos, P. Y. Lam, A. Majumdar, J. Zhao, K. L. Poon, I. Kondrychyn, V. Korzh and I. A. Drummond, PLoS Biol., 2009, 7, e9 Search PubMed.
- I. Drummond, Trends Cell Biol., 2003, 13, 357–365 CrossRef.
- J. L. Charest and W. P. King, in BioNanoFluidic MEMS, ed. P. Hesketh, Springer Science, New York, 2008 Search PubMed.
- P. Clark, P. Connolly, A. S. Curtis, J. A. Dow and C. D. Wilkinson, Development, 1990, 108, 635–644 CAS.
- P. Weiss, Int. Rev. Cytol., 1958, 7, 391–423 CrossRef.
- C. J. Bettinger, R. Langer and J. T. Borenstein, Angew. Chem., Int. Ed., 2009, 48, 5406–5415 CrossRef CAS.
- W. W. Minuth, L. Denk, C. Meese, R. Rachel and A. Roessger, Langmuir, 2009, 25, 4621–4627 CrossRef CAS.
- B. Subramanian, D. Rudym, C. Cannizzaro, R. Perrone, J. Zhou and D. L. Kaplan, Tissue Eng., 2010, 16, 2821–2831 CrossRef CAS.
- E. K. Yim and K. W. Leong, Nanomedicine, 2005, 1, 10–21 CrossRef CAS.
- E. Rebollar, I. Frischauf, M. Olbrich, T. Peterbauer, S. Hering, J. Preiner, P. Hinterdorfer, C. Romanin and J. Heitz, Biomaterials, 2008, 29, 1796–1806 CrossRef CAS.
- S. Ogawa, Z. Ota, K. Shikata, K. Hironaka, Y. Hayashi, K. Ota, M. Kushiro, N. Miyatake, N. Kishimoto and H. Makino, Am. J. Nephrol., 1999, 19, 686–693 CrossRef CAS.
- A. Blattmann, L. Denk, R. Strehl, H. Castrop and W. W. Minuth, Biomaterials, 2008, 29, 2749–2756 CrossRef CAS.
- Y. Yamasaki, H. Makino and Z. Ota, Nephron, 1994, 66, 189–199 CrossRef CAS.
- K. Hironaka, H. Makino, Y. Yamasaki and Z. Ota, Kidney Int., 1993, 43, 334–345 CrossRef CAS.
- S. Gerecht, C. J. Bettinger, Z. Zhang, J. T. Borenstein, G. Vunjak-Novakovic and R. Langer, Biomaterials, 2007, 28, 4068–4077 CrossRef CAS.
- P. F. Davies, Physiol. Rev., 1995, 75, 519–560 CAS.
- S. L. Diamond, S. G. Eskin and L. V. McIntire, Science, 1989, 243, 1483–1485 CAS.
- Y. Kawai, Y. Matsumoto, K. Watanabe, H. Yamamoto, K. Satoh, M. Murata, M. Handa and Y. Ikeda, Blood, 1996, 87, 2314–2321 CAS.
- J. R. Glossop and S. H. Cartmell, Gene Expression Patterns, 2009, 9, 381–388 CrossRef CAS.
- S. Kapur, D. J. Baylink and K. H. Lau, Bone, 2003, 32, 241–251 CrossRef CAS.
- Basic Histology, ed. L. Junqueira and J. Carneiro, McGraw Hill, New York, 2005 Search PubMed.
- Z. Cai, J. Xin, D. M. Pollock and J. S. Pollock, Am. J. Physiol. Renal Physiol., 2000, 279, F270–F274 CAS.
- J. P. Bonvalet and C. de Rouffignac, J. Physiol., 1981, 318, 85–98 CAS.
- Y. Duan, N. Gotoh, Q. Yan, Z. Du, A. M. Weinstein, T. Wang and S. Weinbaum, Proc. Natl. Acad. Sci. U. S. A., 2008, 105, 11418–11423 CrossRef CAS.
- M. Essig, F. Terzi, M. Burtin and G. Friedlander, Am. J. Physiol. Renal Physiol., 2001, 281, F751–F762 CAS.
- W. Liu, S. Xu, C. Woda, P. Kim, S. Weinbaum and L. M. Satlin, Am. J. Physiol. Renal Physiol., 2003, 285, F998–F1012 CAS.
- P. Y. Dankers, J. M. Boomker, A. Huizinga-van der Vlag, E. Wisse, W. P. Appel, F. M. Smedts, M. C. Harmsen, A. W. Bosman, W. Meijer and M. J. van Luyn, Biomaterials, 2011, 32, 723–733 CrossRef CAS.
- J. L. Charest, M. T. Eliason, A. J. Garcia and W. P. King, Biomaterials, 2006, 27, 2487–2494 CrossRef CAS.
- A. E. Carpenter, T. R. Jones, M. R. Lamprecht, C. Clarke, I. H. Kang, O. Friman, D. A. Guertin, J. H. Chang, R. A. Lindquist, J. Moffat, P. Golland and D. M. Sabatini, Genome Biol., 2006, 7, R100 CrossRef.
- W. C. Prozialeck, J. R. Edwards, P. C. Lamar and C. S. Smith, Toxicol. in Vitro, 2006, 20, 942–953 CrossRef CAS.
- M. Essig, F. Terzi, M. Burtin and G. Friedlander, Renal Physiol., 2010, 281, 751–762 Search PubMed.
- M. J. Dalby, M. O. Riehle, S. J. Yarwood, C. D. Wilkinson and A. S. Curtis, Exp. Cell Res., 2003, 284, 274–282 CrossRef CAS.
- K. J. Jang, H. S. Cho, D. H. Kang, W. G. Bae, T. H. Kwon and K. Y. Suh, Integr. Biol., 2011, 3, 134–141 RSC.
- J. M. Anderson, B. R. Stevenson, L. a. Jesaitis, D. a. Goodenough and M. S. Mooseker, J. Cell Biol., 1988, 106, 1141–1149 CrossRef CAS.
| This journal is © The Royal Society of Chemistry 2012 |