Preparation of new biobased polyesters containing glycerol and their photodurability for outdoor applications
Annamaria
Celli
*a,
Paola
Marchese
a,
Simone
Sullalti
a,
Corrado
Berti
a,
Giancarlo
Barbiroli
b,
Sophie
Commereuc
c and
Vincent
Verney
de
aDipartimento di Ingegneria Civile, Ambientale e dei Materiali, Via Terracini 28, 40131, Bologna, Italy. E-mail: annamaria.celli@unibo.it; Fax: +39 051 2090322; Tel: +39 051 2090349
bDipartimento di Scienze Aziendali, Area Tecnologica e Valorizzazione delle Risorse, Piazza Scaravilli 2, 40126, Bologna, Italy
cClermont Université, ENSCCF, LPMM, BP 10448, F-63000, Clermont-Ferrand, France
dClermont Université, Université Blaise Pascal, LPMM, BP 10448, F-63000, Clermont-Ferrand, France
eCNRS, UMR 6505, LPMM, BP 174, F-63174, Aubière, France
First published on 11th November 2011
Abstract
The synthesis of novel poly(butylene dodecanoate)s containing different percentages of glycerol was successfully carried out. The polyesters are characterized by branched or cross-linked molecular structures, according to the glycerol content. The modification of the linear backbone of the poly(butylene dodecanoate) increases the rigidity and induces significant changes in the polymer behavior toward photodegradation with respect to UV irradiation. Such a result could be very significant for specific outdoor applications of the novel polyesters.
1. Introduction
Today, given the urgent need to replace petroleum resources and to solve waste problems attached to non-biodegradable plastics, aliphatic polyesters, biodegradable and prepared from renewable resources that are biodegradable, could play a relevant role. Therefore, much effort has recently been devoted to the preparation of new aliphatic biopolyesters, starting from non-conventional monomers, and to the modification of existing biopolyesters, in order to obtain novel properties.Glycerol is a basic component of lipids and a by-product of biodiesel production. Due to its three –OH functional groups, it is often used as monomer together with a diacid for the synthesis of polyesters characterized by a complex three-dimensional structure, and, thus, by elasticity. Glycerol was polymerized with sebacic acid to prepare polyglycerol sebacate (PGS), an elastomeric biodegradable material developed for use in soft tissue engineering,1 in regenerative medical approaches,2 and for applications in blood vessels in vivo.3 Moreover, PGS also possesses the ideal properties of drug carriers4 and reveals interesting shape-memory properties.5 Other polyesters based on glycerol with sebacic acid and glycol,6,7 with adipic acid,8 with dodecanedioic acid9 were mainly developed for medical applications. All the examples describe the use of glycerol to form elastomers with cross-linked structures.
On the other hand, glycerol can be used as a monomer also to modify the chemical structure of polyester-based thermoplastics, to form branched or cross-linked networks. In this case, only a small amount of glycerol is needed in order to maintain the thermoplastic properties of the starting material.
In this paper we modified a linear poly(alkylene dicarboxylate), the poly(butylene dodecanoate) (called 4–12, from the number of carbon atoms of diol and diester, respectively). This polymer is interesting because it can be prepared from monomers obtainable from renewable feedstock, through chemical or biochemical pathways,10,11 and it is biodegradable. Moreover, it is characterized by photo-stability, a very important property for aliphatic polyesters, which differentiates them from aromatic polyesters in outdoor applications.
The focus of this study was the preparation of novel biobased polyesters characterized by a low level of branching and, thus, by modified properties with respect to the starting material. For example, mechanical properties should be improved; durability toward UV exposure and biodegradability should be adapted to the uses. Indeed, the final idea is to adjust the resistance to biodegradation of the novel polyesters thanks to the structure changes occurring during the UV irradiation. Such a result, still to be tested, should be significant for outdoor uses.
2. Experimental
2.1 Materials
1,4-Butanediol (BD), 1,12-dodecanedioic acid (DA), glycerol (GL), titanium tetrabutoxide (TBT) (all from Aldrich Chemicals) were high purity products and not purified before use.2.2 Synthesis
The synthesis of the 4–12 homopolymer is described in ref. 12 The synthesis of the sample containing 1.0 mol% of GL ((4–12)-GL1.0) is reported.DA (34.55 g, 0.150 mol), GL (0.14 g, 0.0015 mol), BD (16.00 g, 0.18 mol), TBT (0.15 g, 0.44 mmol) were placed inside a round bottom wide-neck glass reactor (250 ml capacity). The reactor was closed with a three-necked flat flange lid equipped with a mechanical stirrer with a torque meter, which gives an indication of the viscosity of the reaction melt, and a condenser. The reactor was immersed into a salt bath preheated to 200 °C. The first stage was conducted at atmospheric pressure under nitrogen atmosphere and the mixture was allowed to react for 90 min under stirring with continuous removal of water by condensation. The reaction was stopped and the reactor was taken out of the salt bath and cooled to room temperature; new TBT was added (0.15 g, 0.44 mmol). The reactor was again put into the salt bath preheated to 200 °C until all products had melted. The second stage was started by gradually reducing the pressure to 0.2 mbar while the temperature was raised to the final value of 240 °C. Such conditions were reached within 90 min, using a linear gradient of temperature and pressure, and maintained for 120 min.
The molar glycerol contents used are 0.5, 1.0, and 2.0% in order to obtain polyesters with different compositions. They are named (4–12)-GLx, where x is the glycerol feed amount (mol%). The final molar composition of the polymers is reported in Table 1.
| Sample | Feed amount of glycerol (mol%) | Final amount of glycerol in polymers (mol%)a | M w × 10−3b | M w/Mnb |
|---|---|---|---|---|
| a Calculated by 1H NMR. b Calculated by GPC. c Limit of detectability. d Calculated in the soluble fraction. | ||||
| 4–12 | — | — | 78 | 2.5 |
| (4–12)-GL0.5 | 0.5 | 0.4c | 92 | 2.5 |
| (4–12)-GL1.0 | 1.0 | 0.8 | 129 | 3.4 |
| (4–12)-GL2.0 | 2.0 | 0.9d | 224d | 4.1d |
2.3 Characterization
The 1H NMR spectra were recorded at room temperature on samples dissolved in CDCl3 using a Varian Mercury 400 spectrometer, the proton frequency being 400 MHz.Molecular weights (expressed in equivalent polystyrene) were determined by gel permeation chromatography (GPC), using a Hewlett Packard Series 1100 liquid chromatography instrument equipped with a PL gel 5 μ Mixed-C column. Chloroform was used as eluent and a calibration plot was constructed with polystyrene standards.
The calorimetric analysis was carried out by means of a Perkin–Elmer DSC6, calibrated with high purity standards. The measurements were performed under nitrogen flow. In order to cancel the previous thermal history, the samples (ca. 10 mg) were initially heated to 140 °C at 20 °C min−1, kept at high temperature for 1 min and then cooled to −70 °C at 10 °C min−1. After this thermal treatment, the samples were analyzed by heating to 140 °C at 10 °C min−1 (2nd scan). During the cooling scan the crystallization temperature (TCC) and the enthalpy of crystallization (ΔHCC) were measured. During the 2nd scan the melting temperature (Tm) and the enthalpy of fusion (ΔHm) were determined.
Specimens for dynamic mechanical measurements were obtained by injection molding in a Mini Max Molder (Custom Scientific Instruments) equipped with a rectangular mold (30 × 8 × 1.6 mm3). The molded samples were rapidly cooled in water and then dried overnight in an oven at 40 °C, under vacuum. Dynamic mechanical measurements were performed with a dynamic mechanical thermal analyzer (Rheometrics Scientific, DMTA IV), operated in dual cantilever bending mode, at a frequency of 3 Hz and a heating rate of 3 °C min−1, over a temperature range from −120 °C to a final temperature of 40 °C.
2.4 Photodurability experiments
The rheological and photodegradability studies were performed on films (about 100 μm) prepared by compression molding between two Teflon sheets at T = 100 °C and P = 200 bar.Samples were exposed to UV irradiation at 60 °C in an accelerated photo-ageing device (based on SEPAP 12–24 device and described elsewhere13). The polychromatic set up was equipped by a « medium pressure » mercury source filtered by borosilicate envelope (Mazda type MA 400) supplying radiation of wavelengths longer than 300 nm. This source is positioned along the focal axis of a cylinder with elliptical base. Sample films, fixed on aluminum holders, turned around the other focal axis. The inside of the chamber is made of highly reflecting aluminum. The temperature of samples was controlled by a thermocouple connected with a temperature regulator device which controls a fan. All experiments were carried out at 60 °C. Films were analyzed after various exposure times.
Molecular changes upon UV exposure were monitored by melting viscoelasticity experiments in oscillatory shear mode using a rotational controlled strain rheometer (ARES/Rheometric Scientific) equipped with parallel plate geometry, with an 8 mm diameter, while the gap between the plates was about 1 mm. For all cases, the values of the strain amplitude were checked to ensure that all measurements were conducted within the linear viscoelastic region. At different time during the photoageing, a frequency sweep extending from 0.1 to 100 rad s−1 was performed. All experiments were carried out at 85 °C.
3. Results and Discussion
3.1 Molecular characterization
Fig. 1 shows the 1H NMR spectrum of 4–12 homopolymer, with the proton assignments. Fig. 2 reports a comparison between the regions from 3.6 to 5.6 ppm of the 1H NMR spectra of 4–12 and two of the novel polyesters containing 1.0 and 2.0 mol% of glycerol ((4–12)-GL1.0 and (4–12)-GL2.0), respectively. The signals located at 5.25 ppm in Fig. 2 were attributed to the proton of the –CH– group of the glycerol units (H7), when all –OH react, according to the signal attributions reported for triacetine. Therefore, by comparing the relative intensity of the signals at 5.25 ppm with the one at 4.10 ppm (H1) it is possible to evaluate the amount of glycerol in the final polymers. The data are reported in Table 1 and indicate that all glycerol reacts when present in a low percentage (0.5 and 1.0 mol%). On the other hand, the sample (4–12)-GL2.0 is not fully soluble in chloroform; therefore, the content of glycerol has been evaluated only in the soluble fraction and, for this reason, appears very low.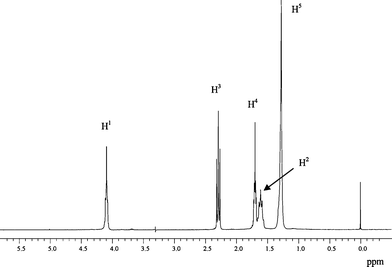 | ||
| Fig. 1 1H NMR spectrum of 4–12 homopolymer. 1H NMR (CDCl3): δ = 1.3 (m, H5), 1.6 (m, H2), 1.7 (m, H4), 2.3 (t, H3), 4.1 (t, H1). | ||
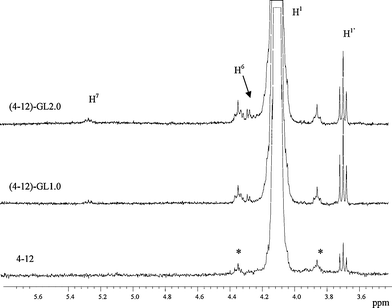 | ||
| Fig. 2 1H NMR spectra of 4–12 and novel polyesters containing 1.0 and 2.0 mol% of glycerol. For the (4–12)-GL2.0 sample only the soluble fraction has been analyzed.1H NMR (CDCl3): δ = 3.7 (t, H1′), 4.1 (t, H1), 4.3 (m, H6), 5.25 (m, H7). * = 13C satellites for H1 triplet. | ||
To better understand the molecular structure of the 4–12/glycerol samples, it is necessary to investigate whether or not all three hydroxyl groups of glycerol react with the 1,12-dodecanedioic acid. Indeed, the secondary hydroxyl group in glycerol is characterized by a higher steric inhibition with respect to the other ones and should be less reactive. All the possible dyads derived by the combination of BD, GL, and DA were taken into consideration, as shown in Scheme 1:
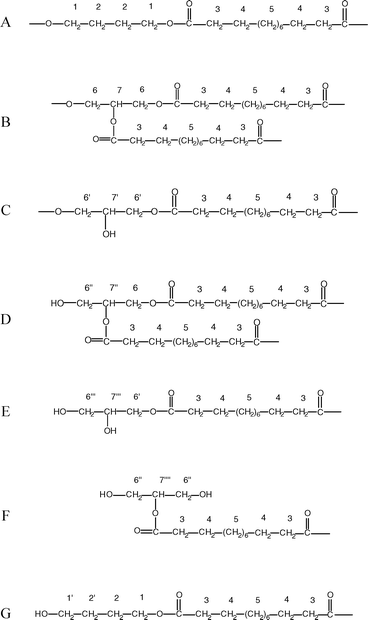 | ||
| Scheme 1 Possible dyads derived from the reactions between BD, DA, and GL. | ||
- structure A corresponds to the sequence obtained from the reaction between DA and BD to form 4-12 homopolymer;
- structure B corresponds to the sequence obtained from DA and GL, where all three –OH groups react;
- structures C and D correspond to the sequences obtained when only two –OH groups of GL react;
- structures E and F correspond to the sequences obtained when only one –OH of GL reacts with the formation of a chain end;
- structure G corresponds to the sequence obtained when only one –OH group of BD reacts with the formation of a chain end.
In Scheme 1 the assignments of protons for 1H NMR analysis are also reported. The signals at 3.7 ppm can be attributed to H1′protons. Moreover, the signals at 4.3 and 5.25 ppm were attributed to H6 and H7protons, respectively, according to the signal attributions reported for triacetine. Signals due to other protons are not distinguishable. H6′, H6′′, and H6′′′ should give signals in the 3.7–4.2 ppm region but could also be partially hidden by other, more intense, signals. H7′ and H7′′ should be evident in the 4.4–4.6 ppm region: their absence indicates that the C and D structures of Scheme 1 are not very probable. H7′′′ and H7′′′′, which should give signals at 3.9–4.1 ppm, do not show a clear evidence of their presence. Therefore, there is not evidence, from the 1H NMR results, for the presence of E and F structures. In front of these conclusions, 13C NMR analysis was considered not useful to generate additional information on sample structures.
As a conclusion, the most probable molecular structures for the 4–12/glycerol polyesters are A and B, corresponding to the 4–12 homopolymer and to a branched system, where glycerol units act as branching agent with their three functional groups. Moreover, starting from B, it is possible to also advance the hypothesis of the formation of some more complex, cross-linked structures. Some experimental evidence confirms such a possibility, in particular in the sample containing 2.0 mol% of glycerol. Indeed, this sample is characterized by a very high viscosity, which increases as the polymerization time rises, and by an incomplete solubility in chloroform, due to an extensive cross linking.
Finally, polymerizations performed with starting amounts of glycerol higher than 2.0 mol% are not possible in the conditions described above, given the extremely high viscosity of the medium.
3.2 Thermal and mechanical characterizations
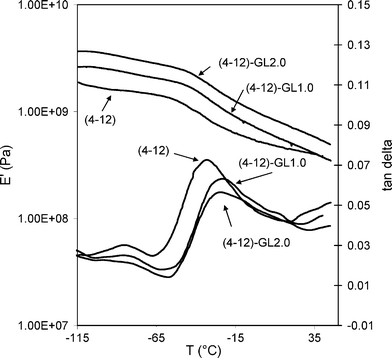
Table 2 gathers the thermal data of all the samples analyzed. It must be underlined that all the polymers are semicrystalline: in fact both the homopolymer and the samples with glycerol are characterized by very sharp and intense crystallization peaks, indicating a high level of crystallinity and crystal perfection. Even if the melting temperature is not affected by the glycerol content, however the melting peak slightly broadens for 2 mol% of glycerol. For this sample, the presence of cross linking causes a wider distribution of crystal perfection. In any case, it is worth noting that the addition of glycerol does not significantly affect the thermal properties, in spite of changes in molecular structure, probably due to the fact that 4–12 is a very fast crystallizing polymer.Fig. 3 shows the dynamic mechanical spectra of the 4–12 and 4–12/glycerol samples. For the specimens containing glycerol only the curves referring to the samples with 1.0 and 2.0 mol% of glycerol are shown. Indeed, the curve obtained from the (4–12)-GL0.5 is very similar to that of the (4–12)-GL1.0 specimen. Looking at tanδ curves, the 4–12 homopolymer shows an intense peak at −32 °C, due to the glass-to-rubber transition. Another peak is centred at about −80 °C and can be associated, by analogy with other similar macromolecules, to the motions of the methylene units deriving from butanediol and/or dodecanedioic acid.14 The intensity of this relaxation at low temperature tends to decrease with the increment of glycerol amount, due to the restrictions of chain motions in the presence of branching and cross linking.
It is notable that the Tg values of the samples containing glycerol are all very similar, in the range from −24 to −22 °C, thus about 10 °C higher than that of 4–12. This increment can be ascribed to the less flexible chains due to the presence of branches which occur after the addition of glycerol.
As to the elastic modulus, Fig. 3 shows that the addition of glycerol strongly affects the mechanical properties of the copolyesters. Indeed, (4–12)-GL1.0 shows a certain increment in E′ which becomes more important in the presence of 2.0 mol% of glycerol. Such a good result is also strictly connected to branching and partial crosslinking in the case of (4–12)-GL2.0, of the novel structures. However, the characteristics of thermoplastic materials are maintained.
3.3 Photodegradation
The exposure to UV irradiation could induce chain scissions and/or recombinations in polymeric backbone, through the photo- (as thermo-) oxidative processes. The occurrence of such phenomena causes changes in molecular parameters, which can be revealed by means of the analysis of the evolution of rheological material properties (dynamic viscoelastic properties).It is noteworthy that a single parameter cannot be used to characterize the stress–strain relationship in viscoelastic material. However, it is well-known that the zero shear viscosity η0 depends on the molecular weight and obeys a power law:
| η0 ∝ Mwα |
The zero shear viscosity η0 can be obtained from the complex viscosity η*(ω):
| η* = G*(ω)/iω = η′ − i η′′ |
| | η*|ω→0 = | η′|ω→0 = η0 |
An empirical rheological model used to fit dynamic data is the Cole-Cole plot expressed by:15,16,17
| η*(ω) = η0/[1 + (i ωλ0)1−h] |
This model predicts the variation of the viscosity components (η′′ versus η′) to be an arc of a circle in the complex plane. From this representation it is easy to determine the distribution parameters: η0 is obtained through the extrapolation of the arc of a circle on the real axis, while the distribution parameter h is obtained through the measurement of the Φ = hπ/2 angle between the real axis and the radius going from the origin of the axis to the centre of the arc of a circle (see Scheme 2).
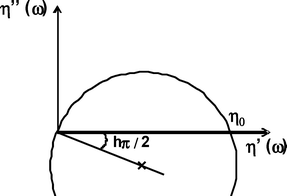 | ||
| Scheme 2 Cole–Cole plot. | ||
Fig. 4 shows the evolution of Cole–Cole plots of the 4–12 homopolymer through accelerated photoageing. Firstly, at initial time the Cole–Cole plot looks like a standard circle. It could be noticed a slight deviation at lower frequencies (higher η′) exhibiting a double distribution of the molecular weights due to very long macromolecular chains. As photoageing proceeds, the curves clearly indicate double phases: one is described as a standard Cole–Cole plot. It is worth noting that the zero shear viscosity η0 has a strong decrease as a consequence of UV exposure (from 20 to 60 h). The η0 value falls by about one decade, which means that Mw molecular weight is divided by about 2. Thus, the mass-average molecular weight decrease, evaluated by viscoelastic results, points out that scission reactions prevail in this phase. Elsewhere, a second phase is characterized by a strong deviation of the Cole–Cole curve leading to a linear relationship between η′ and η′′. It is a typical feature of a crosslinked system.18
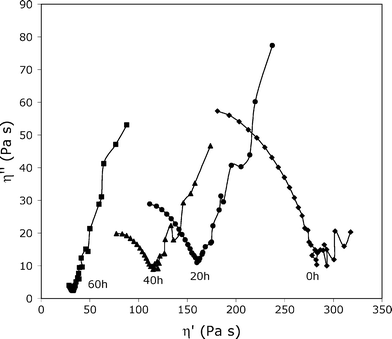 | ||
| Fig. 4 Cole–Cole plots for 4–12 sample upon accelerated photoageing at 60 °C. The viscoelastic properties were measured at 85 °C. | ||
Hence, the photodegradation of 4–12 homopolymer exhibits a dual process under our experimental conditions: chain scissions and chain recombinations occur simultaneously, leading to two phases, a crosslinked one and another not crosslinked. It could be considered that, as the photodegradation takes place, the extent of the crosslinked phase increases.
The addition of 0.5 mol% of glycerol induces a strong increase in the zero shear viscosity, due to the branching. The viscosity of (4–12)-GL0.5 decreases during UV irradiation. We assume that glycerol introduction in the polymeric backbone impacts the photodegradation mechanism and favors chain scissions.
Fig. 5 shows the Cole–Cole plots of a sample modified with 1.0 mol% of glycerol. It is obvious that at t = 0 the extrapolated η0 value is very high, as expected. After 20 h of photoageing at 60 °C, η0 increases further, thus suggesting that chain recombinations occur. At 40 h or longer exposure times, instead, drastic chain scissions prevail. To confirm the presence of the unexpected recombination of chains at short exposure times, the accelerated photoageing was also carried out in a similar device (SEPAP 14–24), operating at 45 °C, for times varying from 2 to 20 h. The results are shown in Fig. 6: it must be remarked that an increase of viscosity again occurs at times shorter than 20 h and also that chain recombinations are detected. Therefore, the behavior of (4–12)-GL1.0 sample shows a strong competition between chain scissions and chain recombinations during photoageing. As the photooxidation proceeds, chain scissions drastically prevail. This means that a small amount of glycerol inserted along the chains of 4–12 is able to strongly modify the behavior of polyester toward photoageing. This can be a significant result for outdoor applications of the polymer.
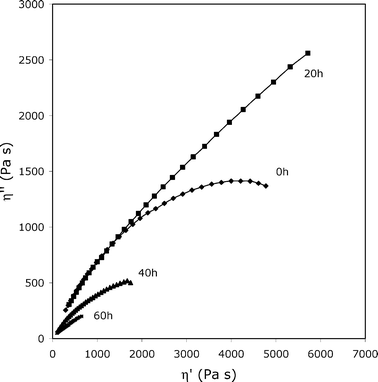 | ||
| Fig. 5 Cole–Cole plots for (4–12)-GL1.0 upon accelerated photoageing. The viscoelastic properties were measured at 85 °C. | ||
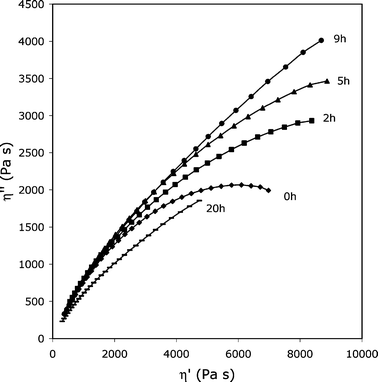 | ||
| Fig. 6 Cole–Cole plots for (4–12)- GL1.0 upon accelerated photoageing at 45 °C in the 14–24 set-up. The viscoelastic properties were measured at 85 °C. | ||
On the other hand, the (4–12)-GL2.0 (see Fig. 7) is partially crosslinked already at t = 0 h: the Cole–Cole curve is typical of those of a tridimensional network polymer system and could be drawn as a line with a very high slope. In this case, the amount of glycerol is high enough to favor the formation of a very complex molecular structure in the starting material. After UV irradiation, the slope of the line drastically decays upon exposure. It is interesting to draw attention to the fact that a double distribution appears after 20 h of irradiation. The Cole–Cole curve could be considered as the convolution of a standard arc of a circle (corresponding to a not crosslinked phase) and a straight-line (ascribed to a network). Consequently, photodegradation mechanism mainly proceeds by chain scissions.
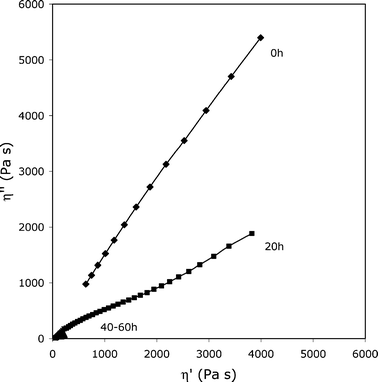 | ||
| Fig. 7 Cole–Cole plots for (4–12)-GL2.0 upon accelerated photoageing. The viscoelastic properties were measured at 85 °C. | ||
Preliminary biodegradation tests of in an aqueous mineral nutrient liquid medium inoculated with micro-organisms resulting from activated sludge, indicate that the polyester/glycerol samples maintain the biodegradability of 4–12,19 but the precise trend of the biodegradation rate as a function of the glycerol content has to be verified.
4. Conclusions
1,12-Dodecanedioic acid, 1,4-butanediol, and glycerol were successfully used as monomers to obtain novel polyesters characterized by long aliphatic –(CH)2– sequences and a different degree of branching, according to the glycerol content. The polymers are characterized by high level of crystallinity, high melting temperature, and good mechanical performances. Moreover, small amounts of glycerol strongly modify the behavior upon photoageing and the photodegradation process. Chain scissions and chain recombinations (leading to crosslinking) strongly compete. Mechanism of chain scissions prevails upon exposure, even in case of previously crosslinked systems. This could act as a significant result for outdoor applications of the materials and could have strong consequences regarding biodegradability upon use. A correlation between photoageing and biodegradability needs further study.References
- Y. D. Wang, Y. M. Kim and R. Langer, J. Biomed. Mater. Res., 2003, 66A, 192–197 CrossRef CAS.
- C. A. Sundback, J. Y. Shyu, Y. Wang, W. C. Faquin, R. S. Langer, J. P. Vacanti and T. A. Hadlock, Biomaterials, 2005, 26, 5454–64 CrossRef CAS.
- D. Metlagh, J. Yang, K. Y. Lui, A. R. Webb and G. A. Ameer, Biomaterials, 2006, 27, 4315–24 CrossRef.
- Z.-J. Sun, C. Chen, M.-Z. Sun, C.-H. Ai, X.-L. Lu, Y.-F. Zheng, B.-F. Yang and D.-L. Dong, Biomaterials, 2009, 30, 5209–14 CrossRef CAS.
- W. Cai and L. Liu, Mater. Lett., 2008, 62, 2171–73 CrossRef.
- J. Tang, Z. Zhang, Z. Song, L. Chen, X. Hou and K. Yao, Eur. Polym. J., 2006, 42, 3360–3366 CrossRef CAS.
- L. Liu and W. Cai, Mater. Lett., 2009, 63, 1656–58 CrossRef CAS.
- J.-F. Stumbé and B. Bruckmann, Macromol. Rapid Commun., 2004, 25, 921–24 CrossRef.
- F. Migneco, Y.-C. Huang, R. K. Birla and S. J. Hollister, Biomaterials, 2009, 30, 6479–84 CrossRef CAS.
- I. K. Bechthold, S. Bretz, R. Kabasci and A. Kopitzky, Chem. Eng. Technol., 2008, 31, 647–654 CrossRef CAS.
- L. Wenhua, J. E. Ness, W. Xie, X. Zhang, J. Minshull and R. A. Gross, J. Am. Chem. Soc., 2010, 132, 15451–15455 CrossRef.
- G. Barbiroli, C. Lorenzetti, C. Berti, M. Fiorini and P. Manaresi, Eur. Polym. J., 2003, 39, 655–661 CrossRef CAS.
- J. Lemaire, R. Arnaud and J. Lacoste, Acta Polym., 1988, 39, 27–32 CrossRef CAS.
- C. Berti, A. Celli, M. Marchese, G. Barbiroli, F. Di Credico, V. Verney and S. Commereuc, Eur. Polym. J., 2008, 44, 3650–3661 CrossRef CAS.
- V. Verney and A. Michel, Rheol. Acta, 1989, 28, 54–60 CrossRef CAS.
- J. F. Vega, A. Munoz-Escalona, A. Santamaria, M. E. Munoz and P. Lafuente, Macromolecules, 1996, 29, 960–965 CrossRef CAS.
- J. P. Montfort, G. Marin and P. Monge, Macromolecules, 1984, 17, 1551–1560 CrossRef CAS.
- H. H. Winter, Gel point in encyclopedia of polymer science and engineering, John Wiley & Sons, New York, 1989 Search PubMed.
- C. Berti, A. Celli, P. Marchese, G. Barbiroli, F. Di Credico, V. Verney and S. Commereuc, Eur. Polym. J., 2009, 45, 2402–2412 CrossRef CAS.
| This journal is © The Royal Society of Chemistry 2012 |

