Gold, palladium and gold–palladium supported nanoparticles for the synthesis of glycerol carbonate from glycerol and urea
Mohd
Hasbi Ab Rahim
a,
Qian
He
b,
Jose A.
Lopez-Sanchez†
*a,
Ceri
Hammond
a,
Nikolaos
Dimitratos
a,
Meenakshisundaram
Sankar
a,
Albert F.
Carley
a,
Christopher J.
Kiely
b,
David W.
Knight
a and
Graham J.
Hutchings
*a
aCardiff Catalysis Institute, School of Chemistry, Cardiff University, Main Building, Park Place, Cardiff, CF10 3AT, UK. E-mail: hutch@cardiff.ac.uk; Fax: +44 (0)29 2087 4059; Tel: +44 (0)29 2087 4059
bCenter for Advanced Materials and Nanotechnology, Lehigh University, 5 East Packer Avenue, Bethlehem, PA 18015-3195, USA
First published on 23rd May 2012
Abstract
Supported Au–Pd nanoparticles are shown to be effective catalysts for the transformation of glycerol into glycerol carbonate. The reaction of glycerol with urea to form glycerol carbonate is a very attractive reaction that utilises two inexpensive and readily available raw materials in a chemical cycle that, overall, results in the chemical fixation of carbon dioxide. Previous reports are largely based on the utilisation of high concentrations of metal sulphates or oxides, which suffer from low intrinsic activity and selectivity and limited recoverability due to the dissolution of the catalyst in the reaction media. We now report that magnesium oxide is an excellent support for gold and bimetallic gold–palladium nanoparticles for this reaction. The preparation method and pre-treatment affect the catalytic performance and a colloidal preparation route produces the most active catalysts.
Introduction
There is increasing interest in the catalytic application of supported nanoparticles in green reactions.1,2 In particular, gold catalysts have attracted great interest, despite the perceived inertness of this metal.3 Additionally, alloying gold with a second metal can enhance such catalytic activity and of particular relevance is the synergistic partnership between gold and palladium which, in the form of alloyed nanoparticles, has displayed exceptional activity in the selective oxidation of alcohols2–4 and renewable polyols,6–10 or the green direct synthesis of hydrogen peroxide,5,11–14 and also for the selective oxidation of a primary C–H bond, such as in toluene.15,16The utilisation of glycerol as a platform chemical represents an opportunity to obtain value-added products from a highly functionalised and inexpensive raw material, and much research has recently been dedicated to finding new chemical pathways for this feedstock.17–19 Among the desired products, glycerol carbonate has excellent properties such as low toxicity, good biodegradability and a high boiling point which make it a very attractive chemical for a variety of applications, such as a solvent, an intermediate in organic synthesis20 and in the synthesis of polymers and surfactants.21–23 Recently, the synthesis of epichlorohydrin from glycerol carbonate has also been reported.24 The traditional routes for the synthesis of glycerol carbonate typically require the use of phosgene, which suffers from the drawback of being a dangerous and environmentally unfriendly reactant. The transesterification of glycerol can also be readily performed with acyclic organic carbonates.25,26 However, the carbonates utilised during the transesterification are also typically generated via phosgene utilisation or energy intensive routes employing epoxides. The direct reaction of glycerol with CO2 appears very attractive, but it has serious thermodynamic limitations.24,27 The synthesis of glycerol carbonate from glycerol has also been achieved using lipases in dimethyl carbonate28–30 and there have been recent studies of the biosynthetic production of glycerol carbonate as a by-product during biodiesel synthesis by reaction with dimethyl carbonate.31
The foregoing observations led us to consider urea as an alternative source for the carbonylation of glycerol. Overall, the reaction utilises two readily available reactants in a simple process that operates with high selectivity and yields (Scheme 1). The reaction is carried out in the absence of a solvent and the only significant by-product is ammonia in the gas-phase which can easily be captured. The reaction can proceed in the absence of a catalyst, but homogeneous catalysts such as ZnSO429 and MgSO4 have been found effective, and more recently some heterogeneous systems based on oxides have been reported.26,32–36 However, problems arising in the separation of the catalyst from the reaction mixture via the dissolution of the catalyst or formation of micropowders are significant drawbacks. Also, very large catalyst loadings have been required in previous studies to improve activity, which indicates that there is a large scope for increasing the catalytic activity. We recently reported a number of heterogeneous catalysts for this reaction, including vanadium phosphorous oxides37 and Zn or Ga supported on zeolites.38 We also explored the activity of gold nanoparticles due to their capability of acting as a Lewis acid and their known activity for glycerol oxidation2 and we found gold to be the best catalyst.39 An increase in conversion and a relative increase in reaction selectivity toward glycerol carbonate were observed with gold catalysts, especially those supported on magnesium and zinc oxides. We have recently described the activity of Au–Pd nanoparticles prepared by sol immobilisation for glycerol oxidation and related reactions.7,8,40–42 In this work, we first report the application of sol immobilisation to prepare gold catalysts for this reaction and explore the activity of the gold–palladium alloyed nanoparticles. We have now found that palladium and gold–palladium alloyed nanoparticles supported on magnesium oxide are yet more active and in this paper we describe the synthesis, characterisation and use of these highly active catalysts.
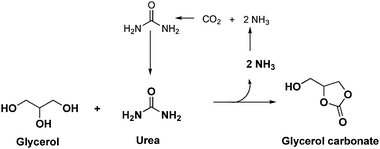 | ||
| Scheme 1 Reaction network for glycerol carbonate synthesis using urea as CO2 donor. | ||
Experimental
Catalyst synthesis
Bimetallic Au–Pd catalysts were prepared by first dissolving the Pd precursor (PdCl2, 0.083 g) in an aqueous solution of HAuCl4·3H2O (5.1 mL, 5 g dissolved in 250 mL) by vigorous stirring. The bimetallic solution was added dropwise with stirring to the support (1.95 g). The resulting material was dried (110 °C, 16 h) and part of the sample was calcined at the desired temperature (3 h, static air).
![[thin space (1/6-em)]](https://www.rsc.org/images/entities/char_2009.gif) 000 g mol−1, 80% hydrolysed) was added (PVA/Au (wt/wt) = 1.2). Subsequently, 0.1 M freshly prepared solution of NaBH4 (>96%, Aldrich, NaBH4/Au (mol/mol) = 5) was then added to form a dark-brown sol. After 30 min of sol generation, the colloid was immobilised by adding activated carbon (acidified to pH 1 by sulphuric acid) under vigorous stirring conditions. The amount of support material required was calculated so as to have a total final metal loading of 1 wt%. After 2 h the slurry was filtered and the catalyst washed thoroughly with distilled water The resulting material was dried (110 °C, 16 h) and part of the sample was calcined at the desired temperature (3 h, static air).
000 g mol−1, 80% hydrolysed) was added (PVA/Au (wt/wt) = 1.2). Subsequently, 0.1 M freshly prepared solution of NaBH4 (>96%, Aldrich, NaBH4/Au (mol/mol) = 5) was then added to form a dark-brown sol. After 30 min of sol generation, the colloid was immobilised by adding activated carbon (acidified to pH 1 by sulphuric acid) under vigorous stirring conditions. The amount of support material required was calculated so as to have a total final metal loading of 1 wt%. After 2 h the slurry was filtered and the catalyst washed thoroughly with distilled water The resulting material was dried (110 °C, 16 h) and part of the sample was calcined at the desired temperature (3 h, static air).
Catalyst characterisation
Powder X-ray diffraction (PXRD) was performed using a PANalytical X'PertPRO X-ray diffractometer, with a CuKα radiation source (40 kV and 40 mA). The diffraction patterns obtained were baseline corrected. X-ray photoelectron spectra were recorded on a Kratos Axis Ultra DLD spectrometer using a monochromatized AlKα X-ray source (100 W). Spectra were recorded at analyzer pass energies of either 160 eV (survey scans) or 40 eV (detailed scans). Binding energies are referenced to the C(1s) binding energy of adventitious carbon contamination, which is taken to be 284.7 eV.Samples for examination by transmission electron microscopy (TEM) and scanning transmission electron microscopy (STEM) were prepared by dispersing the dry catalyst powder onto a holey carbon film supported by a 300 mesh copper TEM grid. Samples were then subjected to bright field imaging experiments using a JEOL 2000FX TEM operating at 200 kV. High-angle annular dark field (HAADF) imaging experiments were carried out using a 200 kV JEOL 2200FS transmission electron microscope equipped with a CEOS aberration corrector.
Catalyst testing
Glycerol (typically 13.8 g, 0.15 mol) was added to a round bottom flask (100 mL) and treated at 150 °C under a flow of dry nitrogen for 20 minutes. The desired amount of urea (typically 13.5 g, 0.225 mol (molar ratio glycerol![[thin space (1/6-em)]](https://www.rsc.org/images/entities/char_2009.gif) :
:![[thin space (1/6-em)]](https://www.rsc.org/images/entities/char_2009.gif) urea 1
urea 1![[thin space (1/6-em)]](https://www.rsc.org/images/entities/char_2009.gif) :
:![[thin space (1/6-em)]](https://www.rsc.org/images/entities/char_2009.gif) 1.5)) was then added, and once dissolved, the catalyst (250 mg) was added and the resulting mixture stirred and heated to the required temperature. Dry nitrogen was passed through the reaction mixture in order to remove the NH3 formed. The reaction mixture was sampled periodically, and the samples obtained were diluted to 0.0375 M for analysis by HPLC. Samples of the final solution were also analysed using NMR spectroscopy and mass spectrometry (MS) analysis.
1.5)) was then added, and once dissolved, the catalyst (250 mg) was added and the resulting mixture stirred and heated to the required temperature. Dry nitrogen was passed through the reaction mixture in order to remove the NH3 formed. The reaction mixture was sampled periodically, and the samples obtained were diluted to 0.0375 M for analysis by HPLC. Samples of the final solution were also analysed using NMR spectroscopy and mass spectrometry (MS) analysis.
Analysis of products
NMR spectra were recorded at room temperature on a Bruker DPX 500 (13C 125.77 MHz) for dilute solutions. Chemical shifts are reported in parts per million relative to Me4Si. Spectra were referenced to the 13C resonance of the NMR solvent (CD3OD δ = 48.97 ppm). Mass spectrometry analyses were carried out on a Waters LCT Premier XE operating in APCI (+ve) mode. The reaction mixture was introduced into the MS source via a syringe pump at a rate of 10 μl min−1. FT-IR spectroscopy was performed by placing the neat reaction mixture between two NaCl plates, with the spectra recorded on a Jasco FT-IR660 Plus over a range of 4000–400 cm−1 at a resolution of 2 cm−1. Quantification of the reaction products was carried out on a Varian 920LC HPLC using ultraviolet and refractive index detectors. The eluent was an aqueous solution of H3PO4 (0.01 M) and the flow rate was 0.45 mL min−1. Samples of the reaction mixture were diluted using the eluent to a concentration of 0.0375 M. Reactants and products were separated using a Metacarb 67H column and the products identified by comparison with authentic samples. For quantitative analysis, an external standard method was used.Results and discussion
Catalytic activity
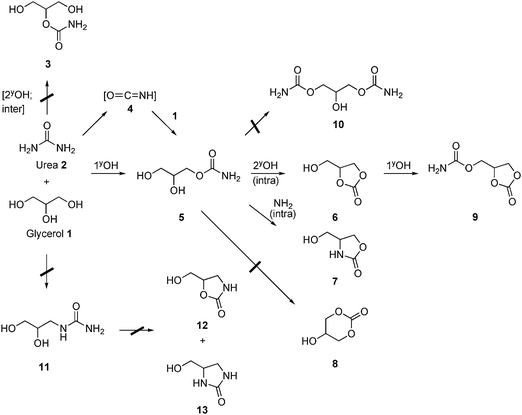
The possible reaction products are shown in Scheme 2. In the present study the reaction products observed were 2,3-dihydroxypropyl carbamate (5), glycerol carbonate (6), 4-(hydroxymethyl) oxazolidin-2-one (7) and (2-oxo-1,3-dioxolan-4-yl)methyl carbamate (9). The catalytic activity results are summarised in Table 1.| Entry | Catalyst | Prep. method | Temp. heat treatment/°C | Conv. (%) | Selectivity (%) | Glycerol carbonate yield (%) | |||
|---|---|---|---|---|---|---|---|---|---|
| Glycerol carbonate | 5 | 7 | 9 | ||||||
a Reaction conditions: glycerol/urea molar ratio: 1![[thin space (1/6-em)]](https://www.rsc.org/images/entities/char_2009.gif) : :![[thin space (1/6-em)]](https://www.rsc.org/images/entities/char_2009.gif) 1.5, temperature: 150 °C, catalyst: 0.25 g, time: 4 h. Product (5) = 2,3-dihydroxypropyl carbamate, product (7) = 4-(hydroxymethyl) oxazolidin-2-one, product (9) = (2-oxo-1,3-dioxolan-4-yl) methyl carbamate.
b Reaction conditions: glycerol/urea molar ratio: 4 1.5, temperature: 150 °C, catalyst: 0.25 g, time: 4 h. Product (5) = 2,3-dihydroxypropyl carbamate, product (7) = 4-(hydroxymethyl) oxazolidin-2-one, product (9) = (2-oxo-1,3-dioxolan-4-yl) methyl carbamate.
b Reaction conditions: glycerol/urea molar ratio: 4![[thin space (1/6-em)]](https://www.rsc.org/images/entities/char_2009.gif) : :![[thin space (1/6-em)]](https://www.rsc.org/images/entities/char_2009.gif) 1, temperature: 150 °C, catalyst: 0.25 g, time: 4 h. 1, temperature: 150 °C, catalyst: 0.25 g, time: 4 h.
|
|||||||||
| 1 | Blank | — | — | 59 | 36 | 44 | 7 | 14 | 21 |
| 2 | MgO | — | 200 | 84 | 57 | 20 | 8 | 15 | 48 |
| 3 | MgO | — | 400 | 69 | 37 | 37 | 11 | 16 | 26 |
| 4 | 2.5 wt% Au/MgO | IMP | 400 | 81 | 69 | 16 | 4 | 12 | 56 |
| 5 | 1 wt% Au/MgO | IMP | 400 | 83 | 69 | 15 | 4 | 12 | 57 |
| 6 | 1 wt% Au/MgO | IMP | 200 | 82 | 63 | 18 | 6 | 13 | 52 |
| 7 | 2.5 wt% Au/MgO | IMP | 200 | 69 | 68 | 20 | 4 | 8 | 47 |
| 8 | 1 wt% Au/MgO | SOL | 200 | 75 | 71 | 17 | 3 | 8 | 53 |
| 9 | 1 wt% Pd/MgO | SOL | 110 | 84 | 74 | 12 | 4 | 11 | 62 |
| 10 | 1 wt% Au/MgO | SOL | 110 | 75 | 61 | 21 | 5 | 13 | 46 |
| 11 | 1 wt% AuPd/MgO | SOL | 110 | 87 | 77 | 9 | 2 | 11 | 67 |
| 12 | 1 wt% AuPd/MgO | IMP | 110 | 86 | 64 | 15 | 6 | 15 | 55 |
| 13 | 1 wt% AuPd/MgOb | SOL | 110 | 28 | 93 | 7 | 0 | 0 | 26 |
| 14 | 1 wt% AuPd/MgO | SOL | 200 °C | 85 | 70 | 14 | 3 | 13 | 60 |
| 15 | 1 wt% AuPd/MgO | IMP | 200 °C | 86 | 67 | 14 | 4 | 15 | 57 |
| 16 | 1.0 wt% Pd/MgO | SOL | 200 °C | 88 | 71 | 12 | 4 | 14 | 63 |
Activity in the absence of a catalyst
It is important to note that the reaction can proceed without a catalyst and under our standard reaction conditions this results in 59% conversion, but only 36% selectivity to glycerol carbonate (yield = 21%; Table 1, entry 1). It is therefore apparent that the potential role of the catalyst is to direct the selectivity towards the required product, glycerol carbonate.Activity of the MgO support
Magnesium oxide also promoted the reaction, and this effect was greatly dependent on the thermal treatment of MgO prior to testing. When the magnesium oxide was calcined at 200 °C, it displayed a conversion of 84% with high selectivity to glycerol carbonate (57%) corresponding to a total yield of glycerol carbonate of 48% (entry 2). However, when the sample was calcined at 400 °C the conversion dropped to 69% and the selectivity to 37% (entry 3). Overall, the product distribution is not very different from the blank reaction, but higher yields of glycerol carbonate and compound 9 (Scheme 2) were obtained.Catalytic activity of supported gold
Use of a 1 wt% Au/MgO catalyst prepared by wet impregnation and calcined at 400 °C leads to an increase in conversion from 69 to 83%, but most importantly, the selectivity to glycerol carbonate is almost doubled, from 37 to 70% (see Table 1, entries 3–5). This effect on selectivity appears to arise from two factors: firstly, the catalyst converts more of intermediate 5 into glycerol carbonate 6, but also the reactions to form compound 7 and the subsequent reaction of glycerol carbonate 6 to give compound 9 are both decreased. Higher loadings of gold, up to 2.5 wt%, did not result in an increase in activity and both conversions and selectivities are practically unchanged (Table 1, entries 4 and 5). This could indicate that no additional metal active sites are created, at least when using this catalyst preparation method by increasing loading. It is well known that increasing metal loading by this impregnation method can lead to a poorer dispersion, which in turn could result in the formation of larger metal nanoparticles at the expense of smaller, more active clusters.Effect of calcination on catalytic activity of the support and catalyst
One might expect that calcination at higher temperature would increase the mean diameter of the gold nanoparticles and hence lower calcination temperatures should be preferred. However, when the 1 wt% Au/MgO catalyst prepared by impregnation was calcined at 200 °C, its activity remained almost unchanged with respect to the catalyst calcined at 400 °C (Table 1, entries 5 and 6); only a minor decrease in selectivity is observed coupled with an increase in the formation of compound 5. This contrasts with the higher loading sample, 2.5 wt% Au/MgO, where conversion increased from 69 to 81% after increasing the calcination temperature from 200 to 400 °C (see entries 7 and 4 respectively). It is clear that the catalytic activity is influenced by more than one variable, and it must be kept in mind that the support has intrinsic activity.Characterisation of the magnesia-supported Au catalysts
We performed electron microscopy studies to study the morphology of both the nanoparticles and the support. Fig. 1 shows some representative BF-TEM ((a), (b)) and HAADF STEM ((c), (d)) micrographs of the fresh 2.5 wt% Au/MgO catalyst prepared by impregnation and calcined at 200 °C. It was found that three distinct Au species, namely (i) very occasional 5–20 nm Au particles, (ii) some finely dispersed isolated Au atoms and (iii) numerous 1–2 nm raft-like epitaxial Au clusters, co-existed on this sample. Representative HAADF images of these Au rafts along three different viewing projections (i.e. [001], [110], and [111]) are shown in Fig. 2. The orientation relationship noted between the Au raft and MgO support was (100)Au//(100)MgO and [001]Au//[001]MgO in which units cells are oriented in a parallel manner and the 5% lattice mismatch is accommodated by an expansion of the Au overlayer. The 1–2 nm Au clusters were by far the dominant feature (Fig. 1(c) and (d)) at this relatively low calcination temperature.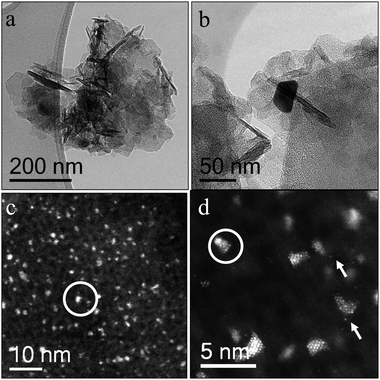 | ||
| Fig. 1 Representative electron micrographs of the 2.5 wt% Au/MgO sample calcined at 200 °C. The BF-TEM images in (a) and (b) show the flake-like character of the MgO support and a large Au particle respectively. The HAADF-STEM images in (c) and (d) predominantly show 1–2 nm epitaxial Au rafts (circled in white), along with a few isolated Au atoms (white arrows). | ||
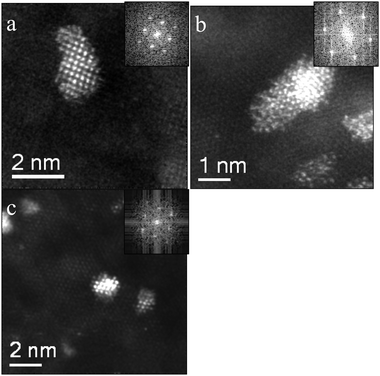 | ||
| Fig. 2 STEM-HAADF micrographs and (inset) corresponding Fast Fourier Transform (FFT) patterns showing epitaxial growth of Au on (a) (100) MgO, (b) (111) MgO and (c) (110) MgO surfaces. In each case, parallel epitaxy between the unit cells of the overlayer and support was maintained. | ||
When the 2.5 wt% Au/MgO catalyst was calcined at 400 °C, the same three Au species were observed, but with markedly different population densities (Fig. 3). The number of larger Au particles increased dramatically (Fig. 3(a)), whereas the number densities of the isolated Au atoms (Fig. 3(b)) and 1–2 nm clusters dramatically decreased. These differences in catalyst morphology may be responsible for the different catalytic activities, suggesting that the 1–2 nm Au clusters are less active than the isolated atoms.
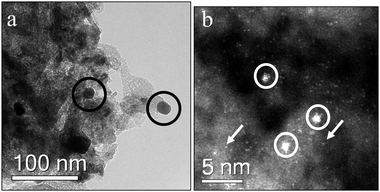 | ||
| Fig. 3 Representative BF-TEM (a) showing Au nanoparticles (circled in black) and STEM-HAADF images (b) showing 1–2 nm Au clusters (circled in white) and isolated atoms (white arrows) of the unused 2.5 wt% Au/MgO sample calcined at 400 °C. | ||
To study the effect of Au loading, a 1 wt% Au/MgO catalyst sample was also prepared by impregnation and calcined at 200 °C and 400 °C. In this case, its activity remained almost unchanged compared with the 2.5 wt% Au catalyst calcined at 400 °C. Representative STEM-HAADF micrographs of these two samples are shown in Fig. 4(a) and (b) respectively. As expected, the overall population density of the Au species was diminished due to the lower nominal Au loading. Interestingly, the 1 wt% Au/MgO catalyst, calcined at 200 °C (Fig. 4(a)), was essentially undistinguishable from the material calcined at 400 °C (Fig. 4(b)) and is consistent with the fact that these display similar catalytic activities. However, the 1 wt% Au/MgO catalyst calcined at 400 °C (Fig. 4(b)) seemed to have a much greater fraction of Au clusters than its 2.5 wt% Au/MgO counterpart (Fig. 3(b)) and both display identical catalytic results.
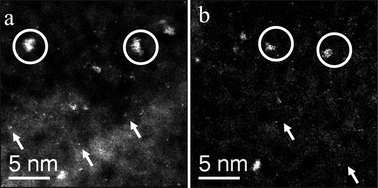 | ||
| Fig. 4 STEM-HAADF images of 1.0 wt% Au/MgO calcined at (a) 200 °C and (b) 400°C. Similar population densities of 1–2 nm Au clusters (circled in white) and isolated atoms (white arrows) were found in both samples, making them virtually indistinguishable from each other. | ||
Overall, it is difficult to ascribe the effect of the calcination temperature to a single event, particularly as we have previously described that the activity of MgO is significantly affected by calcination (entries 2 and 3). We can, however, conclude that the selectivity to glycerol carbonate always increases by doping MgO with gold.
The samples prepared by impregnation were also analysed by XPS in order to characterize surface loadings and gold oxidation state. As shown in Fig. 8(a), there is severe overlap between the Au(4f) doublet and the Mg(2s) peak which dominates this spectral region; only the Au(4f7/2) component is clearly discernible. We also note that the Au(4f7/2) intensity for the 1 wt% Au samples prepared by impregnation is insignificant; this is emphasized in Fig. 8(b) where the vertical scale is expanded. A weak feature is seen for the much higher loading (2.5 wt% Au catalyst). In contrast, the 1 wt% Au samples prepared by sol immobilization (see below) show relatively intense Au(4f7/2) peaks. Since preparation by impregnation does not involve a washing step, the gold must be on the catalyst, but not accessible to XPS. This could be due to the presence of relatively few very large Au particles, which does not agree with the microscopy data, or due to the location of the majority of the gold in the pores of the catalyst.
Characterisation of the magnesia-supported Au catalyst after reaction
Previously, we have reported38 the electron HAADF images corresponding to the 2.5 wt% Au/MgO catalyst calcined at 400 °C, however, we were unable to acquire the corresponding electron HAADF images from the used 2.5 wt% Au/MgO sample material as the support had become extremely beam sensitive and was damaged rapidly under the electron probe. We have investigated this aspect further. Initially, we considered that some residual organic material from the reaction could be causing this beam sensitivity and followed two approaches to try to remove this. Firstly, we tried to extract any residues by first refluxing the catalysts in water for 3 h with stirring and drying at room temperature before calcination at 200 °C in static air for 3 h. However, the same problem arose under the microscope. No improvements in beam sensitivity were observed when the catalyst was calcined at 400 °C in static air. We had to conclude that adsorbed organic moieties were not responsible for the beam sensitivity but that it could be due to changes in the actual support. From XRD analysis (Fig. 5), we can see that the support material has changed from the MgO structure before use to a different phase after use. However it was not possible to definitively determine the identity of the final structure from the XRD information alone, since there were few characteristic peaks and, at small 2θ angles, the signal to background ratio is very low.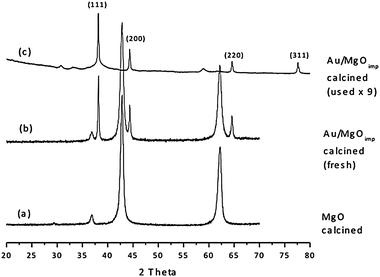 | ||
| Fig. 5 XRD spectra obtained from the 2.5 wt% Au/MgO (calcined at 400 °C) catalyst (b) before use and (c) after use. The XRD trace from a standard MgO material is also shown in (a) for comparative purposes. | ||
We had difficulty acquiring STEM HAADF images of the gold species present in the used 2.5 wt% Au/MgO (400 °C calcined) catalyst, as the support was extremely beam sensitive under the electron probe. The sample was therefore examined under low dose TEM imaging conditions and we were able to intentionally trigger the support phase transformation by focusing the electron beam down to a smaller spot on the particle. It is clear that the morphology of the support changes during the electron beam irradiation (Fig. 6(a) and (b)), and that, in extreme cases, caused holes to be drilled in the support. The final product of this electron beam induced transformation is nanocrystalline MgO (Fig. 6(c), (d) and (f)). This implies that exposure of the catalyst to the reactants causes a conversion of the support into a different phase [as evidenced by XRD (Fig. 5) and electron diffraction (Fig. 6(e)]. A radial intensity distribution profile (Fig. 6(g)) of the rather spotty polycrystalline ring pattern shown in Fig. 6(e), and the XRD data (Fig. 5) was compared to a database of magnesia compounds containing hydroxyl and carbonate species. The experimentally determined interplanar spacings matched best the nesquehonite (Mg(CO3)·3H2O) structure, as shown in Table 2.
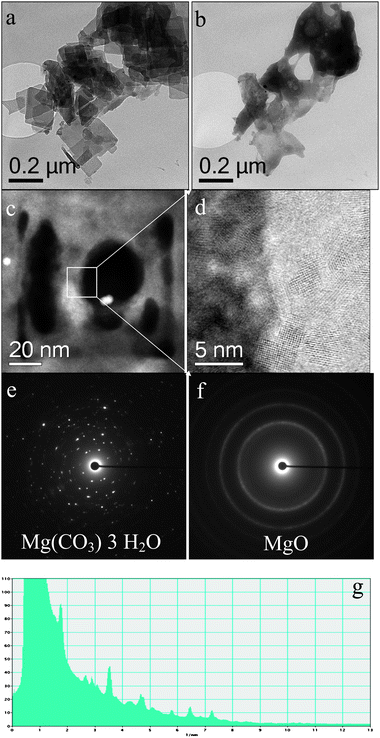 | ||
| Fig. 6 BF-TEM micrographs ((a), (b)) obtained from the used 2.5 wt% Au/MgO material that had been calcined at 400 °C: (a) was obtained before and (b) after a prolonged electron beam irradiation; ((c), (d)) show HAADF images of the damaged sample after e-beam irradiation showing the generation of nanocrystalline MgO; selected area diffraction patterns ((e), (f)) obtained before and after irradiation; (g) radial diffraction profile derived from the SADP shown in (e). The morphology and crystal structure changes from nesquehonite (Mg(CO3)·3H2O) to the MgO structure after the electron beam irradiation treatment. | ||
| Interplanar spacings (Å) | ||||||||||||
|---|---|---|---|---|---|---|---|---|---|---|---|---|
| Experimental | ||||||||||||
| TEM-SADP | 6.5 | 5.9 | 4.2 | 3.9 | 3.5 | 3.3 | 2.9 | |||||
| XRD | 5.82 | 2.91 | 2.71 | 1.57 | 1.51 | |||||||
| PDF card | ||||||||||||
| Mg(CO3)·3H2O | 6.48 | 6.07 | 4.91 | 4.40 | 4.14 | 3.85 | 3.59/3.57 | 3.26/3.24/3.23 | 3.03/2.98/2.97 | |||
| X-ray intensity (%) | 100 | 2 | 12 | 2 | 4 | 75 | 8/6 | 2/2/20 | 30/6/4 | |||
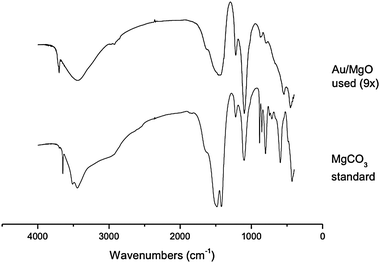 | ||
| Fig. 7 IR spectra of Au/MgO after 9× uses, and MgCO3 standard. Pellets were formed from 4 mg of the sample and 100 mg of KBr and pressed at 6 tons. Samples were analysed on a Jasco 5500 FT-IR spectrometer at 2 cm−1 resolution, with 64 scans performed on each sample. | ||
IR spectra of the Au/MgO catalyst recovered after nine uses are compared with a MgCO3 standard in Fig. 7; significant carbonate stretches are observed in the material after use, with bands at ∼3500 cm−1, ∼1500 cm−1 and 1100 cm−1. Furthermore, the used sample has more amorphous character than the crystalline standard. This can be observed by the lack of clear vibrational stretches in the fingerprint region of the used sample (<1000 cm−1), and the broadened stretches observed in the hydroxyl- and carbonate-region.
Effect of the preparation method on catalytic activity
The complexity of the parameters discussed above increases if one considers that the wet impregnation method produces a wide range of gold species (metallic and cationic) and nanoparticles (ranging from 1 to 30 nm in diameter) as well as monoatomic gold and smaller clusters. As a consequence, gold catalysts were prepared using a sol immobilisation preparation method.12,43 This methodology allows the synthesis of well defined gold nanoparticles of a narrow size distribution and their immobilisation onto an oxide support with minimal particle size increase. These gold nanoparticles can be supported on MgO to give a more homogenous catalyst and exclude the formation of other gold species.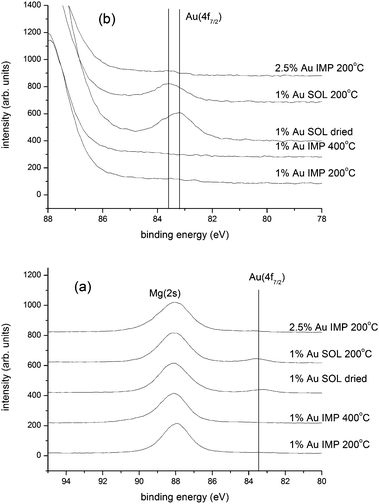 | ||
| Fig. 8 XPS analysis of Au/MgO catalysts prepared by impregnation (IMP) and sol immobilisation (SOL), and heat treated as indicated. Set (a) shows the data scaled to show the Mg(2s) peaks, whereas in set (b) the vertical scale has been expanded to emphasise the Au(4f7/2) component. | ||
The preparation method has a major effect on the gold catalyst morphology and its activity is shown in Table 1. In particular, a 1 wt% Au/MgO catalyst prepared by sol immobilisation and calcined at 200 °C displayed higher selectivity (entry 8) than the analogous catalyst prepared by wet impregnation (entry 6). This increase seems to appear from a reduction in the consecutive reaction of the glycerol carbonate to compound 9, and also a slight decrease in the formation of compound 7. Overall, there is not a significant increase in glycerol carbonate yield because there is a small decrease in glycerol conversion. This decrease in conversion is surprising, and also obvious when these data are contrasted with the activity of the MgO alone (entry 2). Detailed microscopy analysis did however indicate that the gold present is very well dispersed in the form of small nanoparticles. Fig. 9 shows representative STEM HAADF images of the 1.0 wt% Au/MgO catalyst prepared via the sol immobilization route. Au particles having sizes in the 2–5 nm range size were homogenously distributed on the flake-like MgO support. As expected no isolated Au atoms or 1–2 nm epitaxial Au rafts were found in this sample. This observation could indicate that the smaller clusters observed in the impregnated catalysts are more active than the 2–5 nm particles produced by sol immobilisation, but also that some residual PVA blocks some of the active/unselective sites in the support and metal, as PVA has been reported to have a detrimental effect on several reactions using gold catalysts.41 Overall, the sol catalysts supported on MgO can give high glycerol carbonate yields and we conclude that the promotional effect of gold can be achieved by using gold nanoparticles but it is also possible that smaller clusters of gold might give rise to higher activity.
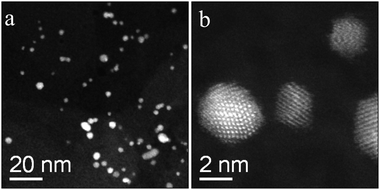 | ||
| Fig. 9 Representative STEM-HAADF images of the sol immobilized 1.0 wt% Au/MgO sample that had been calcined at 200 °C. | ||
XPS analysis of the 1 wt% Au samples prepared by sol immobilization is shown in Fig. 8. As noted earlier, clear Au(4f7/2) components are seen for the dried and calcined (200 °C) sol-immobilised catalysts. The Au(4f7/2) binding energy from the dried sol-immobilised sample is lower than expected – the Au(4f7/2) binding energy for bulk gold is 84.0 eV, and gold nanoparticles usually exhibit higher binding energies. The observation of a negative chemical shift is consistent with a negative charge on the gold particles, or is possibly linked to the presence of ligands and final state relaxation effects. After heating the sol-immobilised sample to 200 °C (Fig. 8), the Au peak shifts to higher binding energy as the ligands are removed and/or sintering occurs. The observed reduction in the intensity of the Au(4f7/2) peak is consistent with some sintering taking place.
Gold–palladium catalysts
We have previously reported that a synergistic effect can be observed when combining gold and palladium together as catalysts for a number of reactions,2,4,15 and hence this possibility has been investigated for this reaction. We prepared a number of gold–palladium catalysts using the sol immobilisation methodology and dried these at 110 °C overnight instead of calcining at higher temperatures, in order to retain the small particle size. Firstly, we examined the catalytic activity of a 1 wt% Pd/MgO catalyst (entry 9) and observed that it was more active and selective than the analogous gold catalyst (entry 10). The 1 wt% Pd/MgO catalyst achieved a conversion of 84% and a glycerol carbonate yield of 62%. This is again due to a higher activity and higher selectivity due to reducing the other parallel and consecutive reactions. 1 wt% AuPd/MgO (entry 11) displays slightly higher activity and selectivity compared with both monometallic catalysts (compare entry 11 to entries 10 and 9). Hence it is apparent that for this reaction there is not a very strong synergistic interaction between gold and palladium, but a small enhancement is observed. For comparison, we synthesised a 1 wt% AuPd/MgO catalyst by the impregnation method (dried only; entry 12). As in the case of the monometallic catalyst, sol immobilisation affords higher glycerol carbonate yields (67%) than the analogous impregnated catalyst (55%) due to its superior selectivity to glycerol carbonate (77%). Furthermore, the two catalysts achieved the same conversion (87%), so that the advantage of the sol immobilisation is purely due to higher selectivity, which is due to reduction in the consecutive reaction of the glycerol carbonate formed, but also to diminished formation of compound 7. The higher selectivity to glycerol carbonate with respect to compound 5 can be interpreted on the basis of a higher activity of the catalyst in the cyclisation of compound 5, which we have previously suggested as the main role of the gold catalyst.38Characterisation of the magnesia-supported Au–Pd catalysts
Fig. 10 and 11 show electron microscopy data obtained from the Au–Pd catalyst supported on MgO prepared by sol-immobilization and dried at 110 °C and calcined at 200 °C, respectively. In both cases, the metallic particles were homogeneously dispersed on the flake-like MgO support (see Fig. 10(a),(b) and 11(a),(b)). The corresponding particle size distributions presented in Fig. 10(c) and 11(c) show that the mean Au–Pd particle size increases slightly from 4.4 to 4.8 nm upon calcining the 110 °C dried sample at 200 °C for 3 h. XEDS analysis (Fig. 10(d) and 11(d)) showed that in both cases the metallic particles are random AuPd alloys. Furthermore, no significant segregation and alloy ordering effects were found by STEM-HAADF imaging. The trend in catalytic data shown in Table 1 indicates that the AuPd/MgO samples subjected to calcination at 200 °C became more active than the 110 °C dried-only samples, despite this slight increase in particle size and corresponding drop in exposed metal surface area. This suggests that other parameters, such as improved accessibility due to a greater extent of PVA ligand removal,41 or a subtle decrease in the degree of support hydroxylation at higher calcination temperature, may also be important factors in determining catalytic activity of these sol-immobilized AuPd/MgO materials. We attempted XPS analysis of the Au–Pd/MgO catalysts, but the Pd(3d) region was dominated by intense Mg Auger peaks, which combined with the Mg(2s)/Au(4f) overlap made it impossible to come to any meaningful conclusions.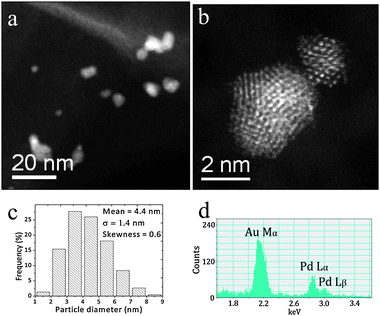 | ||
| Fig. 10 ((a),(b)) Representative STEM HAADF micrographs, (c) the particle size distribution and (d) an XEDS spectrum of an individual metal particle in the 1 wt% AuPd/MgO sample prepared by sol-immobilization and dried at 110 °C. | ||
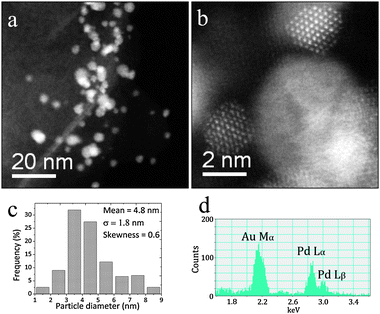 | ||
| Fig. 11 ((a),(b)) Representative STEM HAADF micrographs, (c) the particle size distribution and (d) an XEDS spectrum of an individual metal particle in the 1 wt% AuPd/MgO sample prepared by sol-immobilization and calcined at 200 °C. | ||
Time online analysis and comments on the reaction mechanism
Despite the apparent simplicity of the reaction of glycerol with urea, this reaction can take a number of pathways (Scheme 2). It is also possible that the reaction products undergo inter-conversions not described in Scheme 2, such as the decomposition of some of the products and intermediates, and this adds complexity to the interpretation of the reaction and mechanistic details. Fig. 12 shows the product distribution for an extended reaction time of 6 h for the 1 wt% AuPd/MgO catalyst prepared by impregnation. The conversion increases very rapidly up to 80%; initially, formation of large amounts of 2,3-dihydroxypropyl carbamate 5 occurs which quickly decreases in favour of glycerol carbonate, suggesting that compound 5 is formed in the first step and is the primary product of the reaction and intermediate to the formation of glycerol carbonate. Compounds 7 and 9 were also detected in small amounts; however, selectivities towards these products decrease after 1 h online for compound 7 and after 2 h for compound 9. On the other hand, the selectivity to glycerol carbonate increases with conversion over the range of time studied. The reaction profile (Fig. 12) indicates that after 3 h 80% of glycerol has been converted, but this does not increase for any longer times up to six hours. We initially considered that the catalyst deactivation could be due to poisoning by the formation of oligomers or other strongly adsorbed compounds, but re-usability studies indicated that the catalyst was still fully active.38 An alternative explanation is that the reaction is carried out in pure glycerol and that glycerol is the limiting reagent as the reaction progresses, the decreasing concentration of glycerol will affect the kinetics of the reaction. However, this observation alone would not explain why the conversion does not continue to slowly increase above 80%, even 3 h after achieving a maximum. We have studied the stability of glycerol carbonate and we have observed that under the standard reaction conditions, glycerol carbonate can reform glycerol, and thereby giving the false impression that the activity has stalled.38 However, the glycerol carbonate selectivity continues to increase as the concentration of intermediate 5 decreases. Another reason for the levelling off of the glycerol conversion is the dilution of urea as the reaction progresses, together with the reaction leading to compound 9. The formation of the latter from glycerol carbonate requires the reaction of a second urea molecule and, therefore, decreases the concentration of urea available for reaction with glycerol. The above experiments were performed under conditions that allow facile comparison of catalyst performance and not for optimisation of final product composition. However, the reactions at long reaction times suggest that a product mixture in excess of 90% glycerol carbonate can be readily achieved with an overall composition similar to that of commertial glycerol carbonate (Jeffsol®Glycerine Carbonate http://www.huntsman.com).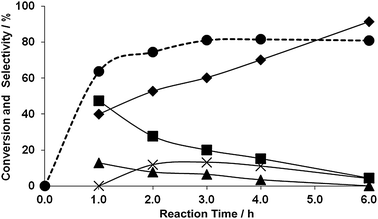 | ||
Fig. 12 Time online analysis for 1 wt% AuPd/MgO prepared by sol-immobilisation (dried) in the reaction of glycerol with urea. Reaction conditions: glycerol/urea molar ratio: 1![[thin space (1/6-em)]](https://www.rsc.org/images/entities/char_2009.gif) : :![[thin space (1/6-em)]](https://www.rsc.org/images/entities/char_2009.gif) 1.5, temperature: 150 °C, catalyst: 0.25 g, reaction time: 6 h. Key: ● glycerol conversion, ◆ selectivity to glycerol carbonate (6), ■ selectivity to 2,3-dihydroxypropyl carbamate (5), ▲ selectivity to 4-(hydroxymethyl) oxazolidin-2-one (7), × selectivity to (2-oxo-1,3-dioxolan-4-yl) methyl carbamate (9). 1.5, temperature: 150 °C, catalyst: 0.25 g, reaction time: 6 h. Key: ● glycerol conversion, ◆ selectivity to glycerol carbonate (6), ■ selectivity to 2,3-dihydroxypropyl carbamate (5), ▲ selectivity to 4-(hydroxymethyl) oxazolidin-2-one (7), × selectivity to (2-oxo-1,3-dioxolan-4-yl) methyl carbamate (9). | ||
Until now we have utilised glycerol as the limiting reagent. Considering that the reaction is solvent free, this fact alone greatly limits the selectivity of the reaction at high conversions. In order to identify reaction conditions that result in a higher selectivity to glycerol carbonate, we performed the reaction using a ratio of glycerol to urea of 4![[thin space (1/6-em)]](https://www.rsc.org/images/entities/char_2009.gif) :
:![[thin space (1/6-em)]](https://www.rsc.org/images/entities/char_2009.gif) 1. Urea conversion, rather than glycerol conversion, has been utilised by other authors for this reaction33 and, under these conditions, urea conversion is indeed 100%. The selectivity to glycerol carbonate is 93% (entry 13, Table 1). The only other product found was the intermediate 5. This implies that this reaction can be optimised very easily to either very high selectivity to the cyclic carbonate with 100% conversion of urea or very high conversions of glycerol at the expense of the formation of sequential product 9.
1. Urea conversion, rather than glycerol conversion, has been utilised by other authors for this reaction33 and, under these conditions, urea conversion is indeed 100%. The selectivity to glycerol carbonate is 93% (entry 13, Table 1). The only other product found was the intermediate 5. This implies that this reaction can be optimised very easily to either very high selectivity to the cyclic carbonate with 100% conversion of urea or very high conversions of glycerol at the expense of the formation of sequential product 9.
We consider that the first step of the reaction is uncatalysed and is facile, as we find no evidence of competition with the other possible reaction pathways under our reaction conditions and 3, 4 or 11 are not observed in this study or by others.26,33 It is however possible that compound 4 is produced and leads to compound 5 and it is too reactive to be observed. Under the conditions studied here, the hydroxyl groups in glycerol may act as nucleophiles, eliminating ammonia, and this is supported by the observation that 5, 6 and 9 are the only significant products. All of the observed products are the result of a nucleophilic attack of a hydroxyl group on the electrophilic carbon in the carbonyl group of a urea or a urea residue. Our data suggest that the second step of the reaction determines selectivity, and this is precisely where the catalysts play a key role. In this second step, 2,3-dihydroxypropyl carbamate 5 can form a number of possible products, but we only observe a few. In particular, the catalyst is more selective to glycerol carbonate, again by hydroxyl attack onto a carbonyl group, than to 4-(hydroxymethyl)oxazolidin-2-one 7, the 6-ring carbonate 8 or the insertion of a second urea into the primary OH group of the primary product 3.
There have been a number of papers reporting gold to be a very good Lewis acid catalyst for organic reactions, and most recently gold salts and complexes have been reported to be excellent Lewis acids for the formation of cyclic acetals from glycerol.44 For the reaction of glycerol with urea, a combination of Lewis basicity and acidity26 has been proposed as an explanation for catalytic activity, and we believe that this is also the role played by our catalytic systems comprising of gold and palladium well dispersed on MgO. We consider that the main effect of the catalyst is the promotion of the intramolecular reaction of the 2,3-dihydroxypropyl carbamate 5 to give glycerol carbonate 6, which is a very effective candidate for Lewis acid catalysis. Gold/palladium might coordinate to the carbonyl group of the reaction intermediate 5 and facilitate the nucleophilic attack by the secondary hydroxyl group on the electrophilic carbon. The amine leaving group would then accept the proton from the hydroxyl which releases ammonia and forces the closure of the ring as a carbonate. Rapid removal of ammonia by the gas stream effectively renders this step irreversible. The metal centre enhances selectivity by absorption of 5 to favour the desired intermolecular interaction that yields glycerol carbonate to the detriment of other unselective or consecutive reactions. Overall, the cyclisation chemistry proposed is reasonable and arguably is expected. By far the most predominant pathway features the attack of alcohol (hydroxy) nucleophiles onto the carbonyl carbon of a urea or carbamate functionality. This can involve both primary and secondary alcohols (e.g.6), in preference to the reaction of the less nucleophilic amino groups, all of these being deactivated by reason of their attachment to a carbonyl group. Clearly, the regiochemistry amongst the hydroxyl groups, where relevant, such as is the case of glycerol itself, is controlled by steric hindrance, meaning that the relatively less nucleophilic primary hydroxyl functional group reacts significantly more rapidly. The cyclisations also follow Baldwin's rules: the major products arise via the particularly favoured 5-exo-trig pathway, which competes successfully with a 6-exo-trig mechanism, which leads to the much smaller amounts of six-membered ring products. Presumably, all the observed cyclisations are triggered by Lewis acid complexation with the carbonyl oxygen.
The role of the support is difficult to separate from the effect of the metal, particularly as both are active for this reaction and we must therefore consider our catalytic system as a bifunctional catalyst. What appears evident is that the combination of gold–palladium in the alloyed nanoparticles confers the highest activity for this reaction. Furthermore, the sol immobilisation technique ensures that the metal is well dispersed in the form of nanoparticles and no other morphologies such as monoatomic metal or small clusters are present. This leaves us with the conclusion that the metal nanoparticles on MgO can also promote this reaction and not only cationic, monoatomic or small clusters of gold.
Conclusions
Gold and palladium nanoparticles supported on magnesium oxide have been found to be effective catalysts to promote the formation of glycerol carbonate from urea and glycerol. Catalysts with a combination of gold and palladium result in the most active catalysts, but the synergistic effect observed is not pronounced and monometallic palladium catalysts can be highly effective. High dispersions of the active metals were achieved by using both sol immobilisation and impregnation. The type of heat pretreatment was found to be critical in determining catalyst activity. We have found that the magnesium oxide undergoes transformations upon reaction and in particular, the support partly transformed into magnesium carbonate although little effect on activity was observed.Acknowledgements
We thank the EPSRC for financial support (EP/H007679/1).References
- V. Polshettiwar and R. S. Varma, Green Chem., 2010, 12, 743 RSC.
- N. Dimitratos, J. A. Lopez-Sanchez and G. J. Hutchings, Chem. Sci., 2012, 3, 20 RSC.
- A. S. K. Hashmi and G. J. Hutchings, Angew. Chem., Int. Ed., 2006, 45, 7896–7936 CrossRef.
- D. I. Enache, J. K. Edwards, P. Landon, B. Solsona-Espriu, A. F. Carley, A. A. Herzing, M. Watanabe, C. J. Kiely, D. W. Knight and G. J. Hutchings, Science, 2006, 311, 362–365 CrossRef CAS.
- J. Pritchard, L. Kesavan, M. Piccinini, Q. A. He, R. Tiruvalam, N. Dimitratos, J. A. Lopez-Sanchez, A. F. Carley, J. K. Edwards, C. J. Kiely and G. J. Hutchings, Langmuir, 2010, 26, 16568–16577 CrossRef CAS.
- N. Dimitratos, J. A. Lopez-Sanchez, D. Lennon, F. Porta, L. Prati and A. Villa, Catal. Lett., 2006, 108, 147–153 CrossRef CAS.
- N. Dimitratos, J. A. Lopez-Sanchez, J. M. Anthonykutty, G. Brett, A. F. Carley, R. C. Tiruvalam, A. A. Herzing, C. J. Kiely, D. W. Knight and G. J. Hutchings, Phys. Chem. Chem. Phys., 2009, 11, 4952–4961 RSC.
- N. Dimitratos, J. A. Lopez-Sanchez, S. Meenakshisundaram, J. M. Anthonykutty, G. Brett, A. F. Carley, S. H. Taylor, D. W. Knight and G. J. Hutchings, Green Chem., 2009, 11, 1209–1216 RSC.
- A. Villa, N. Janjic, P. Spontoni, D. Wang, D. S. Su and L. Prati, Appl. Catal., A, 2009, 364, 221–228 CrossRef CAS.
- D. Wang, A. Villa, P. Spontoni, D. S. Su and L. Prati, Chem.–Eur. J., 2010, 16, 10007–10013 CrossRef CAS.
- J. K. Edwards and G. J. Hutchings, Angew. Chem., Int. Ed., 2008, 47, 9192–9198 CrossRef CAS.
- J. A. Lopez-Sanchez, N. Dimitratos, P. Miedziak, E. Ntainjua, J. K. Edwards, D. Morgan, A. F. Carley, R. Tiruvalam, C. J. Kiely and G. J. Hutchings, Phys. Chem. Chem. Phys., 2008, 10, 1921–1930 RSC.
- N. N. Edwin, J. K. Edwards, A. F. Carley, J. A. Lopez-Sanchez, J. A. Moulijn, A. A. Herzing, C. J. Kiely and G. J. Hutchings, Green Chem., 2008, 10, 1162–1169 RSC.
- J. A. Lopez-Sanchez, N. Dimitratos, N. Glanville, L. Kesavan, C. Hammond, J. K. Edwards, A. F. Carley, C. J. Kiely and G. J. Hutchings, Appl. Catal., A, 2011, 391, 400–406 CrossRef CAS.
- L. Kesavan, R. Tiruvalam, M. H. A. Rahim, M. I. bin Saiman, D. I. Enache, R. L. Jenkins, N. Dimitratos, J. A. Lopez-Sanchez, S. H. Taylor, D. W. Knight, C. J. Kiely and G. J. Hutchings, Science, 2011, 331, 195–199 CrossRef CAS.
- M. I. bin Saiman, G. L. Brett, R. Tiruvalam, M. M. Forde, K. Sharples, A. Thetford, R. L. Jenkins, N. Dimitratos, J. A. Lopez-Sanchez, D. M. Murphy, D. Bethell, D. J. Willock, S. H. Taylor, D. W. Knight, C. J. Kiely and G. J. Hutchings, Angew. Chem., Int. Ed., 2012, 51, 5981–5985 CrossRef CAS.
- C. H. C. Zhou, J. N. Beltramini, Y. X. Fan and G. Q. M. Lu, Chem. Soc. Rev., 2008, 37, 527–549 RSC.
- N. Dimitratos, J. A. Lopez-Sanchez and G. J. Hutchings, Top. Catal., 2009, 52, 258–268 CrossRef CAS.
- M. Pagliaro, R. Ciriminna, H. Kimura, M. Rossi and C. Della Pina, Angew. Chem., Int. Ed., 2007, 46, 4434–4440 CrossRef CAS.
- A. C. Simao, B. Lynikaite-Pukleviciene, C. Rousseau, A. Tatibouet, S. Cassel, A. Sackus, A. P. Rauter and P. Rollin, Lett. Org. Chem., 2006, 3, 744–748 CrossRef CAS.
- G. Rokicki, P. Rakoczy, P. Parzuchowski and M. Sobiecki, Green Chem., 2005, 7, 529–539 RSC.
- H. J. Mei, Z. L. Zhong, F. F. Long and R. X. Zhuo, Macromol. Rapid Commun., 2006, 27, 1894–1899 CrossRef CAS.
- L. Ubaghs, N. Fricke, H. Keul and H. Hocker, Macromol. Rapid Commun., 2004, 25, 517–521 CrossRef CAS.
- A. Dibenedetto, A. Angelini, M. Aresta, J. Ethiraj, C. Fragale and F. Nocito, Tetrahedron, 2011, 67, 1308–1313 CrossRef CAS.
- J. R. Ochoa-Gomez, O. Gomez-Jimenez-Aberasturi, B. Maestro-Madurga, A. Pesquera-Rodriguez, C. Ramirez-Lopez, L. Lorenzo-Ibarreta, J. Torrecilla-Soria and M. C. Villaran-Velasco, Appl. Catal., A, 2009, 366, 315–324 CrossRef CAS.
- M. J. Climent, A. Corma, P. De Frutos, S. Iborra, M. Noy, A. Velty and P. Concepcion, J. Catal., 2010, 269, 140–149 CrossRef CAS.
- J. B. Li and T. Wang, J. Chem. Thermodyn., 2011, 43, 731–736 CrossRef CAS.
- K. H. Lee, C. H. Park and E. Y. Lee, Bioprocess Biosyst. Eng., 2010, 33, 1059–1065 CrossRef CAS.
- S. C. Kim, Y. H. Kim, H. Lee, D. Y. Yoon and B. K. Song, J. Mol. Catal. B: Enzym., 2007, 49, 75–78 CrossRef CAS.
- S. H. Pyo, P. Persson, S. Lundmark and R. Hatti-Kaul, Green Chem., 2011, 13, 976–982 RSC.
- P. J. Seong, B. W. Jeon, M. Lee, D. H. Cho, D. K. Kim, K. S. Jung, S. W. Kim, S. O. Han, Y. H. Kim and C. Park, Enzyme Microb. Technol., 2011, 48, 505–509 CrossRef CAS.
- J. W. Yoo and Z. Mouloungui, Nanotechnologyin Mesostruct. Mat., ed. S. E. Park, R. Ryoo, W. S. Ahn, C. W. Lee and J. S. Chang, 2003, vol. 146, pp. 757–760 Search PubMed.
- M. Aresta, A. Dibenedetto, F. Nocito and C. Ferragina, J. Catal., 2009, 268, 106–114 CrossRef CAS.
- Q. B. Li, W. Y. Zhang, N. Zhao, W. Wei and Y. H. Sun, Catal. Today, 2006, 115, 111–116 CrossRef CAS.
- F. Rubio-Marcos, V. Calvino-Casilda, M. A. Banares and J. F. Fernandez, J. Catal., 2010, 275, 288–293 CrossRef CAS.
- L. Wang, Y. Ma, Y. Wang, S. Liu and Y. Deng, Catal. Commun., 2011, 12, 1458–1462 CrossRef CAS.
- J. A. Lopez-Sanchez, L. Griesel, J. K. Bartley, R. P. K. Wells, A. Liskowski, D. S. Su, R. Schlogl, J. C. Volta and G. J. Hutchings, Phys. Chem. Chem. Phys., 2003, 5, 3525–3533 RSC.
- C. Hammond, J. A. Lopez-Sanchez, M. H. Ab Rahim, N. Dimitratos, R. L. Jenkins, A. F. Carley, Q. A. He, C. J. Kiely, D. W. Knight and G. J. Hutchings, Dalton Trans., 2011, 40, 3927–3937 RSC.
- C. Hammond, J. A. Lopez-Sanchez, M. Hasbi Ab Rahim, N. Dimitratos, R. L. Jenkins, A. F. Carley, Q. He, C. J. Kiely, D. W. Knight and G. J. Hutchings, Dalton Trans., 2011, 40, 3927–3937 RSC.
- G. L. Brett, Q. He, C. Hammond, P. J. Miedziak, N. Dimitratos, M. Sankar, A. A. Herzing, M. Conte, J. A. Lopez-Sanchez, C. J. Kiely, D. W. Knight, S. H. Taylor and G. J. Hutchings, Angew. Chem., Int. Ed., 2011, 50, 10136–10139 CrossRef CAS.
- J. A. Lopez-Sanchez, N. Dimitratos, C. Hammond, G. L. Brett, L. Kesavan, S. White, P. Miedziak, R. Tiruvalam, R. L. Jenkins, A. F. Carley, D. Knight, C. J. Kiely and G. J. Hutchings, Nat. Chem., 2011, 3, 551–556 CrossRef CAS.
- G. L. Brett, P. J. Miedziak, N. Dimitratos, J. A. Lopez-Sanchez, N. F. Dummer, R. Tiruvalam, C. J. Kiely, D. W. Knight, S. H. Taylor, D. J. Morgan, A. F. Carley and G. J. Hutchings, Catal. Sci. Technol., 2012, 2, 97–104 CAS.
- N. Dimitratos, J. A. Lopez-Sanchez, D. Morgan, A. Carley, L. Prati and G. J. Hutchings, Catal. Today, 2007, 122, 317–324 CrossRef CAS.
- V. R. Ruiz, A. Velty, L. L. Santos, A. Leyva-Perez, M. J. Sabater, S. Iborra and A. Corma, J. Catal., 2010, 271, 351–357 CrossRef CAS.
Footnote |
| † Present address: Stephenson Institute for Renewable Energy, The Department of Chemistry, University of Liverpool, Liverpool, L69 7ZD, UK. E-mail: jals@liverpool.ac.uk; Fax: +44 (0)151 794 3588; Tel: +44 (0)151 794 3555. |
| This journal is © The Royal Society of Chemistry 2012 |

