Synthesis of Ce co-doped Ag–ZnO photocatalyst with excellent performance for NBB dye degradation under natural sunlight illumination†
Received
20th April 2012
, Accepted 4th June 2012
First published on 13th June 2012
Abstract
The synthesis of Ce co-doped Ag–ZnO (Ce–Ag–ZnO) has been successfully achieved by a solvothermal method. The synthesized catalyst was characterized by X-ray diffraction (XRD), field emission scanning electron microscope (FE-SEM) images, diffuse reflectance spectra (DRS), photoluminescence spectra (PL), cyclic voltammetry (CV) and BET surface area measurements. The photocatalytic activity of Ce–Ag–ZnO was investigated for the degradation of Napthol Blue Black (NBB) dye in aqueous solution under solar light irradiation. Co-dopants shift the absorbance of ZnO to the visible region. Ce–Ag–ZnO is found to be more efficient than Ag–ZnO, Ce–ZnO, commercial ZnO, prepared ZnO, TiO2-P25 and TiO2 (Merck) at pH 9 for the mineralization of NBB dye under solar light irradiation. The influences of operational parameters such as the amount of photocatalyst, dye concentration, initial pH on photo-mineralization of NBB have been analyzed. The mineralization of NBB dye has been confirmed by COD measurements. A degradation mechanism is proposed for the degradation of NBB under solar light. The catalyst is found to be reusable.
1. Introduction
Photocatalysis is a promising technique for solving many current environmental and energy issues.1,2 Environmental problems, due to organic pollutants and toxic chemicals, provide the impetus for fundamental and applied research in the environmental area. Semiconductor absorbents and photocatalysts offer the potential for elimination of toxic chemicals through their good organization and wide applicability.3 Heterogeneous photocatalysis with semiconductors are widely investigated as a useful technique not only for the degradation of contaminants in waste water and air, but also for solar energy harvesting.4–8 Semiconductor photocatalysts such as titanium oxide (TiO2) and zinc oxide (ZnO) have been applied to a variety of environmental processes such as remediation of organic contaminants and destruction of microorganisms.9,10 Among others, ZnO assisted photocatalytic processes occupy a prominent place, mainly because of their high degradation capacity towards toxic chemicals. The band-gap energy of ZnO is similar to that of TiO2, the most used and typical photocatalytic material, so it hypothetically has the same photocatalytic ability as TiO2. Hoffman et al. have observed the production of H2O2 by ZnO during photo-illumination which produces the powerful oxidizing species hydroxyl radical (˙OH).11 These facts imply that ZnO should be a promising alternative to TiO2 in photocatalysis.12 However, because of its high band gap (3.2 eV) ZnO can only absorb UV light with the wavelength equal to or less than 385 nm. Visible light with spectral wavelength between 400 and 700 nm accounts for 45% of the total energy of the solar radiation while UV light represents less than 10%.13 Moreover, ZnO exhibits rapid recombination of photo-induced electrons and holes, which lessens its photocatalytic efficiency.14 Therefore the photocatalytic activity of ZnO needs to be further enhanced for a large scale use. The presence of noble metals on the semiconductor surface can efficiently capture electrons from the conduction band. This would facilitate electron transfer to reducible species and increase electron–hole separation. The deposition of noble metals, such as Pt15,16 Au,16–19 Ag,20,21 and Pd16,22 on semiconductor oxides has been reported to increase their photocatalytic activity.
Recently, simultaneous doping of two kinds of atoms (co-doping) into semiconductor materials has attracted considerable interest, as it could result in a higher photocatalytic activity and special characteristics compared with single element doping into semiconductor oxides, such as Ag+ and La3+,23 metallic silver and V,24 Ga/Al/Co co-dopants.25 In addition to this, rare-earth oxides are found to have good thermal stability, due to their 4f electron and multi-electron configuration. Lanthanide (Ln)-doped TiO2 (NPs) has been especially favored for its unique 4f electron configuration. Among others, Ce-doped TiO2 have attracted interest due to the Ce3+/Ce4+ redox couple, which results from the shift of cerium oxide between CeO2 and Ce2O3 under oxidizing and reducing conditions.26,27 Many studies have shown that Ce doping enhances the photocatalytic activity of TiO2.28–31 In our study, a simple solvothermal method is developed for the synthesis of cerium co-doped Ag–ZnO (Ce–Ag–ZnO) superstructures. The prepared material shows a higher activity and stability, and thereby displays strong photocatalytic efficiency in the photodegradation of Napthol blue black dye under solar light. In addition to this, a possible mechanism is discussed in detail.
2. Experimental
2.1. Materials
The commercial azo dye NBB obtained from Aldrich was used as supplied. Oxalic acid dihydrate (99%) and zinc nitrate hexahydrate (99%) were obtained from Himedia chemicals. AgNO3 and Ce(NH4)4(SO4)4·2H2O(CAS) were obtained from Spectrochem, ZnO (Himedia), Oxone (Himedia), KBrO3 (Himedia) and TiO2 (Merck) were used as received. A gift sample of Degussa TiO2-P25 was obtained from Evonik (Germany) and is a 80![[thin space (1/6-em)]](https://www.rsc.org/images/entities/char_2009.gif) :
:![[thin space (1/6-em)]](https://www.rsc.org/images/entities/char_2009.gif) 20 mixture of anatase and rutile. It has a particle size of 30 nm and a BET surface area of 50 m2 g−1. K2Cr2O7 (s.d.fine), Ag2SO4 (s.d.fine), ferroin indicator (s.d.fine), HgSO4, FeSO4·7H2O (Qualigens) and H2O2 (Rankem) were used as received. Double-distilled water was used to prepare experimental solutions. The pH of the solutions before irradiation was adjusted using H2SO4 or NaOH.
20 mixture of anatase and rutile. It has a particle size of 30 nm and a BET surface area of 50 m2 g−1. K2Cr2O7 (s.d.fine), Ag2SO4 (s.d.fine), ferroin indicator (s.d.fine), HgSO4, FeSO4·7H2O (Qualigens) and H2O2 (Rankem) were used as received. Double-distilled water was used to prepare experimental solutions. The pH of the solutions before irradiation was adjusted using H2SO4 or NaOH.
2.2. Preparation of Ce co-doped Ag–ZnO
Ce co-doped Ag–ZnO was prepared by a solvothermal method (Scheme 1). Aqueous solutions of 100 mL of 0.4 M zinc nitrate hexahydrate and 100 mL of 0.6 M oxalic acid in deionized water were brought to their boiling points separately. 5 mL of 0.128 g (7.5 × 10⁻⁴ M) of AgNO3 was combined with the zinc nitrate solution. To this mixture (AgNO3 + Zn(NO3)2) oxalic acid solution was added. Precipitation of Ag–zinc oxalate occurred (sol 1) (2 wt% Ag relative to ZnO). To this 0.365 g of Ce(NH4)2(SO4)4·2H2O in 5 ml of water was added with stirring and then heated for 1 h at 60–70 °C (sol 2). The solution was cooled to room temperature. A fine uniform precipitate of Ce with Ag–zinc oxalate was formed. The Ce/Ag–zinc oxalate crystals were washed several times with distilled water, air-dried overnight and dried at 100 °C for 5 h. The sample was calcined in a muffle furnace at a rate of 20 °C min−1 to reach the decomposition temperature (450 °C). After 12 h, the furnace was allowed to cool to room temperature. The Ce co-doped Ag–ZnO catalyst was collected and used for further analysis. This catalyst contained 3 wt% of Ce. Catalysts with 1, 2, 4 and 5 wt% of Ce were prepared by using the same procedure. The bare ZnO was prepared without addition of AgNO3 and CAS. Ag–ZnO and Ce–ZnO were prepared by the same procedure with appropriate amounts of the respective precursors.
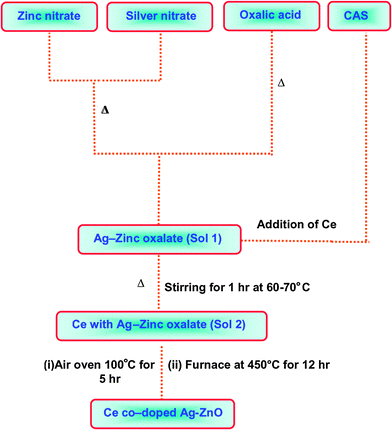 |
| | Scheme 1 Schematic representation for preparation of Ce–Ag–ZnO. | |
2.3. Analytical methods
Powder X-ray diffraction pattern was obtained using an X'Pert PRO diffractometer equipped with Cu-Kα radiation (wavelength = 1.5406 Å) at 2.2 kW (max.). Peak positions were compared with standard files to identify the crystalline phases. The morphology of the samples were examined using a JEOL JSM-6701F cold field emission scanning electron microscope (FE-SEM). Before FE-SEM measurements, the samples were mounted on a gold platform placed in the scanning electron microscope for subsequent analysis at various magnifications, equipped with OXFORD, energy dispersive X-ray microanalysis (EDS). Diffuse reflectance spectra (DRS) were recorded using a Shimadzu UV-2450. Photoluminescence (PL) spectra at room temperature were recorded using a Perkin Elmer LS 55 fluorescence spectrometer. The nanoparticles were dispersed in carbon tetrachloride and excited using light of wavelength 300 nm. Cyclic voltammetry (CV) measurements were carried out using CHI 60AC electrochemical analyzer (CHI Instruments Inc. USA). The specific surface areas of the samples were determined through nitrogen adsorption at 77 K on the basis of the BET equation using a Micrometrics ASAP 2020 V3.00 H. UV spectral measurements were done using Hitachi-U-2001 spectrometer.
2.4. Irradiation experiments
Solar photocatalytic degradation experiments were carried out under similar conditions on sunny days between 11 am and 2 pm. An open borosilicate glass tube of 50 mL capacity, 40 cm height and 12.6 mm diameter was used as the reaction vessel. 50 mL of NBB (2 × 10⁻⁴ M) with the appropriate amount of catalyst was stirred for 30 min in the dark prior to illumination in order to achieve maximum adsorption of dye onto the semiconductor surface. Irradiation was carried out in the open air with continuous aeration by a pump to provide oxygen and for the complete mixing of reaction solution. During the illumination time no volatility of the solvent was observed. In all cases, 50 mL of reaction mixture was irradiated. At specific time intervals, 2–3 mL of the sample was withdrawn and centrifuged to separate the catalyst. 1 mL of the sample was suitably diluted and the dye concentration was determined from the absorbance at the analytical wavelength (320 nm).
2.5. Solar light intensity measurements
Solar light intensity was measured for every 30 min and the average light intensity over the duration of each experiment was calculated. The sensor was always set in the position of maximum intensity. The intensity of solar light was measured using LT Lutron LX-10/A Digital Lux meter and the intensity was 1250 × 100 ± 100 lux. The intensity was nearly constant during the experiments.
2.6. Chemical oxygen demand (COD) measurements
COD was determined using the following procedure. The sample was refluxed with HgSO4, a known volume of standard K2Cr2O7, Ag2SO4 and H2SO4 for 2 h and titrated with standard ferrous ammonium sulfate (FAS) of normality n using ferroin as indicator. A blank titration was also carried out (Vblank) with distilled water instead of dye sample (Vdye). COD was determined using eqn (1):| | | COD = [(Vblank − Vdye)/Vdye]nFAS × 8 × 1000 | (1) |
3. Results and discussion
3.1. Characterization of catalyst
Primary analysis of photocatalytic degradation of NBB with different wt% of Ce on Ag–ZnO catalyst was carried out. Pseudo-first order rate constants determined for 1, 2, 3, 4 and 5 wt% of Ce loading were 0.0631, 0.0644, 0.0734, 0.0672 and 0.0649 min−1, respectively. The catalyst loaded with 3 wt% of Ce was found to be the most efficient. Hence, 3 wt% of Ce was taken as optimum concentration of Ce on Ag–ZnO and this catalyst was characterized by XRD, FE-SEM, DRS, PL, CV and BET surface area measurements. XRD patterns of the bare ZnO and Ce–Ag–ZnO are shown in Fig. 1. For the bare ZnO (Fig. 1a), diffraction peaks are found at 31.68, 34.36, 36.18 and 56.56, and correspond to (100), (002), (101) and (110) planes of wurtzite ZnO, and so reveals that bare ZnO has the wurtzite structure. Fig. 1b shows the XRD pattern of Ce–Ag–ZnO. In the Ce–Ag–ZnO system, in addition to the bare ZnO peaks there is a new peak at 2θ value of 28.9° corresponding to the (111) plane32 of Ce4+ (JCPDS 898436). This confirms the loading of Ce. Due to the low concentration of Ag (2 wt%) this could not be detected by XRD. Broadening the peak of Ce–Ag–ZnO indicates that reduction in the size of the bare ZnO. The crystalline sizes of bare ZnO and Ce–Ag–ZnO were determined using the Debye–Scherrer equation and are found to be 30.1 and 5.4 nm, respectively. The crystalline size of Ce–Ag–ZnO is thus much lower than of bare ZnO.
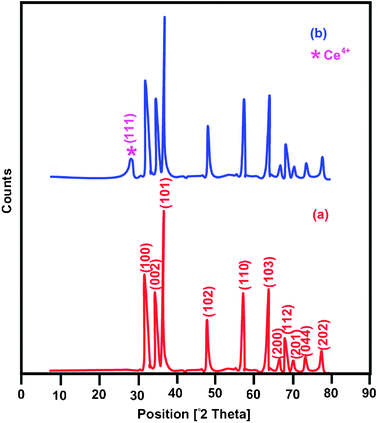 |
| | Fig. 1 XRD patterns of (a) bare ZnO and (b) Ce–Ag–ZnO. | |
The surface morphology of Ce–Ag–ZnO has been analyzed by FE-SEM images. The FE-SEM images at two different magnifications with different locations are given in (Fig. 2a–d). At higher magnification of 20 nm, big particles with hexagonal structure of ZnO are clearly seen (indicated by circles) (Fig. 2a). Lower magnification (100 nm) at three different locations (Fig. 2b–d) clearly indicates the presence of Ce (indicated by arrow marks). Ce particles are highly dispersed on the surface of ZnO (Fig. 2b–d). Elements of Ce–Ag–ZnO are analyzed by EDS (Fig. S1, ESI†). The EDS of Ce–Ag–ZnO reveals the presence of Ce, Ag, Zn and O.
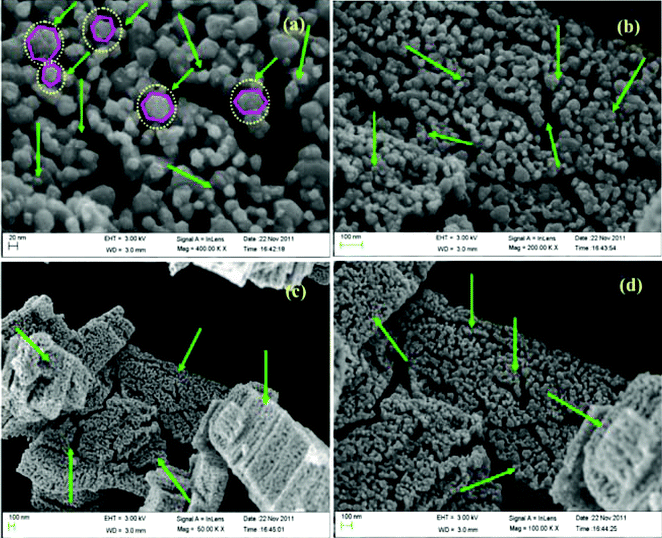 |
| | Fig. 2 FE-SEM images (a) Ce–Ag–ZnO (20 nm), (b) Ce–Ag–ZnO (100 nm), (c) Ce–Ag–ZnO (100 nm) and (d) Ce–Ag–ZnO (100 nm). | |
The diffuse reflectance spectra of bare ZnO and Ce–Ag–ZnO are shown in Fig. 3a and b, respectively. Co-dopants (Ag and Ce) extend the absorbance of ZnO to the entire visible region. Silver and cerium co-doping in ZnO causes a redshift in the absorption edge from 400 to 420 nm. The red shift in the absorption edge is interpreted as a possible evidence for good contact between ZnO and silver, cerium species, which indicates the presence of Ag–ZnO–Ce bonds. It is generally thought that the redshift is caused by the new energy level in the bandgap. Therefore, the redshift of Ce–Ag–ZnO photocatalyst can be ascribed to the charge transfer between the ZnO valence or conduction band and the cerium ion 4f level.33 As a result, Ce–Ag–ZnO has a trapping level which decreases the bandgap of ZnO, and the cerium doping enhances the visible light absorption ability of the ZnO photocatalyst. In addition, the UV-vis spectra in the diffuse reflectance mode (R) was transformed to the Kubelka–Munk function F(R) to separate the extent of light absorption from scattering. The band gap value is obtained from the plot of the modified Kubelka–Munk function (F(R)E)1/2vs. the energy of the absorbed light E (eqn (2)):
| |  | (2) |
The band gap of Ce–Ag–ZnO is found to be 3.05 eV (Fig. S2, ESI
†).
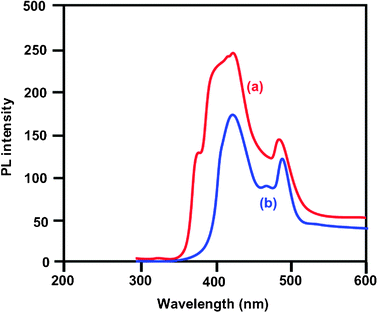
Photoluminescence spectra of bare ZnO and Ce–Ag–ZnO are shown in
Fig. 4a and b, respectively. Photoluminescence occurs due to electron–hole recombination and the PL intensity is directly proportional to the rate of electron–hole recombination. The bare ZnO gave two emissions at 420 and 480 nm. The doping of Ce and Ag with ZnO do not shift the emission of ZnO but the intensity of PL emission decreases when compared to bare ZnO. This is because of the suppression of recombination of electron–hole pairs by Ag and Ce. This decrease in intensity as a result of the decrease of the rate of electron–hole recombination favors the photocatalytic activity for degradation of pollutants.
Cyclic voltammetry measurements were carried out to prove the presence of metal ion in the
catalyst. Both bare ZnO and Ce–Ag–ZnO were used in the redox reaction of
potassium ferrocyanide (3 mM). Bare ZnO does not give any anodic potential or current (Fig. S3a, ESI
†), whereas in Ce–Ag–ZnO the anodic potential and current are
E = 0.798 V and
I = 4.200 × 10
−6 A, respectively (Fig. S3b, ESI
†). This increase in current indicates the presence of metal ions in the
catalyst.
34
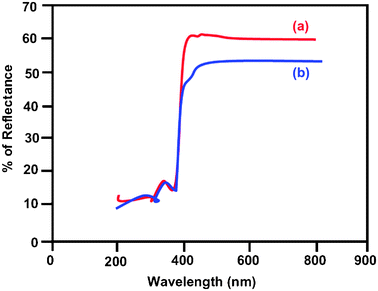 |
| | Fig. 3 DRS of (a) bare ZnO and (b) Ce–Ag–ZnO. | |
Photodegradation depends on the adsorption of the dye or pollutant on the surface of the catalyst. Higher surface area causes a higher amount of adsorption which leads to higher photocatalytic activity for degradation. The surface area of bare ZnO and Ce–Ag–ZnO were determined using nitrogen gas adsorption method and the results are summarized in Table 1. Ce–Ag–ZnO has higher BET surface area (13.5 m2 g−1) than bare ZnO (11.5 m2 g−1). The higher BET surface area makes the catalyst more photoactive.
| Property |
Bare ZnO |
Ce–Ag–ZnO |
| BET surface area/m2 g−1 |
11.5 |
13.5 |
| Total pore volume (single point)/cm3 g−1 |
0.07 |
0.08 |
3.2. Photodegradability of NBB
The photodegradability of NBB with different photocatalysts under solar light irradiation is shown in Fig. 5. Almost complete degradation of the dye takes place in 40 min with Ce–Ag–ZnO (curve a) under solar light. This compares with 29.0% decrease in dye concentration for the same experiment performed with Ce–Ag–ZnO in the absence of solar light (curve b), which may be due to adsorption of the dye on the surface of the catalyst. Negligible degradation (0.2%) occurred when the reaction was carried out in the presence of solar light without any catalyst. From these observations, one can state that both solar light and catalyst are needed for effective degradation of the dye. When the photocatalyst of Ag–ZnO, Ce–ZnO, bare ZnO, commercial ZnO, TiO2-P25 and TiO2 (Merck) were used under same conditions only 60.1 (curve c), 61.2 (curve d), 53.0 (curve e), 62.0 (curve f), 44.6 (curve g) and 36.5% (curve h) degradations occurred, respectively. This shows that solar/Ce–Ag–ZnO process is more efficient in NBB degradation than other processes.
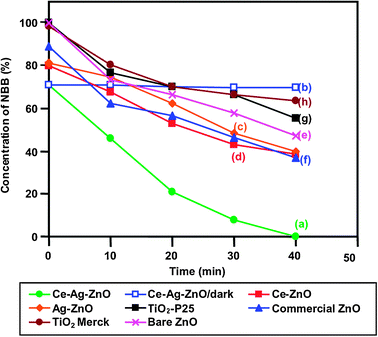 |
| | Fig. 5 Photodegradability of NBB; dye concentration = 2 × 10⁻⁴ mol L−1, catalyst suspension = 3 g L−1, pH = 9, airflow rate = 8.1 mL s−1. | |
The photocatalytic degradation of NBB dye containing Ce–Ag–ZnO obeys pseudo-first order kinetics. At low initial dye concentration, the rate expression is given by:
where
k′ is the pseudo-first order rate constant. The
dye is adsorbed onto the Ce–Ag–ZnO surface and the adsorption–desorption equilibrium is reached in 30 min. After
adsorption, the equilibrium concentration of the
dye solution is determined and is taken as the initial
dye concentration for kinetic analysis. Integration of
eqn (3) (with the limit of
C =
C0 at
t = 0 with
C0 being the equilibrium concentration of the bulk solution) gives
eqn (4):
where
C0 is the equilibrium concentration of
dye and
C is the concentration at time
t.
The UV-vis spectra of NBB (2 × 10⁻⁴ M) solution at different irradiation times are shown in Fig. 6. There is no significant change in UV-visible spectra during irradiation and the intensity at 320 and 615 nm decreases gradually during the degradation. This reveals that the intermediates do not absorb at the analytical wavelengths of 320 and 615 nm.
![The changes in UV-vis spectra of NBB on irradiation with solar light in the presence of Ce–Ag–ZnO: [NBB] = 2 × 10⁻⁴ M; pH = 9; catalyst suspension = 3 g L−1; airflow rate = 8.1 mL s−1; (a) 0 min, (b) 10 min, (c) 20 min, (d) 30 min and (e) 40 min.](/image/article/2012/CY/c2cy20254a/c2cy20254a-f6.gif) |
| | Fig. 6 The changes in UV-vis spectra of NBB on irradiation with solar light in the presence of Ce–Ag–ZnO: [NBB] = 2 × 10⁻⁴ M; pH = 9; catalyst suspension = 3 g L−1; airflow rate = 8.1 mL s−1; (a) 0 min, (b) 10 min, (c) 20 min, (d) 30 min and (e) 40 min. | |
3.3. Effects of photocatalytic parameters
3.3.1. Effect of solution pH.
It is well established that photodegradation depends upon the adsorption of the dye on the surface of the catalyst. The adsorption of the dye is greatly influenced by pH of the solution used.35,36 The effect of initial pH on NBB degradation is shown in Fig. 7. The pseudo-first order rate constants for Ce–Ag–ZnO at pH 3, 5, 7, 9 and 11 are 0.0269, 0.0422, 0.0552, 0.0738 and 0.0482 min−1, respectively. It is observed that increase in pH from 3 increases the removal efficiency of NBB up to pH 9 and then decreases. The optimum pH for efficient NBB removal on Ce–Ag–ZnO is 9. It is well known that at acidic pH range the removal efficiency is lower and is due to the dissolution of ZnO. Since the photocatalytic efficiency depends on adsorption of dye on the surface of the catalyst, investigation of the adsorption of the dye at different pH was carried out. The percentages of adsorption at pH 3, 5, 7, 9 and 11 were found to be 12.0, 20.5, 23.4, 29.0 and 22.2 after the attainment of adsorption equilibrium (30 min). As the adsorption is highest at pH 9 the degradation is most efficient at this pH.
![Effect of solution pH, [NBB] = 2 × 10⁻⁴ mol L−1, 3 wt% Ce–Ag–ZnO suspension = 3 g L−1, airflow rate = 8.1 mL s−1, irradiation time = 30 min.](/image/article/2012/CY/c2cy20254a/c2cy20254a-f7.gif) |
| | Fig. 7 Effect of solution pH, [NBB] = 2 × 10⁻⁴ mol L−1, 3 wt% Ce–Ag–ZnO suspension = 3 g L−1, airflow rate = 8.1 mL s−1, irradiation time = 30 min. | |
3.3.2. Effect of catalyst dosage.
The effect of catalyst dosage on photodegradation of NBB under solar light was carried out by varying the catalyst amount from 2 to 6 g L−1 and the results are shown in Fig. 8. The pseudo-first order rate constants are 0.0637, 0.0738, 0.0729, 0.0729 and 0.0728 min−1 for Ce–Ag–ZnO at catalyst dosage of 2, 3, 4, 5 and 6 g L−1, respectively. The degradation increases with catalyst dosage from 2 to 3 g L−1 and then remains almost constant. The optimum catalyst dosage is found to be 3 g L−1. Enhancement of removal rate is due to the following reasons:
(a) The dosage of catalyst increases the amount of dye adsorbed on the surface of catalyst.
(b) The area of illumination may also increase.
![Effect of catalyst loading, [NBB] = 2 × 10⁻⁴ mol L−1, catalyst used = 3 wt% Ce–Ag–ZnO, pH = 9, airflow rate = 8.1 mL s−1, irradiation time = 30 min.](/image/article/2012/CY/c2cy20254a/c2cy20254a-f8.gif) |
| | Fig. 8 Effect of catalyst loading, [NBB] = 2 × 10⁻⁴ mol L−1, catalyst used = 3 wt% Ce–Ag–ZnO, pH = 9, airflow rate = 8.1 mL s−1, irradiation time = 30 min. | |
The decrease in efficiency of NBB at higher dosage (above 3 g L−1) may be due to light scattering effect by the catalyst. Similar results have been reported for the photodegradation of dyes by ZnO.36,37
3.3.3. Effect of initial dye concentration.
The effect of various initial dye concentrations for the degradation of NBB on Ce–Ag–ZnO was investigated. Increase of dye concentration from 1 to 5 × 10⁻⁴ M decreases the rate constant from 0.1370 to 0.0262 min−1 for degradation in 30 min (Fig. 9). The reason for decreasing efficiency may be due to the decrease in light penetration by dye molecules.34,37
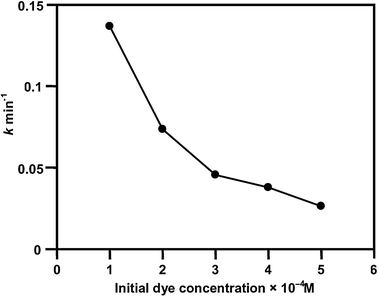 |
| | Fig. 9 Effect of initial dye concentration, pH = 9, 3 wt% Ce–Ag–ZnO suspension = 3 g L−1, airflow rate = 8.1 mL s−1, irradiation time = 30 min. | |
3.4. Stability of the photocatalyst
The main advantage of heterogeneous catalysts used for any reactions is its reusability. The reusability of Ce–Ag–ZnO was tested by four successive cycles for the degradation of NBB under solar light and the results are shown in Fig. 10. Complete degradation occurred in the 1st, 2nd and 3rd runs at 40 min whereas the 4th run gave 96.8% degradation. The results show our prepared catalyst is stable and reusable.
![Catalyst reusability, [NBB] = 2 × 10⁻⁴ mol L−1, 3 wt% Ce–Ag–ZnO suspension = 3 g L−1, airflow rate = 8.1 mL s−1, irradiation time = 40 min.](/image/article/2012/CY/c2cy20254a/c2cy20254a-f10.gif) |
| | Fig. 10 Catalyst reusability, [NBB] = 2 × 10⁻⁴ mol L−1, 3 wt% Ce–Ag–ZnO suspension = 3 g L−1, airflow rate = 8.1 mL s−1, irradiation time = 40 min. | |
3.5. COD analysis
To confirm the mineralization of NBB, the degradation was also analyzed by COD values. The % of COD reductions is given in Table 2. After 40 min irradiation with Ce–Ag–ZnO, 98.5% of COD reduction is obtained. This indicates almost complete mineralization of dye.
Table 2 COD measurementsa
|
t/min |
% COD reduction |
|
[NBB] = 2 × 10⁻⁴ mol L−1; 3 wt% Ce–Ag–ZnO suspension = 3 g L−1; pH = 9; airflow rate = 8.1 mL s−1; I = 1.381 × 10⁻⁶ Einstein L−1 s−1.
|
| 10 |
16.8 |
| 20 |
33.6 |
| 30 |
67.2 |
| 40 |
98.5 |
3.6. Mechanism of degradation
A mechanistic scheme of the charge separation and photocatalytic reaction for Ce–Ag–ZnO photocatalyst is shown in Scheme 2. When the semiconductor is illuminated by solar irradiation, a valance band electron (VB) goes to the conduction band (CB) leaving a hole in the valance band. Generally these electron–hole pairs are recombined to reduce the photocatalytic activity of semiconductors. However, the presence of ‘Ag’ and ‘Ce’ traps the electron from the CB of ZnO simultaneously, which suppresses the electron–hole recombination. It is well established that ‘Ag’ can trap the electrons from the CB of ZnO during solar irradiation in the photocatalytic process for photoreduction.38 The dark adsorption of Ce–Ag–ZnO is higher when compared to Ce–ZnO and Ag–ZnO. This enhances the photocatalytic activity of Ce–Ag–ZnO due to a synergistic effect between Ag and Ce in ZnO. It is shown that the photocatalytic activity of Ce–Ag–ZnO photocatalyst is higher than that of all other semiconductor photocatalysts. The photocatalytic mechanism occurs whereby oxygen adsorbed on the surface of photocatalyst can trap the photogenerated electron,39 and the electron transfer to oxygen may be the rate-determining step in semiconductor photocatalysis.40 However, Ce4+ easily traps the photo-excited electron in the system of Ce-doped samples, because Ce4+ ion, as a Lewis acid, apparently is superior to the oxygen molecule (O2) in its capability of trapping electrons.41 The electrons trapped in Ce4+ sites are subsequently transferred to the adsorbed O2 by an oxidation process, so the simple recombination between electrons and holes is reduced (eqn (5) and (6)):| | | Ce3+ + O2 → O2˙− + Ce4+ | (6) |
Thus it can be seen that the Ce 4f level in Ce–Ag–ZnO plays an important role in the interfacial charge transfer and inhibition of electron–hole recombination. The UV–vis spectra show that co-doping of Ag and Ce improve the visible light absorption of ZnO, and generate more electron–hole pairs under solar light irradiation, which helps to enhance the photocatalytic activity of Ce–Ag–ZnO photocatalyst.
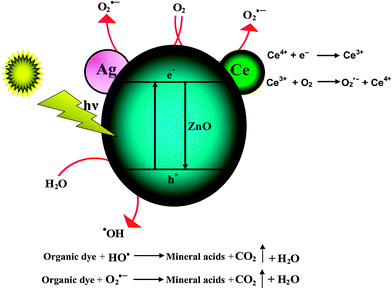 |
| | Scheme 2 Mechanism of degradation of NBB by Ce–Ag–ZnO. | |
Since Ce4+ traps the electron easily, it act as a scavenger of electrons. So Ce3+ and Ce4+ coexisting in Ce–Ag–ZnO influence the photoreactivity by altering the electron–hole pair recombination. Moreover, the trapping nature of Ag and Ce4+/Ce3+ sites are subsequently transferred to the surrounding adsorbed O2 to produce a large number of superoxide radical anions and at the same time VB holes of ZnO react with water to produce highly reactive hydroxyl (˙OH) radicals. The highly reactive superoxide radical anion and hydroxyl radicals lead to the degradation of dye. The increase in the production of O2˙− and ˙OH by Ce and Ag increases the photocatalytic activity of Ce–Ag–ZnO.
4. Conclusions
The synthesis of Ce-co-doped Ag–ZnO has been successfully achieved by a simple solvothermal method. The presence of Ce and Ag in the catalyst has been revealed by XRD, FE-SEM images, EDS, DRS, PL, CV and BET surface area measurements. Co-dopants shift the absorption of ZnO to the entire visible region. Ce–Ag–ZnO shows lower reflectance in the visible region than ZnO, and shifting of the absorption edge to the visible region when compared to ZnO. The lower reflectance led to a higher absorption visible region. The PL spectra reveal the suppression of recombination of photogenerated electron–hole pairs by Ce and Ag loading on ZnO. ‘Ag’ and Ce4+ trap the photo-excited electrons, so that the recombination rate of the electron–hole pairs decreases. Ce–Ag–ZnO is found to be more efficient than Ag–ZnO, Ce–ZnO, bare ZnO, commercial ZnO, TiO2-P25 and TiO2 (Merck) for degradation of NBB degradation under solar light. The optimum pH and catalyst dosage for efficient removal of dye are found to be 9 and 3 g L−1, respectively. COD measurements confirm the complete mineralization of the NBB molecule. A mechanism involving electron trapping by Ag and Ce is proposed to explain the higher photocatalytic activity of the catalyst. The catalyst was found to be reusable.
Acknowledgements
The authors are thankful to CSIR, New Delhi, India for financial support through research grant No. 21(0799)/10/EMR-II. One of the authors B. Subash is thankful to UGC, New Delhi, India for a BSR Fellowship. One of the authors B. Krishnakumar is thankful to CSIR, New Delhi, India for the award of a Senior Research Fellowship.
References
- D. Ravelli, D. Dondi, M. Fagnoni and A. Albini, Chem. Soc. Rev., 2009, 38, 1999–2011 RSC.
- M. R. Hoffmann, S. T. Martin, W. Y. Choi and D. W. Bahnemann, Chem. Rev., 1995, 95, 69–96 CrossRef CAS.
- J. S. Hu, L. L. Ren, Y. G. Guo, H. P. Liang, A. M. Cao, L. J. Wan and C. L. Bai, Angew. Chem., Int. Ed., 2005, 44, 1269–1273 CrossRef CAS.
- R. Abe, J. Photochem. Photobiol., C, 2010, 11, 179–209 CrossRef CAS.
- A. Fujishima, T. N. Rao and D. A. Tryk, J. Photochem. Photobiol., C, 2000, 1, 1–21 CrossRef CAS.
- D. Bahnemann, Sol. Energy, 2004, 77, 445–459 CrossRef CAS.
- X. Chen and S. S. Mao, Chem. Rev., 2007, 107, 2891–2959 CrossRef CAS.
- A. Fujishima, X. Zhang and D. A. Tryk, Surf. Sci. Rep., 2008, 63, 515–582 CrossRef CAS.
- A. Fujishima and K. Honda, Nature, 1972, 238, 37–38 CrossRef CAS.
- A. L. Linsebigler, G. Q. Lu and T. J. Yates, Chem. Rev., 1995, 95, 735–758 CrossRef CAS.
- A. J. Hoffman, E. R. Carraway and M. R. Hoffmann, Environ. Sci. Technol., 1994, 28, 776–85 CrossRef CAS.
- M. D. Hernaández-Alonso, F. Fresno, S. Suaárez and J. M. Coronado, Energy Environ. Sci., 2009, 2, 1231–1257 Search PubMed.
- F. B. Bouaifel, B. Sieber, J. Benner, P. Roussel, L. Boussekey, S. Szuneritsa and R. Boukherroub, J. Mater. Chem., 2011, 21, 10982–10989 RSC.
- H. Zeng, W. Cai, P. Liu, X. Xu, H. Zhou, C. Klingshirn and H. Kalt, ACS Nano, 2008, 2, 1661–1670 CrossRef CAS.
- A. Sclafani, L. Palmisano, G. MarcÍ′ and A. M. Venezia, Sol. Energy Mater. Sol. Cells, 1998, 51, 203–219 CrossRef CAS.
- S. Sakthivel, M. V. Shankar, M. Palanichamy, B. Arabindoo, D. W. Bahnemann and V. Murugesan, Water Res., 2004, 38, 3001–3008 CrossRef CAS.
- C. Wang, C. Liu, X. Zheng, J. Chen and T. Shen, Colloids Surf., A, 1998, 131, 271–280 CrossRef CAS.
- X. Z. Li and F. B. Li, Environ. Sci. Technol., 2001, 35, 2381–2388 CrossRef CAS.
- A. Dobosz and A. Sobczynński, Monatsh. Chem., 2001, 132, 1037–1045 CrossRef CAS.
- A. Sclafani and J. M. Hermann, J. Photochem. Photobiol., A, 1998, 113, 181–188 CrossRef CAS.
- H. Tran, K. Chiang, J. Scott and R. Amal, Photochem. Photobiol. Sci., 2005, 4, 565–567 CAS.
- C. M. Wang, A. Heller and H. Gerischer, J. Am. Chem. Soc., 1992, 114, 5230–5234 CrossRef CAS.
- N. Zhao, M. Yao, F. Li a and F. Lou, J. Solid State Chem., 2011, 184, 2770–2775 CrossRef CAS.
- X. Yanga, F. Mab, K. Li, Y. Guob, J. Hub, W. Li, M. Huoa and Y. Guob, J. Hazard. Mater., 2010, 175, 429–438 CrossRef.
- H. Serier, O. Toulemonde, D. Bernard, A. Demourgues, J. Majimel and M. Gaudon, Mater. Res. Bull., 2012, 47, 755–762 CrossRef CAS.
- F. B. Li, X. Z. Li, M. F. Hou, K. W. Cheah and W. C. H. Choy, Appl. Catal., A, 2005, 285, 181–189 CrossRef CAS.
- N. Sasirekha, S. John, S. Basha and K. Shanthi, Appl. Catal., B, 2006, 62, 169–180 CrossRef CAS.
- M. Palacio, P. I. Villabrille, G. P. Romanelli, P. G. Vazquez and C. V. Caceres, Appl. Catal., A, 2009, 359, 62–68 CrossRef CAS.
- W. Xue, G. Zhang, X. Xu, X. Yang, C. Liu and Yuehua Xu, Chem. Eng. J., 2011, 167, 397–402 CrossRef CAS.
- Z. Liu, B. Guo, L. Hong and H. Jiang, J. Phys. Chem. Solids, 2005, 66, 161–167 CrossRef CAS.
- K. S. Guan and Y. S. Yin, Mater. Chem. Phys., 2005, 9, 210–15 Search PubMed.
- C. Karunakaran, P. Gomathisankar and G. Manikandan, Mater. Chem. Phys., 2010, 123, 585–594 CrossRef CAS.
- Y. Xie and C. Yuan, Appl. Catal., B, 2003, 46, 251–259 CrossRef CAS.
- B. Krishnakumar, B. Subash and M. Swaminathan, Sep. Purif. Technol., 2012, 85, 35–44 CrossRef CAS.
- B. Krishnakumar and M. Swaminathan, Indian J. Chem., Sect. A, 2010, 49, 1035–1040 Search PubMed.
- R. Velmurugan and M. Swaminathan, Sol. Energy Mater. Sol. Cells, 2011, 95, 942–950 CrossRef CAS.
- B. Krishnakumar, K. Selvam, R. Velmurugan and M. Swaminathan, Desalin. Water Treat., 2010, 132–139 CrossRef CAS.
- S. Chen and U. Nickel, Chem. Commun., 1996, 133–134 RSC.
- A. Mills and M. McGrady, J. Photochem. Photobiol., A, 2008, 193, 228–236 CrossRef CAS.
- G. M. Mura, M. L. Ganadu, P. Lombardi, G. Lubinu, M. Branca and V. Maida, J. Photochem. Photobiol., A, 2002, 148, 199–204 CrossRef CAS.
- J. M. Coronado, A. J. Maira, A. Martinez-Arias, J. C. Conesa and J. Soria, J. Photochem. Photobiol., A, 2002, 150, 213–221 CrossRef CAS.
Footnote |
| † Electronic supplementary information (ESI) available: Fig. S1–S3. See DOI: 10.1039/c2cy20254a |
|
| This journal is © The Royal Society of Chemistry 2012 |
Click here to see how this site uses Cookies. View our privacy policy here. ![[thin space (1/6-em)]](https://www.rsc.org/images/entities/char_2009.gif) :
:![[thin space (1/6-em)]](https://www.rsc.org/images/entities/char_2009.gif) 20 mixture of anatase and rutile. It has a particle size of 30 nm and a BET surface area of 50 m2 g−1. K2Cr2O7 (s.d.fine), Ag2SO4 (s.d.fine), ferroin indicator (s.d.fine), HgSO4, FeSO4·7H2O (Qualigens) and H2O2 (Rankem) were used as received. Double-distilled water was used to prepare experimental solutions. The pH of the solutions before irradiation was adjusted using H2SO4 or NaOH.
20 mixture of anatase and rutile. It has a particle size of 30 nm and a BET surface area of 50 m2 g−1. K2Cr2O7 (s.d.fine), Ag2SO4 (s.d.fine), ferroin indicator (s.d.fine), HgSO4, FeSO4·7H2O (Qualigens) and H2O2 (Rankem) were used as received. Double-distilled water was used to prepare experimental solutions. The pH of the solutions before irradiation was adjusted using H2SO4 or NaOH.



![The changes in UV-vis spectra of NBB on irradiation with solar light in the presence of Ce–Ag–ZnO: [NBB] = 2 × 10⁻⁴ M; pH = 9; catalyst suspension = 3 g L−1; airflow rate = 8.1 mL s−1; (a) 0 min, (b) 10 min, (c) 20 min, (d) 30 min and (e) 40 min.](/image/article/2012/CY/c2cy20254a/c2cy20254a-f6.gif)
![Effect of solution pH, [NBB] = 2 × 10⁻⁴ mol L−1, 3 wt% Ce–Ag–ZnO suspension = 3 g L−1, airflow rate = 8.1 mL s−1, irradiation time = 30 min.](/image/article/2012/CY/c2cy20254a/c2cy20254a-f7.gif)
![Effect of catalyst loading, [NBB] = 2 × 10⁻⁴ mol L−1, catalyst used = 3 wt% Ce–Ag–ZnO, pH = 9, airflow rate = 8.1 mL s−1, irradiation time = 30 min.](/image/article/2012/CY/c2cy20254a/c2cy20254a-f8.gif)

![Catalyst reusability, [NBB] = 2 × 10⁻⁴ mol L−1, 3 wt% Ce–Ag–ZnO suspension = 3 g L−1, airflow rate = 8.1 mL s−1, irradiation time = 40 min.](/image/article/2012/CY/c2cy20254a/c2cy20254a-f10.gif)

