Received
14th March 2012
, Accepted 25th April 2012
First published on 25th April 2012
Abstract
The asymmetric hydrogenation of geraniol (3,7-dimethylocta-2,6-dien-1-ol) to citronellol was performed using ruthenium BINAP catalysts at 60 °C. The influence of solvent (methanol, ethanol, 1-propanol, and 2-propanol), catalyst type (Ru(OAc)2(BINAP), R-Ru(OAc)2(T-BINAP), and R-RuCl[(p-cymene)(BINAP)]Cl), and hydrogen pressure (5–40 bar) was studied. The reaction rate decreased in the order methanol > ethanol > 1-propanol > 2-propanol, but the selectivity and enantiomeric excess were independent of solvent. R-Ru(OAc)2(T-BINAP) afforded the highest enantiomeric excess of S-citronellol. The reaction rate and enantioselectivity increased with hydrogen pressure. A kinetic model was developed based on the proposed reaction mechanism with subsequent parameter estimation.
1. Introduction
Enantiopure compounds are important in pharmaceuticals, agrochemicals and fine chemicals chemistry, one of the reasons being that enantiomers often smell and taste different.1 In addition structural differences between enantiomers can lead to different behavior when they are used as synthetic drugs. Enantiomers can be obtained by chiral resolution, where a compound is prepared in racemic form and then separated, or by asymmetric synthesis. A common method for preparation of optically active compounds is asymmetric hydrogenation.1,2
In this work, the asymmetric hydrogenation of geraniol (3,7-dimethylocta-2,6-dien-1-ol) was performed using ruthenium BINAP catalysts, giving (R)-(+)-citronellol and (S)-(−)-citronellol as products. Both enantiomers occur in nature, the R-enantiomer can be found in citronellal oil and the S-enantiomer in geranium oil. Hydrogenation of geraniol using Ru–BINAP has previously been performed by Takaya et al.,3–5 Sun et al.6–8 and Matteoli et al.9 Moreover, Tas et al.10 used immobilized Ru–BINAP in the hydrogenation of geraniol. Ru(OCOR)2(BINAP) was used in the enantioselective hydrogenation of geraniol in methanol under H2 (30–100 bar) at room temperature, which gave citronellol in nearly quantitative yield and with 96–99% enantiomeric excess.3 Ru(II) dicarboxylate complexes containing BINAP ligands were used in methanol, 30 bar hydrogen at 18–20 °C, which gave citronellol with 96–99% enantiomeric excess.4 In ref. 5 Ru(OCOCH3)2[(R)-BINAP] was used in methanol, under 100 bar hydrogen at 20 °C, which gave 95–96% enantiomeric excess. [RuCl2(S)-tolyl-BINAP]2*N(C2H5)3 was used in ref. 6 using methanol as solvent under 8 bar H2 at 20 °C, which gave 93% enantiomeric excess. [RuCl2(benzene)]2/(S)-BINAP gave 97% enantiomeric excess in methanol under 100 bar hydrogen at 0 °C.9
In this paper, the influence of solvent (methanol, ethanol, 1-propanol, and 2-propanol), catalyst (R-Ru(OAc)2(BINAP), R-Ru(OAc)2(T-BINAP), and R-RuCl[(p-cymene)(BINAP)]Cl) and hydrogen pressure (5–40 bar) on the conversion, selectivity to citronellol and enantioselectivity has been studied. A kinetic model was proposed for the hydrogen influence, and parameter estimation was performed.
2. Experimental
Experiments were carried out in a 300 ml autoclave (Parr Instruments). Geraniol (98%, Aldrich), methanol (>99.8%, J.T. Baker), ethanol (99.5%, Etax Aa, Altia), 1-propanol (>99%, J.T. Baker), 2-propanol (>99.8%, Sigma-Aldrich) and hydrogen (99.999%, AGA) were used without further purification. The catalysts R-Ru(OAc)2(BINAP), R-Ru(OAc)2(T-BINAP) and R-RuCl[(p-cymene)(BINAP)]Cl were purchased from Aldrich. The reactant concentration was 0.02 M and the amount of catalyst in the experiments was 0.12 mmol. The catalyst was inserted into the reactor, which was thereafter closed and flushed with hydrogen for 5 min. 70 ml of the solvent was injected into a bubbling unit and hydrogen was bubbled through for 5 min. The solvent was led to the reactor and the catalyst was stirred (1650 rpm) and dissolved in the solvent in situ at the reaction temperature of 60 °C for 2 h under hydrogen. The reactant in 30 ml solvent was injected into the bubbling unit and hydrogen was bubbled through for 5 min. The reactant solution was led to the reactor, the reaction time was set to zero and the reaction was started.
Samples were taken at different time intervals and analyzed by a gas chromatograph (GC). The samples were prepared for GC using 0.5 ml of the sample taken from the reactor and to this 0.5 ml of an internal standard, consisting of 0.02 M cyclohexanone in cyclohexane, was added. An aliquot of 1 μl of the sample was injected with an autosampler into the GC. The injector temperature was 220 °C and the split ratio 50![[thin space (1/6-em)]](https://www.rsc.org/images/entities/char_2009.gif) :
:![[thin space (1/6-em)]](https://www.rsc.org/images/entities/char_2009.gif) 1. A Supelco B-Dex-225 column was used with the helium gas flow of 0.9 ml min−1. The following temperature program was applied: 78 °C for 85 min, 1 °C min−1 to 90 °C and 10 °C min−1 to 165 °C for 10 min. The flame ionization detector (FID) was kept at 300 °C.
1. A Supelco B-Dex-225 column was used with the helium gas flow of 0.9 ml min−1. The following temperature program was applied: 78 °C for 85 min, 1 °C min−1 to 90 °C and 10 °C min−1 to 165 °C for 10 min. The flame ionization detector (FID) was kept at 300 °C.
3. Results and discussion
The reaction scheme is presented in Fig. 1. Geraniol is hydrogenated to (R)- and (S)-citronellol, which are further hydrogenated to (R)- and (S)-3,7-dimethyl octanol. Moreover, some dehydrogenation to E-citral (geranial) also occurred. The hydrogenation reaction was performed using the R-enantiomer of ruthenium BINAP catalysts and the major enantiomer formed was the S-enantiomer in line with literature data.3,4 The enantiomeric excess ee is defined as| |  | (1) |
3.1. Influence of solvent
The influence of solvent on the reaction rate and enantiomeric excess was studied with R-Ru(OAc)2(BINAP) using methanol, ethanol, 1-propanol and 2-propanol. As seen from Fig. 2a, the conversion decreased in the order methanol > ethanol > 1-propanol > 2-propanol. The selectivity to citronellol (COL, Fig. 2b) and the enantiomeric excess (Fig. 2c) were the same for all solvents, slightly increasing with conversion, thereafter being constant. The initial rate of hydrogenation of geraniol as a function of relative permittivity (“dielectric constant”, from ref. 11) is shown in Fig. 3a. The initial reaction rate increases with relative permittivity. Such dependence could be analysed using the Kirkwood treatment. The Kirkwood expression11 relates the standard Gibbs free energy of transfer of a spherical dipolar molecule of radius r and dipole moment μ from the gas phase (εr = 1) to a continuous medium (with εr > 1) according to| |  | (2) |
where ε0 is the permittivity of vacuum and NA is the Avogadro's constant. Applying Kirkwood's formula to the transition-state theory for the bimolecular reaction A + B ↔ (AB)≠ → C + D and combining eqn (2) with the following eqn.| |  | (3) |
one obtains an expression for the rate constant of a reaction between two dipolar molecules A and B with moments μA and μB to form an activated complex with dipole moment μ≠| |  | (4) |
where k is the rate constant in the medium of relative permittivity εr, and k0 is the rate constant in a condensed medium with εr = 1 predicting that if the activated complex is more dipolar than the reactants, the rate of the reaction increases with the relative permittivity of the medium.11 This would mean that in our case the activated complex was more dipolar than geraniol. The natural logarithm of the initial rate as a function of (ε − 1)/(2ε + 1) for the different solvents is plotted in Fig. 3b and this relationship gives a straight line.
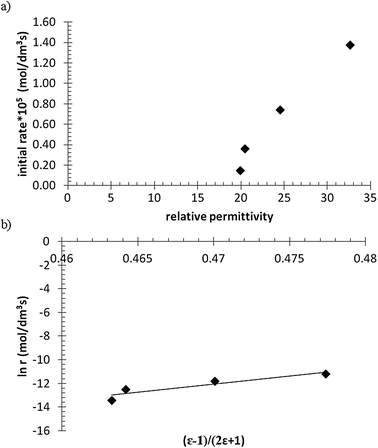 |
| | Fig. 3 The initial rate (at 10 min) of the hydrogenation of geraniol as a function of relative permittivity; (a) rate versus relative permittivity and (b) natural logarithm of rate versus (ε − 1)/(2ε + 1). | |
3.2. Influence of catalyst
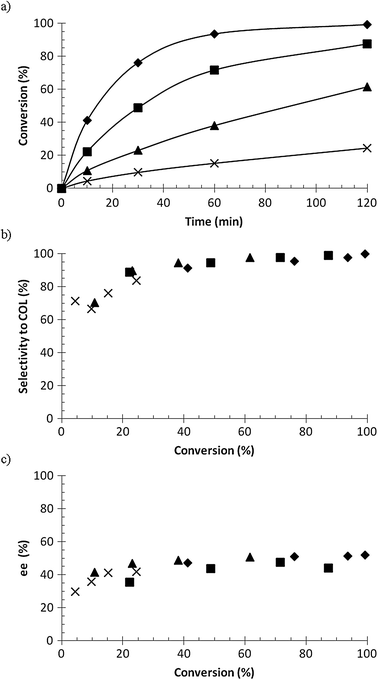
Three different Ru–BINAP catalysts were used in the hydrogenation of geraniol, namely R-Ru(OAc)2(BINAP), R-Ru(OAc)2(T-BINAP), and R-RuCl[(p-cymene)(BINAP)]Cl, and the results are presented in Fig. 4. The conversion as a function of time was more or less the same for all catalysts (Fig. 4a), between 95 and 99% in 2 h, while the selectivity to citronellol (COL) was a little bit lower for R-RuCl[(p-cymene)(BINAP)]Cl in the beginning. The enantiomeric excess of S-COL was highest for R-Ru(OAc)2(T-BINAP), being around 60%, while for the others it was around 50%. As mentioned in the Introduction, the enantiomeric excess achieved in the previous studies was 93–99%.3–9 The temperature used was mostly room temperature and even 0 °C was used. The enantiomeric excess increases when the temperature decreases.6 In this work 60 °C was used in order to have higher reaction rate and to study the kinetics, which – not surprisingly – gave lower values of ee than those reported in the literature.
![Hydrogenation of geraniol to citronellol (COL); (a) conversion versus time, (b) selectivity to citronellol versus conversion, and (c) enantiomeric excess of S enantiomer versus conversion, where ◆ = R-Ru(OAc)2(BINAP), ■ = R-Ru(OAc)2(T-BINAP), ▲ = R-RuCl[(p-cymene)(BINAP)]Cl. Conditions: 0.02 M geraniol in 100 ml methanol, 0.12 mmol catalyst, 60 °C, 10 bar hydrogen pressure.](/image/article/2012/CY/c2cy20249b/c2cy20249b-f4.gif) |
| | Fig. 4 Hydrogenation of geraniol to citronellol (COL); (a) conversion versus time, (b) selectivity to citronellol versus conversion, and (c) enantiomeric excess of S enantiomer versus conversion, where ◆ = R-Ru(OAc)2(BINAP), ■ = R-Ru(OAc)2(T-BINAP), ▲ = R-RuCl[(p-cymene)(BINAP)]Cl. Conditions: 0.02 M geraniol in 100 ml methanol, 0.12 mmol catalyst, 60 °C, 10 bar hydrogen pressure. | |
3.3. Influence of hydrogen pressure
The influence of hydrogen pressure was studied in the range of 5–40 bar and the results are presented in Fig. 5. The conversion increased with the hydrogen pressure up to 30 bar while the same conversion was achieved at 40 bar as at 30 bar (Fig. 5a) indicating a shift to zero order towards hydrogen. The selectivity to COL was a little bit lower at 40 bar than at the other pressures (Fig. 5b) due to the formation of 3,7-dimethyl octanol. The enantiomeric excess of S-COL increased with hydrogen pressure from 41% at 5 bar to 87% at 40 bar (Fig. 5c). Sun et al.6 studied hydrogenation of geraniol from 1 to 7 bar at 20 °C using the [RuCl2(S)-tolyl-BINAP]2*N(C2H5)3 catalyst and observed an increase in enantiomeric excess from around 60% to above 90%. Takaya et al.5 also observed an increase in enantiomeric excess from 70% at 4 bar to 95% at 30 bar at 20 °C using Ru(OCOCH3)2[(R)-BINAP] as a catalyst. In this work, we are giving the kinetic data for different hydrogen pressures and propose a kinetic model with estimated parameters.
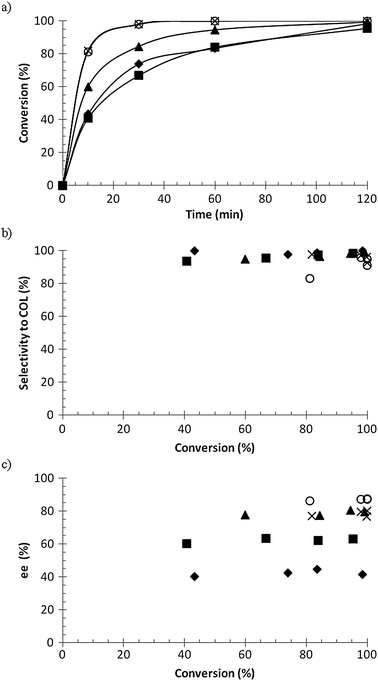 |
| | Fig. 5 Hydrogenation of geraniol to citronellol (COL); (a) conversion versus time, (b) selectivity to citronellol versus conversion, and (c) enantiomeric excess of S enantiomer versus conversion, where ◆ = 5 bar, ■ = 10 bar, ▲ = 20 bar, × = 30 bar, and ○ = 40 bar. Conditions: 0.02 M geraniol in 100 ml methanol, 0.12 mmol R-Ru(OAc)2(T-BINAP), 60 °C. | |
3.4. Kinetic modelling
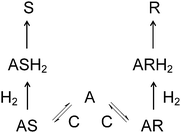
The reaction mechanism presented in Fig. 6 was used in the derivation of the rate equations. This reaction mechanism is based on the original work by Landis and Halpern.12 Components C, A, S, R, AS, AR, ASH2, and ARH2 denote catalyst, geraniol, S-citronellol, R-citronellol, and reaction intermediate species originating from geraniol, catalyst and hydrogen respectively.
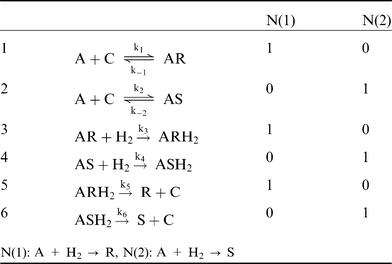
The mechanism can be written in the following form:
The elementary steps above can be described by two different reaction routes, i.e. sets of stoichiometric numbers of the reaction steps. Elementary reactions are grouped in steps and chemical equations of steps contain reactants, reaction intermediate species, and reaction products. A set of stoichiometric numbers of the steps is defined as a reaction route. Reaction routes are essentially different and it is impossible to obtain one route through multiplication of another route by a number, although their respective overall reactions can be identical. The number of basic routes, P, is determined by P = S + W – I, where S is the number of steps, W is the number of balance equations, and I is the number of reaction intermediates. Balance equations can determine the relationship between intermediates. On the right hand side of the equations of the steps, stoichiometric numbers for the two routes are given. These numbers are selected in such a way that the overall chemical equations do not contain intermediates.13,14 According to the rule of Horiuti–Temkin, the number of independent routes can be determined by subtracting from the number of steps equal to 6 in the mechanism above, number of intermediates equal to five (C, AR, AS, ARH2, and ASH2), and adding the number of balance equations. Here there is one balance equation which is related to the concentration of intermediates containing the catalyst complex. Following this rule, it can be concluded that there are two independent reaction routes. The two first steps in the mechanism, describing addition of reactant to catalyst, are reversible. Hydrogen addition steps are irreversible, in accordance with the overall irreversibility.
Parameter estimation.
The mathematical model takes the form| |  | (5) |
| |  | (6) |
| |  | (7) |
Where the rate equations for rA, rR, and rS are given in the Appendix. The rate equations contain k1, k−1, k2, k−2, k3, k4, k5, and k6, which are the kinetic constants to be estimated numerically.
The systems of differential equations (5)–(7) portraying the kinetic model were solved numerically in the parameter estimations with the backward difference method by minimization of the sum of residual squares, SRS, with non-linear regression analysis using the Simplex and Levenberg–Marquardt optimization algorithms implemented in the software Modest.15 The sum of squares was minimized using a step size of 0.1 and a value of 1 × 10⁻⁶ for both the absolute and relative tolerances of the Simplex and Levenberg–Marquardt optimizer, starting with Simplex and thereafter switching to Levenberg–Marquardt.
The closeness of data and model-predicted values were measured with two criteria. If the mechanistic model formally is written
where
s,
yp,
x,
θ, and
c denote the state of the system, response variables, design variables, estimated parameters, and constants, the sum of residual squares is for the observed variables available,
yijk, at experimental points,
xjk, defined by
| |  | (9) |
where
w, giving the weight matrix for the observations, is equal to unity since all the response components are of comparable magnitude. The second criterion of the goodness of the fit of the model was the degree of explanation,
R2,
| |  | (10) |
where
ȳ is the average of the data points.
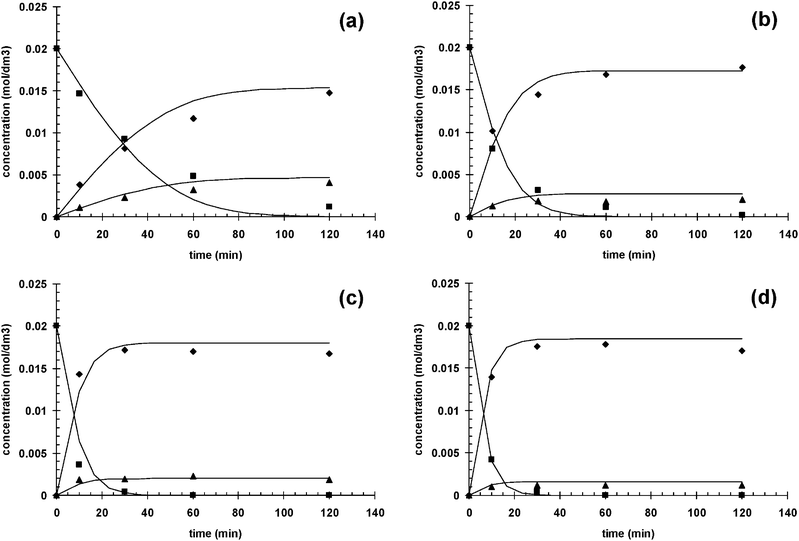
The estimated parameter values are shown in Table 1. The rate constant for the binding of the reactant to the catalyst in the S position is about one order of magnitude larger than for the binding in the R position, meaning that the reactant is attached to the catalyst more easily in the S position, which could be intuitively expected. The binding of hydrogen to the reactant–catalyst complex in the S position is about two orders of magnitude faster compared to the situation when the reactant is in the R position, which means that the former binding is favored. The final step where the different enantiomers are separated from the catalyst takes place at about the same rate. The model had SRS and R2-values of SRS = 0.5333 × 10⁻⁴ and R2 = 97.35%. A comparison of predictions of the kinetic model with experimental data for hydrogenation of geraniol to S-citronellol and R-citronellol is presented in Fig. 7.
Table 1 Values of the estimated parameters
| Parameter |
Estimated value |
| Units: [k1] = [k2] = dm3 mol−1 min−1, [k−1] = [k−2] = [k5] = [k6] = min−1, [k3] = [k4] = bar−1 min−1. SRS = 0.5333 × 10⁻⁴, R2 = 97.35%. |
|
k
1
|
0.137 × 10² |
|
k
−1
|
0.247 × 10⁻⁴ |
|
k
2
|
0.987 × 10³ |
|
k
−2
|
0.417 × 10³ |
|
k
3
|
0.128 × 10⁻¹ |
|
k
4
|
0.200 × 101 |
|
k
5
|
0.947 × 10³ |
|
k
6
|
0.866 × 10³ |
Fig. 8 shows the comparison of experimentally observed ee and model calculated ee values versus the reaction time. Fig. 7 and 8 as well as the parity diagram in Fig. 9 along with statistical data demonstrate that a good data fitting was achieved. As follows from Fig. 8, ee is independent of time (i.e. conversion), which in addition to hydrogen pressure dependence is correctly captured by the proposed kinetic model.
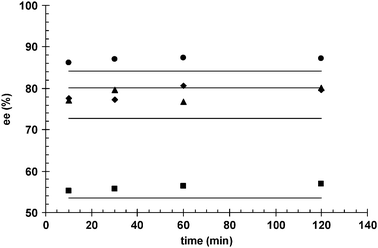 |
| | Fig. 8 Comparison of experimentally observed (markers) and model calculated (solid lines) enantiomeric excess (ee) as a function of reaction time; (■) 10 bar, (◆) 20 bar, (▲) 30 bar, (●) 40 bar. | |
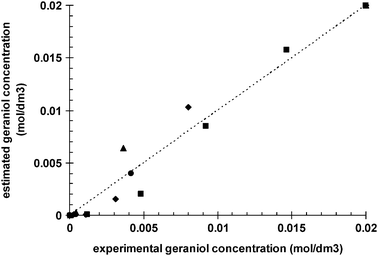 |
| | Fig. 9 Parity diagram comparing observed geraniol concentration with model predicted values; (■) 10 bar, (◆) 20 bar, (▲) 30 bar, (●) 40 bar. | |
4. Conclusions
The hydrogenation of geraniol (3,7-dimethylocta-2,6-dien-1-ol) to citronellol was performed using ruthenium BINAP catalysts in a batch reactor. The influence of solvent was studied demonstrating that the reaction rate decreased in the order methanol > ethanol > 1-propanol > 2-propanol, although the selectivity to citronellol and the enantioselectivity were the same. Three different catalysts were tested (Ru(OAc)2(BINAP), R-Ru(OAc)2(T-BINAP), and R-RuCl[(p-cymene)(BINAP)]Cl) and among them R-Ru(OAc)2(T-BINAP) gave the highest enantioselectivity to S-citronellol. The influence of hydrogen pressure was studied in the range of 5–40 bar, showing that the reaction rate and enantioselectivity increased with hydrogen pressure. A mechanism was proposed and the parameter estimation was performed. The kinetic model described the experimental data well.
Appendix
Rate equations
Speaking in terms of kinetics, the rate equations of each step can be written aswhere r, k, and c denote the reaction rate, rate constant, and concentration of respective species.
The concentrations of the intermediates AR and AS are then obtained by applying steady state approximations according to
| | | k1cAcC − k−1cAR = k3cARcH2 | (A8) |
| |  | (A9) |
| | | k2cAcC − k−2cAS = k4cAScH2 | (A11) |
| |  | (A12) |
Similarly, the concentrations of the intermediates ARH
2 and ASH
2 are obtained according to
| |  | (A15) |
| |  | (A18) |
The overall geraniol consumption rate can be defined as
| | | rA = −r1 − r2 = r5 + r6 = −k1cAcC + k−1cAR − k2cAcC + k−2cAS | (A19) |
The concentrations of the intermediates AR and AS can be eliminated from
eqn (A19) by inserting
eqn (A9) and (A12) into
eqn (A19), which takes the form
| |  | (A20) |
The generation rates of the products R and S are defined by
| |  | (A21) |
| |  | (A22) |
In
eqn (A20)–(A22) it can be seen that
rA = −
rR −
rS. The sum of the concentrations of all the intermediates containing
catalyst as well as the concentration of vacant
catalyst species is equal to the total
catalyst concentration
cC0 according to
| | | cC + cAR + cAS + cARH2 + cASH2 = cC0 | (A23) |
Elimination of the unknown intermediates
cAR,
cAS,
cARH2, and
cASH2 gives
| | 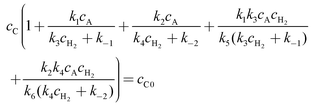 | (A24) |
which allows calculation of
cC| |  | (A25) |
Moreover, the R to S ratio is given by
| |  | (A26) |
which indicates that the selectivities to R and S are hydrogen pressure dependent and conversion independent, in agreement with the experimental data. The concentration of hydrogen in the liquid phase is assumed to be directly proportional to the hydrogen pressure according to Henry's law and due to lack of solubility data, hydrogen pressure was used in the model instead of hydrogen concentration.
The mole balance equation becomes
| |  | (A27) |
Provided that the liquid volume,
VL, remains approximately constant, the amount of substance can be expressed as
| |  | (A28) |
The mole balance equation obtains the form
| |  | (A29) |
Acknowledgements
This work is part of the activities at the Åbo Akademi Process Chemistry Centre within the Finnish Centre of Excellence Programme (2000–2011). Financial support from European Union through the Seventh Framework Programme (Project 246095-2) is gratefully acknowledged.
References
- R. Noyori, Angew. Chem., Int. Ed., 2002, 41, 2008–2022 CrossRef CAS.
- W. S. Knowles, Angew. Chem., Int. Ed., 2002, 41, 1998–2007 CrossRef CAS.
- H. Takaya, T. Ohta, K. Mashima and R. Noyori, Pure Appl. Chem., 1990, 62, 1135–1138 CrossRef CAS.
- H. Takaya, T. Ohta, N. Sayo, H. Kumobayashi, S. Akutagawa, S. Inoue, I. Kasahara and R. Noyori, J. Am. Chem. Soc., 1987, 109, 1596–1597 CrossRef CAS.
- H. Takaya, T. Ohta, S. Inoue, M. Tokunaga, M. Kitamura and R. Noyori, Org. Synth., 1995, 72, 74–85 CAS.
- Y. Sun, J. Wang, C. LeBlond, R. A. Reamer, J. Laquidara, J. R. Sowa Jr. and D. G. Blackmond, J. Organomet. Chem., 1997, 548, 65–72 CrossRef CAS.
- Y. Sun, R. N. Landau, J. Wang, C. LeBlond and D. G. Blackmond, J. Am. Chem. Soc., 1996, 118, 1348–1353 CrossRef CAS.
- Y. Sun, C. LeBlond, J. Wang, D. G. Blackmond, J. Laquidara and J. R. Sowa Jr., J. Am. Chem. Soc., 1995, 117, 12647–12648 CrossRef CAS.
- U. Matteoli, V. Beghetto and A. Scrivanti, J. Mol. Catal. A: Chem., 1999, 140, 131–137 CrossRef CAS.
-
D. Tas, D. Jeanmart, R. F. Parton and P. A. Jacobs, in Heterogeneous Catalysis and Fine Chemicals, ed. H. U. Blaser, A. Baiker and R. Prins, Elsevier Science B.V., 1997 Search PubMed.
-
C. Reichardt, Solvents and solvent effects in organic chemistry, Wiley-VCH, Weinheim, 2003 Search PubMed.
- C. R. Landis and J. Halpern, J. Am. Chem. Soc., 1987, 109, 1746–1754 CrossRef CAS.
- M. I. Temkin, Adv. Catal., 1979, 28, 173–281 CrossRef CAS.
-
D. Yu. Murzin and T. Salmi, Catalytic Kinetics, Elsevier, Amsterdam, 2005 Search PubMed.
-
H. Haario, Modest User's Guide, Helsinki, 2001 Search PubMed.
|
| This journal is © The Royal Society of Chemistry 2012 |
Click here to see how this site uses Cookies. View our privacy policy here. ![[thin space (1/6-em)]](https://www.rsc.org/images/entities/char_2009.gif) :
:![[thin space (1/6-em)]](https://www.rsc.org/images/entities/char_2009.gif) 1. A Supelco B-Dex-225 column was used with the helium gas flow of 0.9 ml min−1. The following temperature program was applied: 78 °C for 85 min, 1 °C min−1 to 90 °C and 10 °C min−1 to 165 °C for 10 min. The flame ionization detector (FID) was kept at 300 °C.
1. A Supelco B-Dex-225 column was used with the helium gas flow of 0.9 ml min−1. The following temperature program was applied: 78 °C for 85 min, 1 °C min−1 to 90 °C and 10 °C min−1 to 165 °C for 10 min. The flame ionization detector (FID) was kept at 300 °C.



![Hydrogenation of geraniol to citronellol (COL); (a) conversion versus time, (b) selectivity to citronellol versus conversion, and (c) enantiomeric excess of S enantiomer versus conversion, where ◆ = R-Ru(OAc)2(BINAP), ■ = R-Ru(OAc)2(T-BINAP), ▲ = R-RuCl[(p-cymene)(BINAP)]Cl. Conditions: 0.02 M geraniol in 100 ml methanol, 0.12 mmol catalyst, 60 °C, 10 bar hydrogen pressure.](/image/article/2012/CY/c2cy20249b/c2cy20249b-f4.gif)

