Preparation of hierarchical dandelion-like CuO microspheres with enhanced catalytic performance for dimethyldichlorosilane synthesis
Received
4th April 2012
, Accepted 13th May 2012
First published on 14th May 2012
Abstract
Hierarchical dandelion-like CuO (HD–CuO) microspheres composed of nanoribbons were prepared via a facile hydrothermal method. The samples were characterized by nitrogen adsorption, X-ray diffraction, temperature-programmed reduction, thermogravimetric analysis, transmission electron microscopy and scanning electron microscopy. It was found that the reaction temperature, reaction time and reagent amounts had a significant effect on the morphology and structure of HD–CuO. The obtained HD–CuO microspheres possessed a surface area of 10.6–57.5 m2 g−1 and a diameter of 3–6 μm. In the formation process, ethylene glycol was adsorbed on the surface of the CuO nanoribbons and it acted as the structure-directing agent and thereafter the CuO nanoribbons were self-assembled into HD–CuO. The investigation of the Rochow reaction showed that the HD–CuO catalyst had a better catalytic performance in dimethyldichlorosilane synthesis than the commercial CuO microparticles and commercial CuO–Cu2O–Cu catalyst, owing to its well-developed hierarchically porous structure and higher specific surface area, leading to the increased contact interface among reaction gas, solid catalyst and solid silicon, together with enhanced mass transportation.
1. Introduction
Hierarchically porous materials1,2 have been widely applied in various fields such as adsorption,3 dye-sensitized solar cells,4 gas sensors,5 catalysis,6,7 optoelectronic devices,8 electrochemical energy storage,9 and supercapacitors,10 because of their inherent large surface-to-volume ratio and abundant porous structures. Template methods including those of hard and soft template routes are often used to prepare these hierarchically structured materials,11–13 but they often suffer from complicated experimental procedures and require the use of toxic chemicals, e.g., using HF to remove the templates,14,15 limiting their application to large-scale production. Thus, development of template-free synthesis for these hierarchically porous materials becomes very attractive.16,17
Synthesis of transition metal oxides with hierarchical structures is of great interest because their physical and chemical properties may be influenced by their morphologies,18,19 structures,20,21 and crystallographic forms,22 and when used as catalysts, these hierarchical structures can effectively prevent pressure build-up in reactors. Hierarchical copper oxide (CuO) nano/microstructures, assembled from building blocks of nanoribbons,23 nanowires,24 nanorods,25 nanobelts,26 nanosheets27,28 and complex nanocrystals with well-defined shape and inner structure29,30 have been synthesized and reported, such as prickly CuO microspheres prepared using copper chloride, NaOH and Na2(C4H4O6) as starting materials in aqueous solution,31 single-crystalline monodispersed CuO nanorods synthesized by wet-chemical methods in water–ethanol mixed solvents,32 colloidal CuO nanocrystallites by solvothermal methods between 150–180 °C for 20–40 h in N,N-dimethylformamide,33 CuO nanowires obtained by heating copper substrates in air,34 chiral CuO films on single-crystal Cu (111) by electrodeposition methods,35 dumbbell-like architectures CuO achieved via the hydrophobic interaction of adsorbed hydrocarbon chains,36 flower-like CuO nanorod arrays by a one-step solution-immersion process,37 and single-crystalline submicrometer CuO ribbons prepared on a copper surface by a oxidation–dehydration process,38etc. However, successfully preparing hierarchically porous CuO with a high surface area is rare, although CuO is widely used in gas sensors,27 Li-ion electrode materials,28,39,40 CO oxidation,41 and catalysis.42–44 Also, metallic Cu45 and Cu compounds such as Cu2O,46,47 CuO,48,49 Cu–Cu2O–CuO composite,50 and CuCl251 have been found to be active copper catalysts for the Rochow reaction,52 which is a synthetic route to produce methylchlorosilanes (MCS) using Si to react with chloromethane (MeCl). These copper-based catalysts typically have dense and irregular structures.53 Because of the inherent advantages of the catalysts with porous hierarchical structures,54,55 herein we report the synthesis and use of novel hierarchically porous copper-based catalysts for the MCS synthesis.
In our previous work, we investigated the application of porous cubic Cu,56 mesoporous Cu2O,46 and flower-like CuO47 as model copper-based catalysts, together with the use of promoters,57 in dimethyldichlorosilane synthesis via the Rochow reaction. Better catalytic performances on these materials were observed than that of their non-porous counterparts, although the prepared flower-like hierarchical CuO was composed of larger nanoplates and had a relatively lower surface area. In this work, we report the preparation of hierarchical dandelion-like CuO (HD–CuO) microspheres composed of nanoribbons with a much greater surface area via a hydrothermal method in the presence of ethanol and ethylene glycol solutions. Compared to the commercial CuO microparticles and CuO–Cu2O–Cu catalyst, HD–CuO shows a better catalytic performance in dimethyldichlorosilane synthesis via the Rochow reaction. Even when compared to our previous flower-like CuO,47 HD–CuO shows a better Si conversion and a little higher dimethyldichlorosilane selectivity, suggesting that surface area has an important influence on the Si conversion.
2. Experimental
2.1. Material synthesis
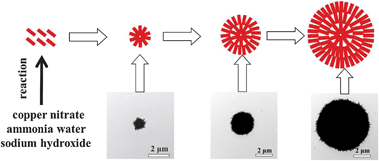
HD–CuO microspheres were prepared by a hydrothermal method. To optimize the synthesis conditions and investigate the product formation process, synthesis parameters such as the reaction temperature, time, reactant amount and volume ratio were varied, which are listed in Table 1. In a typical synthesis (sample S6 in Table 1), 40.0 mL of pure alcohol (CH3CH2OH, A.R., Sinopharm Chemical Reagent Co., Ltd) and 12.0 mL of ethylene glycol (C2H6O2, A.R., Sinopharm Chemical Reagent Co., Ltd) (EG) were mixed, followed by the addition of 1.00 g of copper nitrate (Cu(NO3)2·H2O, A.R., Sinopharm Chemical Reagent Co., Ltd), 30 mL of ammonia water (25%) (NH3·H2O, A.R., Sinopharm Chemical Reagent Co., Ltd) and 10 mL of sodium hydroxide (1 mol L−1) (NaOH, A.R., Sinopharm Chemical Reagent Co., Ltd). After stirring for 10 min to form a clear solution, the resulting solution was transferred into a 100 mL stainless-steel autoclaves lined with poly(tetrafluoroethylene) (PTFE, Telfon). The autoclave was sealed and maintained at 130 °C for 16 h and then cooled down to room temperature. The resulting precipitate solid was collected by centrifugation, washed with distilled water and absolute ethanol and finally dried in vacuum at 60 °C for 8 h. 30 mL of ammonia–water (25%), 40.0 mL of alcohol and 10 mL of sodium hydroxide (1 mol L−1) were constant for all sample synthesis.
Table 1 The synthesis conditions used for preparing CuO microspheres
| Sample |
Copper nitrate/g |
EG/ml |
Reaction T/°C |
Reaction time/h |
| S1 |
1.0 |
0 |
130 |
16 |
| S2 |
1.0 |
2 |
130 |
16 |
| S3 |
1.0 |
5 |
130 |
16 |
| S4 |
1.0 |
7 |
130 |
16 |
| S5 |
1.0 |
10 |
130 |
16 |
| S6 |
1.0 |
12 |
130 |
16 |
| S7 |
1.0 |
15 |
130 |
16 |
| S8 |
1.0 |
12 |
130 |
6 |
| S9 |
1.0 |
12 |
130 |
10 |
| S10 |
1.0 |
12 |
130 |
36 |
| S11 |
0.5 |
12 |
130 |
16 |
| S12 |
2.0 |
12 |
130 |
16 |
| S13 |
4.0 |
12 |
130 |
16 |
| S14 |
1.0 |
12 |
80 |
16 |
| S15 |
1.0 |
12 |
100 |
16 |
| S16 |
1.0 |
12 |
160 |
16 |
| S17 |
1.0 |
12 |
180 |
16 |
| S18 |
1.0 |
12 |
200 |
16 |
| S19 |
1.0 |
12 |
220 |
16 |
2.2. Characterization
X-ray diffraction (XRD) patterns were recorded on a PANalytical X'Pert PRO MPD using the Kα radiation of Cu (λ = 1.5418 Å). The crystal size of the sample was calculated using the Debye–Scherrer equation. The microscopic feature of the samples was observed by field-emission scanning electron microscopy (SEM) (JSM-6700F, JEOL, Tokyo, Japan) and transmission electron microscopy (TEM) (JEM-2010F, JEOL, Tokyo, Japan). The porous nature of the samples was investigated using physical adsorption of N2 at the liquid-nitrogen temperature (−196 °C) on an automatic volumetric sorption analyzer (NOVA3200e, Quantachrome). Prior to the measurement, the sample was degassed at 200 °C for 5 h under vacuum. The specific surface area was determined according to the Brunauer–Emmett–Teller (BET) method in the relative pressure range of 0.05–0.2. The pore size distribution (PSD) curve was derived from the Barrett–Joyner–Halenda (BJH) method using an adsorption branch. The pore size was estimated from the maximum position of the BJH-PSD curve. Temperature programmed reduction (TPR) measurements were carried out on Automated chemisorption analyzer (ChemBET pulsar TPR/TPD, Quantachrome). Upon loading of 0.10 g of HD–CuO into a quartz U-tube, the sample was degassed at 200 °C for 30 min under helium. When the temperature dropped to 20 °C, the gas was changed to 9.9% H2/Ar. Finally, the sample was heated from 20 °C to 800 °C with 10 °C min−1 in 9.9% H2/Ar with a gas flow of 30 mL min−1.
2.3. Measurement of catalytic properties
The evaluation of the catalysts was carried out on a typical MCS lab fixed-bed reactor.48 10.00 g of Si powder (20–50 mesh, provided by Jiangsu Hongda New Material Co., Ltd) and 1.00 g of HD–CuO (commercial CuO or commercial catalyst, provided by Jiangsu Hongda New Material Co., Ltd) together with 0.10 g of Zinc (Zn, A.R., Sinopharm Chemical Reagent Co., Ltd) promoter were mixed homogeneously to form a contact mass, which was then loaded in the glass reactor. The reactor system was purged with purified N2 for 0.5 h and then heated to 325 °C within 1 h under a N2 flow rate of 25 mL min−1. Subsequently, N2 was turned off and MeCl gas with a flow rate of 25 mL min−1 was introduced into the reactor to react with Si at 325 °C. After a given period of 24 h, the reaction was stopped. The gas product was cooled to the liquid phase with the circulator bath controlled at 5 °C by a programmable thermal circulator (GDH series, Ningbo xinzhi biological technology Co., LTD). The waste contact mass (solid residue after reaction) containing unreacted Si powder and Cu + Zn compounds was weighed to calculate the Si conversion. The liquid phase collected in a glass container was analyzed with an Agilent Technologies 7890A GC System. The Rochow reaction is shown in formula (1) as follows:| |  | (1) |
In this reaction, the products mainly consist of methyltrichlorosilane (CH3SiCl3, M1), dimethyldichlorosilane ((CH3)2SiCl2, M2) and trimethylchlorosilane ((CH3)3SiCl, M3), which normally account for more than 95 wt % of the total reaction products.58 Among the three silane products, M2 is the most desired monomer, which is used to synthesize organosilicon products in industry. Thus, for simplification of the calculation, other trace products and the change of catalyst weight will be ignored and Mi (i = 1, 2, 3) selectivity and Si conversion can be derived from the following formulas:| |  | (2) |
| |  | (3) |
3. Results and discussion
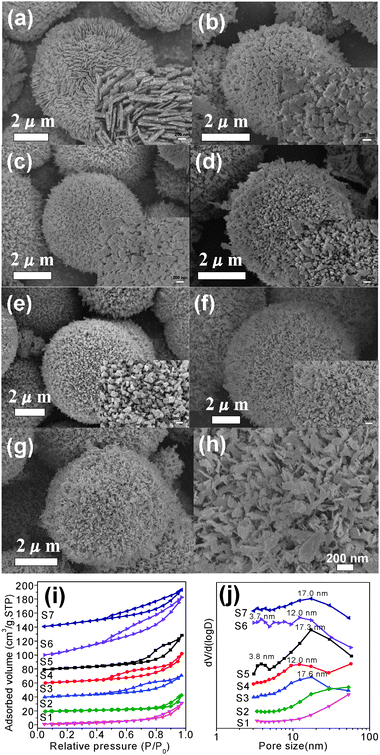
Fig. 1a shows the XRD pattern of HD–CuO (S6 in Table 1), indicating the formation of monoclinic symmetry CuO (JCPDS No.089-5896). The N2 adsorption/desorption isotherm is presented in Fig. 1b and it exhibits hysteresis loops in the relative pressure range of 0.4–1.0, which belong to the type-IV. Its BET surface area is 57.5 m2 g−1 for S6 and the PSD curve in the inset of Fig. 1b demonstrates the presence of a porous structure for S6. The SEM image of Fig. 1c shows that the HD–CuO (S6) with a size of 3–6 μm are uniform microspheres. Fig. 1d shows that the HD–CuO are porous and are assembled by nanoribbons, several tens of nanometers in size. Fig. 1e shows the internal structure of HD–CuO, which are assembled by hierarchical CuO nanoribbons. The surface of HD–CuO is assembled by uniform CuO nanoribbons about 20–100 nm in size as shown in Fig. 1f. Fig. 1g shows a TEM image of S6, which is dense and has a size of about 5 μm. Fig. 1h presents the TEM image of the CuO nanoribbons, which are the building blocks about 20 nm in width. Fig. 1i reveals the HRTEM image on the edge of the nanoribbons, showing a lattice plane distance of 0.25 nm, which is in agreement with the (−111) plane distance of monoclinic CuO. Previous work has demonstrated that the parameters for synthesizing nanostructured CuO such as temperature, time and reactant concentration have strong effects on the resulting morphology and pore structure of the products.59–61 Therefore, to obtain HD–CuO microspheres with high surface area and uniform morphology, we systematically investigated these parameters and proposed a formation mechanism of HD–CuO microspheres.
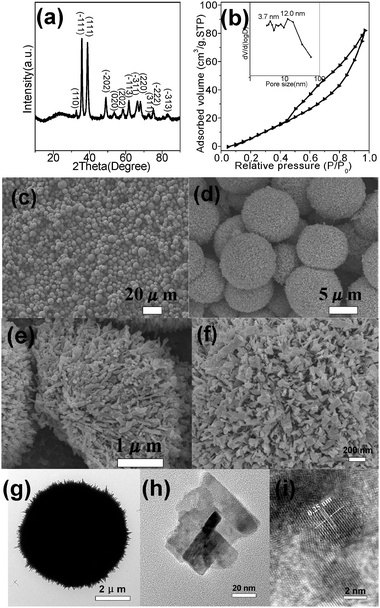 |
| | Fig. 1 Characterization of HD–CuO (sample S6 in Table 1): (a) XRD pattern, (b) N2 adsorption–desorption isotherm (inset is its BJH-PSD curve), (c, d) SEM images with different magnifications, (e) SEM image of the internal structure, (f) SEM image of the surface structure, (g) TEM image of single microsphere, (h) TEM image of CuO nanoribbon and (i) HRTEM image on the edge of CuO nanoribbon. | |
3.1. Effect of the EG amounts
In our previous work,46 we found that EG could be adsorbed on the surface of the nanoparticles and act as a structure-directing agent to regulate the surface state of the nanoparticles, leading to the formation of the porous structure. So we added EG to the reaction solution based on our experience of preparing the flower-like CuO and obtained hierarchical and porous HD–CuO with a higher surface area. The EG amounts added influence the morphology, nanoparticles size and the hierarchical porous structure of HD–CuO.
Fig. 2 shows the SEM images of HD–CuO prepared with different EG amounts. It was seen that, when EG was not added (S1), the morphology of S1 shown in Fig. 2a was that of CuO microspheres with a hierarchical structure composed of nanoplates of 200–1000 nm in size (inset of Fig. 2a). Increasing the EG amount to 2.0 ml (S2), the microsphere becomes a dandelion-like structure as shown in Fig. 2b, which consists of a large number of nanosheets of 100–300 nm in size (inset of Fig. 2b). With the addition of 5.0 ml of EG (S3), the HD–CuO microspheres were formed with small nanosheets 100–200 nm in size (inset of Fig. 2c), as shown in Fig. 2c. By further increasing the EG amounts to 7.0 ml (S4), 10.0 ml (S5), 12 ml (S6) and 15 ml (S7), the obtained HD–CuO microspheres were composed of nanoribbons of 100–200, 50–150, 100–200 and 50–150 nm in size, as shown in Fig. 2d–f and h and their insets respectively. When the EG amount was increased to 20.0 ml, there was very little solid product after the reaction. The N2 adsorption/desorption isotherms are presented in Fig. 2i and they exhibit hysteresis loops in the relative pressure range of 0.7–1.0, which belong to type-IV. The BET surface areas are 10.6 m2 g−1 for S1, 14.7 m2 g−1 for S2, 25.9 m2 g−1 for S3, 31.1 m2 g−1 for S4, 38.4 m2 g−1 for S5, 57.5 m2 g−1 for S6 and 47.6 m2 g−1 for S7. The PSD curves in Fig. 2j show that the pore size distributions at the maxima for S3 to S7 are 17.6, 12.0, 3.8 and 17.3, 3.7 and 12.0 and 17.0 nm, respectively, suggesting porous structures, but not for S1 and S2 as their pore sizes are larger than 50 nm. Therefore, 10.0–15.0 ml of EG is better for obtaining hierarchical and porous HD–CuO microspheres with high surface areas.
 |
| | Fig. 2 SEM images of products obtained with different EG amounts: (a) 0 ml (S1), (b) 2.0 ml (S2), (c) 5.0 ml (S3), (d) 7.0 ml (S4), (e) 10.0 ml (S5), (f) 12.0 ml (S6), (g) 15.0 ml (S7), (h) surface of CuO microspheres (S7) (insets are their high-magnification SEM images on the surface of CuO microspheres); (i) N2 adsorption–desorption isotherms of CuO samples S1–S7 (For clarity, the isotherm of S2–S7 was vertically shifted for 20, 40, 60, 80, 100 and 140 cm3 g−1, respectively) and (j) BJH-PSD curves of CuO samples S1–S7. | |
3.2. Effect of the reaction time
Fig. 3 shows the SEM images of the HD–CuO microspheres obtained at different reaction times. The HD–CuO microspheres (S8) prepared at 6 h are not uniform in size (Fig. 3a), which falls in the range of 2–6 μm and are composed of nanoribbons. Upon further extending the reaction time to 10 h (S9), as shown in Fig. 3b, there is no obvious change in morphology, which still consists of small nanoribbons, but with a slight increase in size. When the reaction is prolonged to 16 h (S6), as can be seen in Fig. 3c, the diameter of the S6 microspheres becomes 3–6 μm. After 36 h of the reaction (S10), there is no further obvious change in morphology as shown in Fig. 3d, but the CuO microspheres become much larger. It should be pointed out that, when the reaction time is less than 6 h, there is very little solid product, and there is also no obvious change in morphology with further increases in the reaction time (not shown here) to above 36 h as compared to S10.
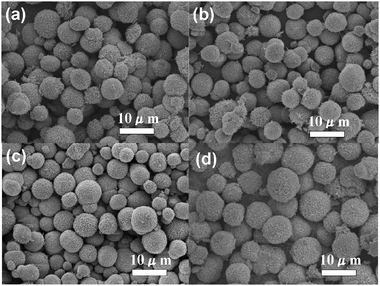 |
| | Fig. 3 SEM images of CuO microspheres obtained at different reaction times: (a) 6 h (S8), (b) 10 h (S9), (c) 16 h (S6) and (d) 36 h (S10). | |
3.3. Effect of copper nitrate
Fig. 4 reveals the SEM images of HD–CuO microspheres prepared with different amounts of copper nitrate. When 0.5 g of copper nitrate was added (S11), incomplete and non-uniform HD–CuO microspheres were obtained (Fig. 4a). By further increasing the copper nitrate to 1.0 g (S6), the HD–CuO microspheres become more uniform but loosely packed (Fig. 4b). With the addition of 2.0 g of copper nitrate (S12), the HD–CuO microspheres formed were more severely aggregated with less homogeneity in size, as shown in Fig. 4c. Finally, by further increasing the copper nitrate amount to 4.0 g (S13), the aggregation in the obtained HD–CuO microspheres became more severe than that in samples S12 and S6, as shown in Fig. 4d.
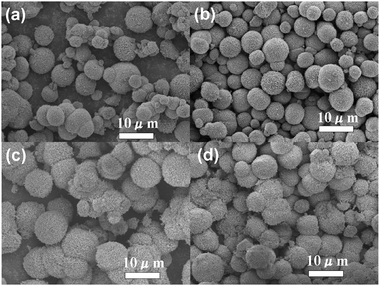 |
| | Fig. 4 SEM images of the CuO microspheres obtained using different amount of copper nitrate: (a) 0.5 g (S11), (b) 1.0 g (S6), (c) 2.0 g (S12) and (d) 4.0 g (S13). | |
3.4. Effect of reaction temperature
Fig. 5a shows the XRD patterns of the products obtained at different reaction temperatures. For the samples obtained at the low reaction temperatures of 80, 100, 130, 160 and 180 °C, diffraction peaks at 2θ values of 35.7, 39.0, 49.2, 61.8, 66.2, 68.4 and 75.4° were observed, which correspond to the lattice planes of (−111), (111), (−202), (−113), (022), (220) and (004), respectively, in monoclinic CuO (JCPDS No.089-5896). At the reaction temperature of 200 °C, the observed diffraction peaks located at 2θ values of 36.5, 42.2, 61.3 and 73.3, corresponding to the lattice planes of (111), (200), (220) and (311) in cubic Cu2O (JCPDS No. 03-0892). In addition, some other peaks at 2θ values of 43.3, 50.5 and 74.2° were also observed in this sample, which corresponded to the lattice planes of (111), (200) and (220) of the cubic symmetry Cu (JCPDS No. 01-070-3039). Therefore, a mixture of Cu2O and Cu was obtained at this reaction temperature. Further increasing the temperature to 220 °C, the sole product was that of metallic Cu with cubic symmetry, evidenced by the observation of diffraction peaks at 2θ values of 43.3, 50.5 and 74.2°, respectively (JCPDS No. 01-070-3039). The morphologies of these samples were observed by SEM. The sample S14 obtained at 80 °C had a microspherical morphology with a size distribution of 4–8 μm (Fig. 5a). These microspheres were assembled together, composed of looser nanoparticles and had porous structure. For the samples obtained at 100 °C (S15) and 130 °C (S6), respectively, as shown in Fig. 5c and d, non-uniform CuO microspheres were formed but it seems S6 was more uniform in size and more closely packed. With further increase of the reaction temperature to 160 °C (S16) and 180 °C (S17), the microspherical morphology of CuO degraded and some irregular microspheres appeared, as shown in Fig. 5e and f. However, when the reaction temperature reached 200 °C, the obtained sample S18 consisted of both microparticles and polyhedral Cu2O and Cu composites (XRD partterns of Fig. 5a), as shown in Fig. 5g. Further increasing the temperature to 220 °C, the obtained sample S19 is pure phase Cu microparticles (XRD partterns of Fig. 5a), as shown in Fig. 5h. Clearly, there were phase changes for the CuO samples, which were reduced to Cu2O and Cu composites at the reaction temperature of 200 °C and finally to metallic Cu at the reaction temperature of 220 °C.
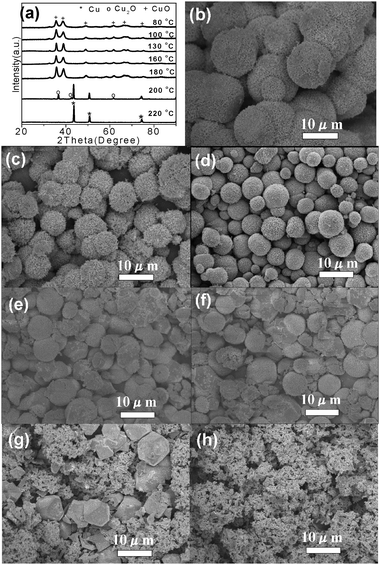 |
| | Fig. 5 XRD patterns of the products obtained at different reaction temperatures (a), SEM images of products obtained at different reaction temperatures: (b) 80 °C (S14), (c) 100 °C (S15), (d) 130 °C (S6), (e) 160 °C (S16), (f) 180 °C (S17), (g) 200 °C (S18) and (h) 220 °C (S19). | |
The reactions involved in the formation of HD–CuO microspheres are shown in eqn (1) and (2).
| | | Cu2+ + 4 NH3·H2O → (Cu(NH3)4)2+ + 4 H2O | (1) |
| | | (Cu(NH3)4)2+ + 2 OH− → 4 NH3↑ + CuO↓ + H2O | (2) |
In these reactions, (Cu(NH3)4)2+ was first generated by the reaction of copper nitrate and ammonia water (eqn (1)).62 The (Cu(NH3)4)2+ species then reacted with sodium hydroxide at a certain temperature to form CuO nanoribbons (eqn (2)).30 In our previous work,47 we proposed that the formation process of the flower-like CuO is as follows: at the first stage, small CuO nanoplates are formed via the aggregation of CuO nanoparticles. These small CuO nanoplates self-assemble into small flower-like CuO; at the subsequent second stage, the initially formed small flower-like CuO particles grow into large flower-like CuO composed of large thin CuO nanoplates; at the third stage, with the further proceeding of the reaction, more generated CuO nanoparticles are deposited on the CuO nanoplates, leading to the formation of larger flower-like CuO through Ostwald ripening,63 and an increase of the thickness of the CuO nanoplates in the flower-like CuO microspheres. For the HD–CuO microspheres, a new formation process is proposed, as shown in Fig. 6. In the early stage, CuO nanoribbons are formed via the reaction of Cu2+, NH3·H2O and OH− ions, which further self-assemble into small HD–CuO microspheres. The small HD–CuO microspheres further go up in size via the deposition of more CuO nanoparticles, which eventually form the larger HD–CuO microspheres. In this process, ethylene glycol should have been adsorbed on the surface of the CuO nanoparticles acting as a structure-directing agent to regulate the surface state of the nanoparticles. The surface modification of these small molecules will have an impact on the nucleation and aggregation process of the nanoparticles, which finally leads to the formation of porous hierarchical structures.64,65 As observed above, in the absence of ethylene glycol, the formed CuO microspheres are composed of larger nanoplates with low surface area (Fig. 2a), while in the presence of ethylene glycol, the formed HD–CuO microspheres are composed of porous hierarchical CuO nanoribbons.
 |
| | Fig. 6 Possible formation process of obtained HD–CuO microspheres composed of nanoribbons. | |
Table 2 shows the catalytic performance of the commercial CuO microparticles and Cu–Cu2O–CuO catalyst, as well as HD–CuO microspheres for the Rochow reaction. At 325 °C, the commercial Cu–Cu2O–CuO catalyst shows a Si conversion (Csi) of 41.8%, and for HD–CuO samples, the Csi is 30.0% for S1, 33.2% for S3, 38.6% for S5 and 41.6% for S6, while that of the commercial CuO is 15.0% only. More importantly, the commercial Cu–Cu2O–CuO catalyst and HD–CuO show high M2 selectivities (SM2), that is 81.5% for the former and 83.3% for S1, 84.8% for S3, 86.6% for S5 and 86.7% for S6, much higher than that of the commercial CuO microparticles (51.9%). Comparing HD–CuO S6 and CuO S1, the former has a Si conversion of 41.6%, a M2 selectivity of 86.7% and a surface area of 57.5 m2 g−1, while that of the latter is 30.0%, 83.3% and 10.6 m2 g−1, respectively, which is higher than commercial Cu–Cu2O–CuO catalyst (1.6 m2 g−1) and commercial CuO (0.2 m2 g−1). This implies the importance of surface area. For the S1, S3, S5 and S6 samples, the Si conversion, M2 selectivity and specific surface area increase in the sequence of S1 < S3 < S5 < S6, further suggesting that the surface area of CuO samples has an important influence on the Si conversion and M2 selectivity, although the increment is small. The Si conversion of HD–CuO is lower than that of commercial Cu–Cu2O–CuO catalyst. This is because the commercial Cu–Cu2O–CuO catalyst contains multiple copper components such as Cu, Cu2O and CuO, together with other promoters such as Sn and P,68 which could increase the Si conversion.
Table 2 Catalytic performance of commercial catalyst, CuO (S1, S3, S5 and S6) microspheres and commercial CuO for Rochow reaction
| Catalyst |
S
M1 (%) |
S
M2 (%) |
S
M3 (%) |
C
Si (%) |
| Commercial catalyst |
15.7 |
81.5 |
2.8 |
41.8 |
| HD–CuO(S1) |
15.1 |
83.3 |
1.6 |
30.0 |
| HD–CuO (S3) |
13.7 |
84.8 |
1.5 |
33.2 |
| HD–CuO (S5) |
12.5 |
86.6 |
1.9 |
38.6 |
| HD–CuO (S6) |
13.1 |
86.7 |
1.2 |
41.6 |
| Commercial CuO |
46.6 |
51.9 |
1.5 |
15.0 |
The SEM images of the commercial Cu–Cu2O–CuO catalyst, HD–CuO (S6) and commercial CuO are shown in Fig. 7. The commercial Cu–Cu2O–CuO catalyst is composed of Cu–Cu2O–CuO microparticles with diameters in the range of 1–5 μm (Fig. 7a). HD–CuO (S6) are porous hierarchical microspheres with diameters in the range of 3–6 μm (Fig. 7b). And the commercial CuO is composed of CuO microparticles with a size range of 1–20 μm (Fig. 7c).
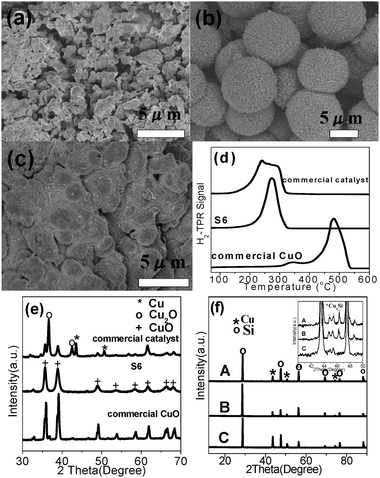 |
| | Fig. 7 SEM images of commercial Cu–Cu2O–CuO catalyst (a), HD–CuO (S6) (b) and commercial CuO (c), H2-TPR curves (d) and XRD patterns (e) of commercial Cu–Cu2O–CuO catalyst, HD–CuO (S6) and commercial CuO, XRD patterns of contact masses after reaction (f) (A: commercial Cu–Cu2O–CuO catalyst + Si, B: HD–CuO (S6) + Si and C: commercial CuO + Si) (inset is enlarged view in the 2θ angle range of 40–50°). | |
Fig. 7d shows the H2-TPR curves of the three samples. For the commercial Cu–Cu2O–CuO catalyst sample, the H2 consumption peak is located between 150–300 °C and for HD–CuO (S6) sample, it is between 200–300 °C, very similar to that of the commercial Cu–Cu2O–CuO catalyst, while for the commercial CuO, it is between 400–600 °C. These results indicate that the commercial Cu–Cu2O–CuO and HD–CuO are much easier to reduce than the commercial CuO. The XRD partterns in Fig. 7e show that the commercial Cu–Cu2O–CuO catalyst contains a small portion of Cu and a large portion of Cu2O and CuO, while HD–CuO and commercial CuO are pure CuO. The contact mass is the solid mixture comprised of the reactant Si and the catalyst. After the reaction, Cu species appeared in the reacted contact masses as shown in Fig. 7f. The formation of Cu is due to the removal of oxygen from the copper oxides by chlorosilane.48 The catalytic results demonstrate that the synthesized HD–CuO microspheres possess much better catalytic activity for M2 synthesis than the commercial CuO, probably due to the porous structure and higher specific surface area in the former, which lead to enhanced gas transportation together with closer contact between the solid catalyst and silicon and this is beneficial to the formation of more active species CuxSi, as shown in the inset of Fig. 7f. In the Rochow reaction, usually CuxSi is the key catalytic active species,66 on which, M2 is formed.67 The formation of CuxSi between the copper catalyst and the Si interface68 is an important indicator of the activity for a copper catalyst.69 The silicon surface was smooth before the reaction (Fig. 8a), but became coarse after the reaction (Fig. 8b). The SEM images of silicon and CuO and the scheme in Fig. 8 show that CuO on the surface of silicon before the reaction etches the silicon surface and gradually moves to the interior of the silicon with the progress of the reaction. This reaction mechanism is also called the anisotropic etching reaction mechanism.70
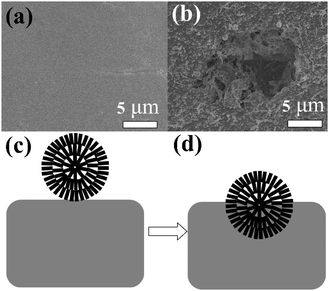 |
| | Fig. 8 Anisotropic etching reaction mechanism: the surface of silicon (a) before the reaction, (b) after the reaction, the schematic diagram of silicon and CuO (c) before the reaction, (d) after the reaction process. | |
4. Conclusions
We have demonstrated a facile hydrothermal method to prepare HD–CuO microspheres in the presence of ethylene glycol. The reaction temperature, reaction time and reagent amounts have significant effects on the morphology and structure of HD–CuO. HD–CuO microspheres were obtained in a wide range of reaction conditions and they were composed of nanoplates, nanosheets and nanoribbons and possessed a surface area of 10.6–57.5 m2 g−1 and a diameter of 3–6 μm. It was found that increasing the ethylene glycol addition from 0 to 12 ml leads to a continuous increase in the specific surface area of the HD–CuO microspheres. Compared with the commercial CuO microparticles and Cu–Cu2O–CuO catalysts, HD–CuO microspheres show a better catalytic performance in dimethyldichlorosilane synthesis via the Rochow reaction owing to their developed porous hierarchical structure and higher specific surface area. Also, in the catalytic reaction, the Si conversion increased with the increase of the surface area of the HD–CuO samples. The work shows a new approach for the preparation of porous hierarchical metal oxides and the controlled synthesis provides insights into the formation process. These copper catalysts would be applicable in organosilane synthesis.
Acknowledgements
The authors gratefully acknowledge the financial supports from the Hundred Talents Program of the Chinese Academy of Sciences (CAS), CAS-Locality Cooperation Program (No. DBNJ-2011-058), State Key Laboratory of Multiphase Complex Systems (No. MPCS-2011-D-14), and China Postdoctoral Science Foundation (No. 20110490597).
Notes and references
- K. E. Shopsowitz, H. Qi, W. Y. Hamad and M. J. MacLachlan, Nature, 2010, 468, 422 CrossRef CAS.
- S. C. Warren, L. C. Messina, L. S. Slaughter, M. Kamperman, Q. Zhou, S. M. Gruner, F. J. DiSalvo and U. Wiesner, Science, 2008, 320, 1748 CrossRef CAS.
- L. Chen, Z. Song, X. Wang, S. Prikhodko, J. Hu, S. Kodambaka and R. Richards, ACS Appl. Mater. Interfaces, 2009, 1, 1931 CAS.
- H. Wang, L. Zheng, C. Liu, Y. Liu, C. Luan, H. Cheng, Y. Li, L. Martinu, J. Zapien and I. Bello, J. Phys. Chem. C, 2011, 115, 10419 CAS.
- H. Zhang, Q. Zhu, Y. Zhang, Y. Wang, L. Zhao and B. Yu, Adv. Funct. Mater., 2007, 17, 2766 CrossRef CAS.
- Y. Liu, D. Wang, Q. Peng, D. Chu, X. Liu and Y. Li, Inorg. Chem., 2011, 50, 5841 CrossRef CAS.
- I. Tamiolakis, I. N. Lykakis, A. P. Katsoulidis, M. Stratakis and G. S. Armatas, Chem. Mater., 2011, 23, 4204 CAS.
- S. Manna, K. Das and S. K. De, ACS Appl. Mater. Interfaces, 2010, 2, 1536 CAS.
- S. Dong, X. Chen, L. Gu, X. Zhou, H. Xu, H. Wang, Z. Liu, P. Han, J. Yao, L. Wang, G. Cui and L. Chen, ACS Appl. Mater. Interfaces, 2011, 3, 93 CAS.
- W. Xiong, M. X. Liu, L. H. Gan, Y. K. Lv, Y. Li, L. Yang, Z. J. Xu, Z. X. Hao, H. L. Liu and L. W. Chen, J. Power Sources, 2011, 196, 10461 CrossRef CAS.
- F. Jiao, A. Harrison, J. C. Jumas, A. V. Chadwick, W. Kockelmann and P. G. Bruce, J. Am. Chem. Soc., 2006, 128, 5468 CrossRef CAS.
- W. G. Song, S. W. Bian, Z. Ma, L. S. Zhang and F. Niu, Chem. Commun., 2009, 10, 1261 Search PubMed.
- J. M. Cao, M. B. Zheng, G. B. Ji, Y. W. Wang, J. Cao, S. Q. Feng, L. Liao, Q. L. Du, L. F. Zhang, Z. X. Ling, J. S. Liu, T. Yu and J. Tao, Chem. Commun., 2009, 33, 5033 Search PubMed.
- N. Du, H. Zhang, J. Chen, J. Sun, B. Chen and D. Yang, J. Phys. Chem. B, 2008, 112, 14836 CrossRef CAS.
- L. Yang, Q. Cai and Y. Yu, Inorg. Chem., 2006, 45, 9616 CrossRef CAS.
- R. Debnath, J. Tang, D. A. Barkhouse, X. H. Wang, A. G. Pattantyus-Abraham, L. Brzozowski, L. Levina and E. H. Sargent, J. Am. Chem. Soc., 2010, 132, 5952 CrossRef CAS.
- Y. H. Yin, M. X. Gao, J. L. Ding, Y. F. Liu, L. K. Shen and H. G. Pan, J. Alloys Compd., 2011, 509, 10161 CrossRef CAS.
- J. Y. Dong, J. Hsu, D. S. H. Wong and S. Y. Lu, J. Phys. Chem. C, 2010, 114, 8867 CAS.
- H. Liu, W. Miao, S. Yang, Z. Zhang and J. Chen, Cryst. Growth Des., 2009, 9, 1733 CAS.
- N. Sui, Y. Duan, X. Jiao and D. Chen, J. Phys. Chem. C, 2009, 113, 8560 CAS.
- D. B. Kuang, B. X. Lei, Y. P. Pan, X. Y. Yu and C. Y. Su, J. Phys. Chem. C, 2009, 113, 5508 CAS.
- Y. Yu, Y. Sh, C. H. Chen and C. Wang, J. Phys. Chem. C, 2008, 112, 4176 CAS.
- B. Liu and H. C. Zeng, J. Am. Chem. Soc., 2004, 126, 8124 CrossRef CAS.
- C. J. Love, J. D. Smith, Y. H. Cui and K. K. Varanasi, Nanoscale, 2011, 3, 4972 RSC.
- X. F. Guan, L. P. Li, G. S. Li, Z. W. Fu, J. Zheng and T. J. Yan, J. Alloys Compd., 2011, 509, 3367 CrossRef CAS.
- J. Y. Xiang, J. P. Tu, L. Zhang, Y. Zhou, X. L. Wang and S. J. Shi, J. Power Sources, 2010, 195, 313 CrossRef CAS.
- F. Zhang, A. Zhu, Y. Luo, T. Yang, J. Yang and Q. Yao, J. Phys. Chem. C, 2011, 114, 19214 Search PubMed.
- S. Y. Gao, S. X. Yang, J. Shu, S. X. Zhang, Z. D. Li and K. Jiang, J. Phys. Chem. C, 2008, 112, 19324 CAS.
- J. Li, X. Liu, Y. Ye, H. Zhou and J. Chen, J. Phys. Chem. C, 2011, 115, 4726 CAS.
- M. Vaseem, A. Umar, S. H. Kim and Y. B. Hahn, J. Phys. Chem. C, 2008, 112, 5729 CAS.
- Y. Xu, D. Chen and X. Jiao, J. Phys. Chem. B, 2005, 109, 13561 CrossRef CAS.
- Y. Chang and H. C. Zeng, Cryst. Growth Des., 2004, 4, 397 CAS.
- Y. Chang, J. J. Teo and H. C. Zeng, Langmuir, 2005, 21, 1074 CrossRef CAS.
- X. Jiang, T. Herricks and Y. Xia, Nano Lett., 2002, 2, 1333 CrossRef CAS.
- E. W. Bohannan, H. M. Kothari, L. M. Nicic and J. A. Switzer, J. Am. Chem. Soc., 2004, 126, 488 CrossRef CAS.
- H. Wang, Q. Shen, X. Li and F. Liu, Langmuir, 2009, 25, 3152 CrossRef CAS.
- X. Chen, L. Kong, D. Dong, G. Yang, L. Yu, J. Chen and P. Zhang, J. Phys. Chem. C, 2009, 113, 5396 CAS.
- H. Hou, Y. Xie and Q. Li, Cryst. Growth Des., 2005, 5, 201 CAS.
- F. S. Ke, L. Huang, G. Z. Wei, L. J. Xue, J. T. Li, B. Zhang, S. R. Chen, X. Y. Fan and S. G. Sun, Electrochim. Acta, 2009, 54, 5825 CrossRef CAS.
- Z. Wang, F. Su, S. Madhavi and X. W. Lou, Nanoscale, 2011, 3, 1618 RSC.
- J. W. Qin, J. F. Lu, M. H. Cao and C. W. Hu, Nanoscale, 2010, 2, 2739 RSC.
- Y. Feng and X. Zheng, Nano Lett., 2010, 10, 4762 CrossRef CAS.
- A. Gervasini, P. Carniti, S. Bennici and C. Messi, Chem. Mater., 2007, 19, 1319 CrossRef CAS.
- C. K. Chen, Y. W. Chen, C. H. Lin, H. P. Lin and C. F. Lee, Chem. Commun., 2010, 46, 282 RSC.
- J. Acker and K. Bohmhammel, J. Organomet. Chem., 2008, 693, 2483 CrossRef CAS.
- Z. Zhang, H. Che, Y. Wang, J. Gao, L. Zhao, X. She, J. Sun, P. Gunawan, Z. Zhong and F. Su, Ind. Eng. Chem. Res., 2012, 51, 1264 CrossRef CAS.
- Z. Zhang, H. Che, J. Gao, Y. Wang, X. She, J. Sun, P. Gunawan, Z. Zhong and F. Su, Catal. Sci. Technol., 2012, 2, 1207 CAS.
- L. N. Lewis and W. J. Ward, Ind. Eng. Chem. Res., 2002, 41, 397 CrossRef CAS.
- Z. Zhang, H. Che, Y. Wang, J. Gao, X. She, J. Sun, Z. Zhong and F. Su, RSC Adv., 2012, 2, 2254 RSC.
-
M. K. Barr, T. M. Murphy and M. G. Williams, USP, -20050176981, 2005 Search PubMed.
- R. Voorhoeve, B. Geertsem and J. C. Vlugter, J. Catal., 1965, 4, 43 CrossRef CAS.
- E. G. Rochow, J. Am. Chem. Soc., 1945, 67, 963 CrossRef CAS.
- W. Luo, G. Wang and J. Wang, Ind. Eng. Chem. Res., 2006, 45, 129 CrossRef CAS.
- Z. J. Wu, J. S. Zhao, M. H. Zhang, W. Li and K. Y. Tao, Catal. Commun., 2010, 11, 973 CrossRef CAS.
- D. D. Liang, S. X. Liu, F. J. Ma, F. Wei and Y. G. Chen, Adv. Synth. Catal., 2011, 353, 733 CrossRef CAS.
- Z. Zhang, H. Che, Y. Wang, X. She, J. Sun, G. Poernomo, Z. Zhong and F. Su, ACS Appl. Mater. Interfaces, 2012, 4, 1295 CAS.
- M. Chen, Y. Wang, L. Song, P. Gunawan, Z. Zhong, X. She and F. Su, RSC Adv., 2012, 2, 4164 RSC.
-
C. P. H. Lyons and G. S. Roussillon, USP, -4661613, 1987 Search PubMed.
- J. P. Liu, X. T. Huang, Y. Y. Li, K. M. Sulieman, X. He and F. L. Sun, Cryst. Growth Des., 2006, 6, 1690 CAS.
- M. Basu, A. K. Sinha, M. Pradhan, S. Sarkar, A. Pal and T. Pal, Chem. Commun., 2010, 46, 8785 RSC.
- J. Y. Kim, J. C. Park, H. Kang, H. Song and K. H. Park, Chem. Commun., 2010, 46, 439 RSC.
- H. T. Zhu, J. X. Wang and G. Y. Xu, Cryst. Growth Des., 2009, 9, 633 CAS.
- L. A. Gao and B. P. Ha, J. Cryst. Growth, 2007, 303, 616 CrossRef.
- M. Weinberger, S. Puchegger, C. Rentenberger, M. Puchberger, N. Husing and H. Peterlik, J. Mater. Chem., 2008, 18, 4783 RSC.
- D. Brandhuber, H. Peterlik and N. Husing, J. Mater. Chem., 2005, 15, 3896 RSC.
- W. F. Banholzer and M. C. Burrell, J. Catal., 1988, 114, 259 CrossRef CAS.
- T. C. Frank, K. B. Kester and J. L. Falconer, J. Catal., 1985, 91, 44 CrossRef CAS.
- W. F. Banholzer, N. Lewis and W. Ward, J. Catal., 1986, 101, 405 CrossRef CAS.
- D. Sun and B. E. Bent, Catal. Lett., 1997, 46, 127 CrossRef CAS.
- H. Pan, J. Qian, Y. Cui, H. Xie and X. Zhou, J. Mater. Chem., 2012, 22, 6002 RSC.
|
| This journal is © The Royal Society of Chemistry 2012 |
Click here to see how this site uses Cookies. View our privacy policy here.