Catalytic hydrogenolysis of biodiesel derived glycerol to 1,2-propanediol over Cu–MgO catalysts
M.
Balaraju
,
K.
Jagadeeswaraiah
,
P. S. Sai
Prasad
and
N.
Lingaiah
*
Catalysis Laboratory, I&PC Division, Indian Institute of Chemical Technology, Hyderabad 500607, India. E-mail: nakkalingaiah@iict.res.in; Fax: +91 40 2716 0921; Tel: +91 40 2719 3163
First published on 3rd May 2012
Abstract
Selective hydrogenolysis of glycerol to 1,2-propanediol over Cu–MgO catalysts is reported. A series of Cu–MgO catalysts with varying Cu content were prepared by a co-precipitation method. The physico-chemical properties of the catalysts were derived from BET surface area, X-ray diffraction, temperature programmed reduction of hydrogen, temperature programmed desorption of carbon dioxide, X-ray photoelectron spectroscopy, transmission electron microscopy and dissociative N2O adsorption techniques. The activity results showed that Cu content on MgO has a significant role in glycerol conversion as well as formation of 1,2-propanediol. Well dispersed Cu species and accessible basic sites of MgO are the essential requirements for high glycerol hydrogenolysis activity. 20 wt% of Cu content on MgO is identified as an optimum Cu content. The catalyst is equally active even with crude glycerol and glycerol containing alkali salts as impurity. Different reaction parameters were evaluated and optimized reaction conditions were established.
1. Introduction
1,2-Propanediol (1,2-PDO), a three carbon diol with a steriogenic center at the central carbon atom, is an important medium-value commodity chemical with annual production of 1 billion pounds in the United States.1,2 It is used in the preparation of polyester resins, liquid detergents, pharmaceuticals, cosmetics, tobacco humectants, flavors and fragrances, personal care products, paints, animal feed, antifreeze etc.1,3–5 It can be used as an alternative to toxic ethylene glycol based deicing agents.1 The present industrial method for the synthesis of 1,2-PDO is by hydrolysis of propylene oxide with water at temperatures between 125 °C and 200 °C with a pressure of 20 bar.6,7 The propylene glycol market is under severe pressure due to rapid increase in oil and natural gas costs. Propylene, which is a precursor to propylene oxide used to make propylene glycol, has seen significant rise in price.8 An alternative route to synthesize 1,2-PDO is from renewable feedstocks through hydrogenolysis of sugars, higher polyols or glycerol in the presence of a metal catalyst.9–12Glycerol is a by-product of the biodiesel industry, formed during the transesterification of edible, non-edible oils or animal fats.13 Now, additional glycerol from biodiesel production is flooding the market and substantially influencing the glycerol price in the global market.5,14 The effective utilization of renewable resources such as glycerol by conversion into useful chemicals is essential for development of the society.15 Many researchers have focused on the catalytic conversion of bio-glycerol into value-added chemicals by various reactions.14,16,17 One such method is the conversion of glycerol into 1,2-PDO by hydrogenolysis. This approach overcomes the dependency on fossil fuel and substantially alters the price of 1,2-PDO.18
Hydrogenolysis of glycerol leads to the formation of 1,2-propanediol, 1,3 propanediol (1,3-PDO) as main products, ethylene glycol (EG) as a degradative product and 1-propanol (1-PO), 2-propanol (2-PO) as over hydrogenolysis products. Glycerol hydrogenolysis is generally carried out in liquid phase under elevated H2 pressure and temperature.11 Noble metal catalysts such as supported Rh, Ru, Pt and Pd were studied extensively for glycerol hydrogenolysis.19,20 Ru based catalysts were identified as efficient catalysts for glycerol hydrogenolysis and the main drawback with Ru based catalysts is that they also cleave C–C bonds which leads to the formation of EG.7,19,20 Copper and nickel based catalysts are used as alternatives to noble metal catalysts as they are cheap and active under mild reaction conditions. Moreover, the Cu and Ni based catalysts are known for their poor hydrogenolysis activity towards C–C bonds and high selectivity for C–O bond hydro-dehydrogenation. Y. Nakagawa and Tomishige described in detail about the latest trends in catalyst development for hydrogenolysis of glycerol to propylene glycol in a recent review.21
Copper based catalysts, particularly Cu–ZnO catalysts, have been studied for glycerol hydrogenolysis.22,23 The catalysts are active under mild reaction conditions and do not require a separate solid acid catalyst. The ZnO present in the catalyst drives the dehydration step to yield acetol from glycerol, which is further hydrogenated on Cu sites to yield propylene glycol. A. Bienholz et al. reported 46% glycerol conversion with 90% selectivity towards propylene glycol over a Cu–ZnO catalyst.24 Wang and Liu obtained 23% glycerol conversion with 83% selectivity to 1,2 propanediol at 200 °C with 42 bar of H2 pressure for 12 h over a Cu–ZnO catalyst prepared by a co-precipitation method.23 In our previous study, Cu–ZnO catalysts with more than 90% 1,2-PDO selectivity were reported.21 Even though all these catalysts are selective for 1,2-PDO, the overall glycerol conversion is limited and requires long reaction times.
High glycerol conversion and selectivity to 1,2-PDO was achieved over catalytic systems containing precious metals along with base, such as Pt/C + CaO, PtRu/C + NaOH and Ru/TiO2 + LiOH.25–27 When base is used instead of acid as a co-catalyst the overall activity is high. They found that glycerol hydrogenolysis activity depends on the alkaline strength of the base material. The glycerol hydrogenolysis proceeds in a three step mechanism in alkali solution. Initially, glycerol dehydrogenates to glyceraldehyde, followed by the dehydration of glyceraldehyde to 2-hydroxyacrolein which subsequently hydrogenates to 1,2-PDO.28 In the case of Cu–ZnO catalysts, it is proved that the reaction proceeds through an acetol mechanism.22,23 If the acidic support for Cu is replaced by a basic support, the reaction mechanism is expected to be different leading to high glycerol conversion and selectivity to 1,2-PDO. There are few reports where Cu is supported on basic supports like MgO and hydrotalcites. X. Zheng et al. prepared solid base supported Cu catalysts and examined for glycerol hydrogenolysis activity. They achieved high glycerol conversion with retaining of high 1,2-PDO (>95%) selectivity over Cu–MgO and Cu/Mg/Al hydrotalcite catalysts.29,30 Most of the researchers studied glycerol hydrogenolysis activity on pure and synthetic glycerol. There are no detailed studies about the characterization of Cu–MgO catalysts to understand the observed catalytic activities.
The present work is related to development of a highly active non-noble Cu–MgO catalyst for the hydrogenolysis of glycerol to 1,2-PDO under mild reaction conditions. The study aims to understand the role of support, basicity in Cu–MgO catalysts. The catalytic activity of the Cu–MgO catalyst is studied using crude glycerol and alkali salts containing glycerol to know the practical applicability. The catalysts are characterized by various techniques and the relation between the glycerol hydrogenolysis activity and surface and structural characteristics of Cu–MgO catalysts is discussed.
2. Experimental
2.1 Catalyst preparation
A series of Cu–MgO catalysts were prepared by a co-precipitation method. Calculated amounts of aqueous solutions of Cu(NO3)2·3H2O and Mg(NO3)2·6H2O were taken and precipitated with dropwise addition of 0.1 M aqueous potassium carbonate solution. During the precipitation the solutions were maintained at 70 °C. The precipitate was aged further at the same temperature for 3 h. After cooling, the precipitate was separated by filtration and washed thoroughly with de-ionized water to remove traces of potassium ions. The thus obtained precipitate was dried overnight at 120 °C. The prepared catalysts are designated as 10CuMgO, 20CuMgO, 40CuMgO, 60CuMgO, 80CuMgO. The numbers indicate the weight percentage of Cu on the MgO support.Conventional Cu supported on SiO2, Al2O3, ZrO2 and ZnO catalysts were prepared by a wet impregnation method using aqueous solution of Cu(NO3)2·3H2O. In this method, a calculated amount of aqueous solution of copper precursor was added dropwise to supports. After allowing overnight adsorption of the metal on the support, the excess solution was first evaporated to near dryness on a water bath and then the partially dried material was dried in an air oven at 120 °C for 12 h. All catalysts were calcined finally at 400 °C for 3 h.
2.2 Catalysts characterization
The BET surface areas of the catalyst samples were calculated from N2 adsorption–desorption data acquired on an Autosorb-1 instrument (Quantachrome, USA) at liquid N2 temperature.X-ray powder diffraction (XRD) patterns of the catalysts were recorded on a Rigaku Miniflex (M/s. Rigaku Corporation, Japan) X-ray diffractometer using Ni filtered Cu Kα radiation (λ = 1.5406 Å) with a scan speed of 2° min−1 and a scan range of 2–80° at 30 kV and 15 mA. Particle sizes of Cu and Mg oxides were calculated by using the Debye–Scherrer equation.
Temperature programmed reduction (TPR) of the catalysts was carried out in a flow of 10% H2–Ar mixture gas at a flow rate of 30 ml min−1 with a temperature ramp of 10 °C min−1. Before the TPR run the catalysts were pretreated with Ar gas at 300 °C for 2 h. The hydrogen consumption was monitored using a thermal conductivity detector.
XPS measurements were conducted on a KRATOS AXIS 165 with a DUAL anode (Mg and Al) apparatus using the Mg Kα anode. The non-monochromatized Al-Kα X-ray source (hν = 1486.6 eV) was operated at 12.5 kV and 16 mA. Before acquisition of the data the sample was out-gassed for about 3 h at 100 °C under a vacuum of 1.0 × 10⁻⁷ torr to minimize surface contamination. The XPS instrument was calibrated using Au as standard. For energy calibration, the carbon 1S photoelectron line was used. The carbon 1S binding energy was taken as 285 eV. Charge neutralization of 2 eV was used to balance the charge up of the sample. The spectra were deconvoluted using a Sun Solaris based Vision-2 curve resolver. The location and the full width at half maximum (FWHM) value for the species were first determined using the spectrum of the pure sample. Symmetric Gaussian shapes were used in all cases. Binding energies for identical samples were, in general, reproducible within ±0.1 eV.
The total basicity of the catalysts was measured by temperature programmed desorption of CO2 (TPD-CO2). In a typical experiment, 0.1 g of catalyst was loaded and pretreated in He gas at 300 °C for 2 h. After pretreatment the temperature was brought to 100 °C and the adsorption of CO2 was carried out by passing a mixture of 10% CO2 balanced He gas over the catalyst for 1 h. The catalyst surface was flushed with He gas at 100 °C for 2 h to flush off the physisorbed CO2. The TPD of the catalysts was carried out in a He gas flow at a flow rate of 30 ml min−1 with a temperature ramp of 10 °C min−1. The CO2 desorption was monitored using a thermal conductivity detector (TCD) of a gas chromatograph.
In order to determine the exposed copper surface area and the dispersion of the catalysts, dissociative N2O adsorption–H2 TPR reverse titration experiments were carried out as described in the literature.31 In a typical experiment, temperature programmed reduction (TPRI) was carried out to reduce the CuO phase to Cu(0) with a 5% H2–Ar mixture with a heating rate of 10 °C min−1. Then the sample which is in the form of Cu(0) phase is exposed to N2O to oxidize Cu to Cu2O by adsorptive decomposition of N2O at 80 °C by a continuous N2O flow for 0.5 h. Then, again TPRII was carried out for the second time on the re-oxidized Cu2O surface in order to reduce Cu2O to Cu. The thermal conductivity detector (TCD) was used to measure the amount of H2-uptake in TPR experiments. The Cu dispersions (D) and specific Cu surface area (S) of the catalysts were calculated by the following equations.
where N = Avogadro's constant, MCu = atomic mass (63.456 g mol−1), 1.47 × 10¹⁹ is the number of surface Cu atoms per unit surface area (0.0711 nm2).
The morphology features of the catalysts were characterized by transmission electron microscopy (TEM). TEM investigations were carried out using a Philips CM20 (100 kV) transmission electron microscope equipped with a NARON energy-dispersive spectrometer with a germanium detector. The specimens were prepared by dispersing the samples in methanol using an ultrasonic bath and evaporating a drop of resultant suspension onto the lacey carbon support grid. The sizes of the catalyst particles were measured by digital micrograph software (version 3.6.5, Gatan Inc.).
2.3 Activity measurements
Hydrogenolysis of glycerol was carried out in a 100 ml haste alloy PARR 4843 autoclave. Required quantity of glycerol diluted in de-ionized water and catalysts were charged into the autoclave. The reactor was purged with H2 three times to flush off the air. After the purge, the reactor was heated to the reaction temperature while maintaining the required H2 pressure. During the reaction a decrease in hydrogen pressure is observed. After the reaction, the gas phase products were collected in a gas bag and the liquid phase products were separated from the catalyst by filtration. Products in the liquid phase and the gas phase were analyzed by a gas chromatograph (Shimadzu 2010) equipped with an FID and a TCD. The liquid products were separated on a capillary INNOWax (30 m × 0.25 mm × 0.25 μm) column. Products were also identified by GC–MS (Shimadzu, GCMS-QP2010). The gas products were analyzed by using a Porapak Q column (4 m × 3 mm) equipped with a thermal conductivity detector. The products identified during glycerol hydrogenolysis are 1,2-propanediol (1,2-PDO), 1-propanol (1-PO), and 2-propanol (2-PO) (hydrogenolysis products) and ethylene glycol (EG), ethanol, methanol, ethane and methane.Conversion of the glycerol was calculated on the basis of the following equation:
The selectivity of the products was calculated on carbon basis.
3. Results and discussion
3.1 Catalysts characterization
Table 1 summarizes the physico-chemical properties of Cu–MgO catalysts. BET surface area of the catalysts decreased sharply from 43 to 12 m2 g−1, when copper loading increased from 10 to 60 wt%. This can be attributed to the formation of CuO clusters on the MgO support which might be blocking the pores of moderate surface area of MgO.| Catalyst | Cu/Mg ratioa | BET surface area (m2 g−1) | Metal surface areab (m2 g−1) | Basicityc (× 10−6 mol g−1) | Crystal sized (nm) | |
|---|---|---|---|---|---|---|
| Cu | MgO | |||||
| a Atomic ratio determined by XPS analysis. b Cu metal surface area determined from N2O chemisorption. c Basicity of catalyst measured by CO2 desorption studies. d Crystal size of catalyst measured by an XRD technique. | ||||||
| 10CuMgO | 0.005 | 42.7 | 115.6 | 321 | 12.1 | 33.8 |
| 20CuMgO | 0.12 | 39.5 | 120.4 | 290 | 13.7 | 31.7 |
| 40CuMgO | 0.21 | 20.2 | 102.2 | 250 | 14.3 | 30.5 |
| 60CuMgO | 0.58 | 11.8 | 70.9 | 180 | 25.9 | 28.9 |
| 80CuMgO | 0.71 | 9.6 | 30.9 | 90 | 29.9 | 27.6 |
X-ray powder diffraction patterns of calcined Cu–MgO catalysts are shown in Fig. 1. The diffraction peaks corresponding to CuO phases were not observed for low copper containing catalysts (10CuMgO and 20CuMgO) suggesting the high dispersion of copper. The most intense reflections corresponding to CuO at 2θ of 35.5° and 38.8° were clearly seen for the catalysts with high CuO content (60CuMgO and 80CuMgO). The presence of peaks at 2θ values of 42.8° and 62.2° suggests the crystalline phases of MgO in the all samples. The crystallite sizes of Cu and MgO particles of the catalysts were calculated using the X-ray line broadening technique and are listed in Table 1.
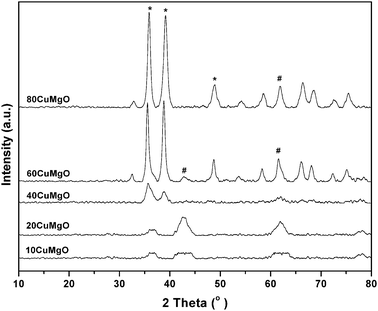 | ||
| Fig. 1 X-ray diffraction patterns of calcined Cu–Mg catalysts. (*) CuO and (#) MgO phases. | ||
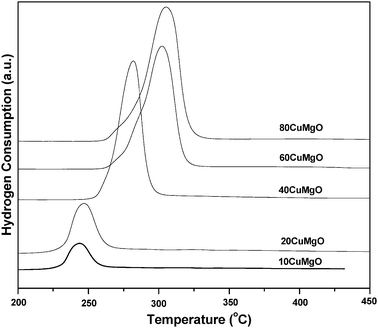
The reducibility of the catalysts was studied using temperature programmed reduction of hydrogen (TPR). The TPR profiles of the catalysts are shown in Fig. 2. As expected, the hydrogen consumption increased with increase in the copper content on the support. A sharp reduction peak was observed at 240 °C for the 20CuMgO catalyst. This peak is due to the reduction of CuO to Cu. The reduction peak was shifted remarkably to high temperature with increased broadness, as Cu content increased on the support. The high temperature peak can be attributed to the reduction of the cluster or bulk CuO particles.32 A broad reduction peak for the catalyst with high Cu content might be due to merging of reduction peaks related to dispersed and cluster CuO species. This indicates that copper oxide species with different redox behavior were present on the MgO support.
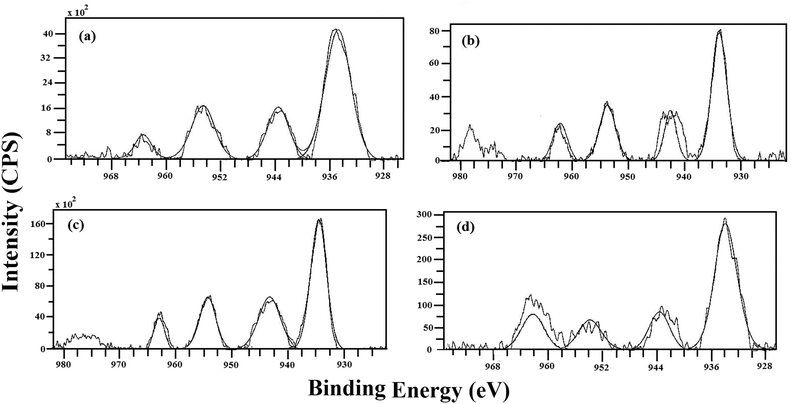
The surface of the Cu–MgO catalysts was characterized by an XPS technique. The binding energy values of Cu, Mg and O are listed in Table 2. Fig. 3 shows the Cu 2p spectra of calcined Cu–MgO catalysts. The catalysts show binding energy values of 934 and 954 eV related to Cu 2p3/2 and Cu 2p1/2 respectively. The binding energy corresponding to Cu 2p1/2 was due to a spin–orbit coupling, with an energy gap of more than 20 eV of Cu 2p3/2. The main peaks were followed by strong satellite peaks around 944 and 964 eV confirming the presence of Cu2+ species in the calcined catalysts.33,34 In fact, transition metal ions with unfilled 3d orbitals are reported to show prominent satellite peaks in the core level XPS spectra due to electron shake-up transitions because of the ligand to metal 3d charge transfer. The structure of the satellite peak, i.e., the peak number, intensity and splitting reflect the nature of chemical bonding of the transition metal ions.35,36 The peak intensity of Cu 2p electrons in XP spectra significantly increased with increase in Cu loading from 10 to 80%. The shift in binding energies was not observed even for a high Cu content catalyst. These results suggested a high homogeneity of CuO sites on the support. The O 1s spectra showed two bands in the binding range of 530–534 eV for all the catalysts. The Mg 2p binding energy value of 51 eV is almost the same for all the samples. The XPS results suggest the presence of Cu2+ species on MgO in the calcined catalysts. The surface Cu/Mg atomic ratio of Cu–MgO catalysts was determined by using an XPS technique and results are listed in Table 1. The surface Cu/Mg ratio increased with Cu content of catalysts. Very low surface Cu to Mg ratio was observed for low Cu content catalysts due to high Cu dispersion on the MgO support.
| Catalyst | Binding energy (eV) | |||
|---|---|---|---|---|
| Cu 2p3/2 | Cu 2p1/2 | Mg 2p | O 1s | |
| 10CuMgO | 934.8, 943.1 | 954.6, 963.4 | 51.6 | 531.6, 533.6 |
| 20CuMgO | 934.4, 943.3 | 954.1, 963.5 | 51.4 | 531.6, 533.4 |
| 40CuMgO | 934.5, 943.4 | 954.4, 963.4 | 51.3 | 531.1, 533.8 |
| 80CuMgO | 934.3, 943.6 | 954.5, 963.5 | 51.5 | 532.1, 534.0 |
The copper surface area of Cu–MgO catalysts was determined by a dissociative N2O adsorption–H2 TPR reverse titration method and the results are summarized in Table 1. The Cu metal area of the catalysts was found to be 115.6, 120.4 and 102.2 m2 g−1 for 10CuMgO, 20CuMgO, 40CuMgO catalysts respectively. Surface area of Cu was drastically decreased for the catalyst with high Cu loading (60CuMgO and 80CuMgO) due to formation of cluster particles of CuO. XRD and TPR results are in support of the formation of CuO clusters.
The TEM images of the catalysts are shown in Fig. 4. The particle sizes of CuO in these catalysts were estimated by TEM analysis. The calculated copper mean particle sizes of 10CuMgO, 20CuMgO, 40CuMgO, 60CuMgO and 80CuMgO were 10.0, 12.0, 15.7, 24.5 and 30.5 nm, respectively. The particle sizes of the catalysts obtained from TEM analysis were comparable with those obtained from XRD results. It was identified that the copper metal particles in Cu–MgO catalysts were smaller than those of Cu–ZnO catalysts.22 The difference in metal particle size on different supports can be related to the intrinsic property of the support. Many previous studies have shown that the support material can influence the metal particle size and consequently influence the catalytic performance.37,38
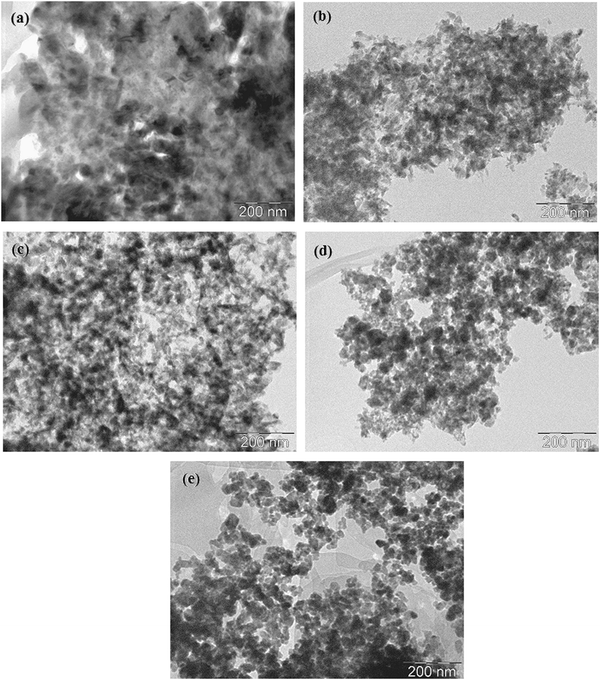 | ||
| Fig. 4 TEM images of Cu–Mg catalysts. (a) 10CuMgO, (b) 20CuMgO, (c) 40CuMgO, (d) 60CuMgO, (e) 80CuMgO. | ||
3.2 Activity measurements
| Catalyst | Conv. (%) | Selectivity (%) | ||
|---|---|---|---|---|
| 1,2-PDO | EG | Others | ||
| Reaction conditions: 20 wt% glycerol aqueous solution: 50 ml, H2 pressure: 40 bar, reaction time: 8 h, catalyst weight: 0.6 g (6%), reaction temperature: 200 °C. | ||||
| 10CuMgO | 30.2 | 92.4 | 5.4 | 2.8 |
| 20CuMgO | 49.3 | 92.3 | 5.9 | 1.8 |
| 40CuMgO | 36.6 | 90.3 | 6.7 | 3.0 |
| 60CuMgO | 18.0 | 90.0 | 6.9 | 3.1 |
| 80CuMgO | 6.1 | 87.6 | 5.6 | 6.8 |
Previously, many authors reported Ru or Cu supported on solid acid catalysts for glycerol hydrogenolysis.5,22,23,38,39 Glycerol hydrogenolysis was also carried out by adding base as a co-catalyst over carbon supported noble metal catalysts.25–27 The hydrogenolysis activity of the present Cu–MgO catalyst is higher than that of reported Cu–ZnO catalysts and comparable with that of hybrid Ru/C + Amberlyst and Pt/C or Ru/C + NaOH. Montassier et al. proposed a reaction mechanism for the conversion of glycerol to 1,2-PDO under basic reaction conditions.28 According to this reaction mechanism, dehydrogenation of glycerol leads to glyceraldehyde and it subsequently dehydrates to hydroxyacrolein on basic sites of catalyst. Further hydrogenation of these reaction intermediates to 1,2-PDO took place over metallic sites. A considerable amount (∼5%) of acetol (intermediate) was observed in our previous studies whereas acetol is not identified in the present study.22 Therefore, it is concluded that the reaction proceeds over the catalysts with acidic supports as well as over those with basic supports through different reaction mechanisms as shown in Scheme 1.
From the above reaction mechanism, it is known that basicity and copper metal area are essential for glycerol hydrogenolysis. During glycerol hydrogenolysis, Cu and MgO sites play an important role in glycerol conversion and 1,2-PDO selectivity. The observed glycerol hydrogenolysis activity is related to the Cu metal area and basicity of the catalyst. The relation of Cu metal surface area and basicity of the catalysts with glycerol conversion is shown in Fig. 5. A linear correlation is observed between Cu metal surface area and glycerol conversion as shown in Fig. 5(A). The low Cu containing catalyst showed maximum Cu metal area and exhibited high activity. Metal surface area and dispersion rapidly decreased for the catalysts with high Cu content such as 60CuMgO and 80CuMgO due to formation of multi-layer CuO clusters on the support. The TPR, XRD and TEM analyses are in support of these observations. The relation between glycerol conversion and catalyst basicity shown in Fig. 5(B) suggests that the catalyst with high basicity exhibits high glycerol conversion. The basicity of low Cu content catalysts is also high. Basicity of the 10CuMgO catalyst was found to be 321 μmol g−1. As CuO content increased from 10 to 80%, basicity of the Cu–MgO catalysts gradually decreased from 321 to 90 μmol g−1 due to blockage of surface MgO sites by CuO clusters. As these catalysts contain low amounts of MgO, their overall basicity is also minimum.30 These results indicate that the glycerol conversion depends on the basicity and Cu metal area. As a whole a judicious amount of basicity and Cu metal surface area is required for the catalyst to show better glycerol conversion and selectivity.
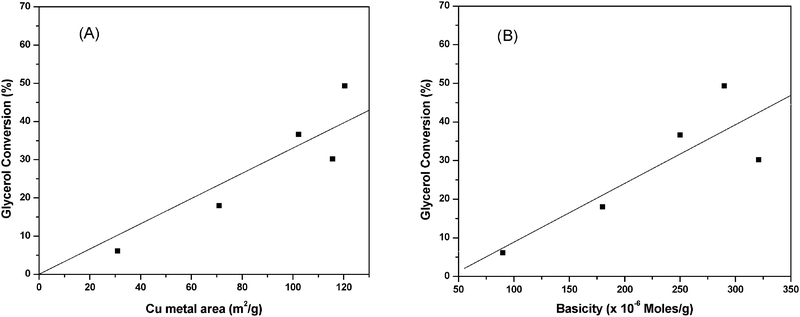 | ||
| Fig. 5 Correlation of (A) Cu metal area and (B) basicity of Cu–MgO catalysts with glycerol conversion. | ||
| Type of glycerol | Conversion (%) | Selectivity (%) | ||
|---|---|---|---|---|
| 1,2-PDO | EG | Others | ||
| Reaction conditions: 20 wt% glycerol aqueous solution: 50 ml, H2 pressure: 40 bar, reaction time: 8 h, catalyst weight: 0.6 g (6%), reaction temperature: 200 °C.a Activity on 200 ml scale.b Activity on 500 ml scale. | ||||
| Pure glycerol | 49.3 | 92.3 | 5.9 | 1.8 |
| 5% Na2SO4 + pure glycerol | 41.6 | 92.3 | 5.0 | 2.7 |
| Crude glycerol | 44.5 | 92 | 4.9 | 3.1 |
| Pure glycerola | 45.8 | 92.3 | 5.8 | 1.9 |
| Pure glycerolb | 39.7 | 92.2 | 4.5 | 3.3 |
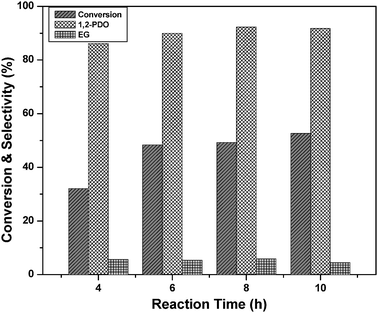
Crude glycerol was obtained from a biodiesel plant where sodium hydroxide is used as catalyst. Demethanolised crude glycerol was used for glycerol hydrogenolysis under optimized reaction conditions. A maximum glycerol conversion of about 44% with 92% selectivity toward 1,2-PDO was obtained. The activity results show that the Cu–MgO catalyst is active even for crude glycerol to synthesize 1,2-PDO. It is very important to mention that the present catalyst is resistant towards the salts and other impurities present in crude glycerol.
| Catalyst | Conversion (%) | Selectivity to 1,2PDO (%) |
|---|---|---|
| Reaction conditions: 20 wt% glycerol aqueous solution: 50 ml, H2 pressure: 40 bar, reaction time: 8 h, catalyst weight: 0.6 g (6%), reaction temperature: 200 °C. | ||
| 20% Cu–SiO2 | 20.0 | 83.6 |
| 20% Cu–Al2O3 | 25.3 | 85.6 |
| 20% Cu–ZrO2 | 10.2 | 62.0 |
| 20% Cu–ZnO | 37.0 | 92.0 |
| 20% Cu–MgO | 49.3 | 92.3 |
4. Conclusions
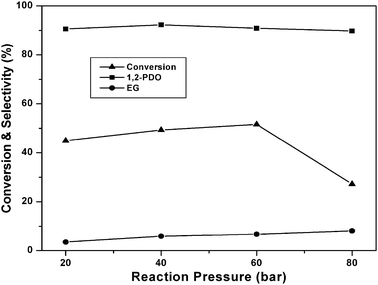
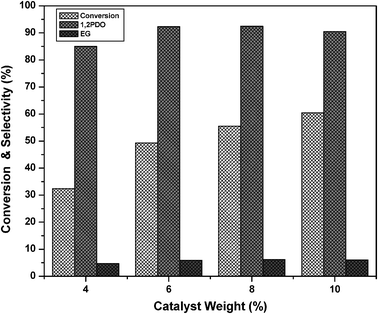
The use of a basic support like MgO for Cu based catalysts alters the reaction mechanism of glycerol hydrogenolysis. The Cu–MgO catalysts are highly active and selective to 1,2-PDO in glycerol hydrogenolysis under mild reaction conditions. The content of Cu and its dispersion, metal surface area and the basicity of the catalyst are responsible for the high glycerol hydrogenolysis activity. The catalyst with low Cu content (20 wt%) on MgO showed the highest activity with 50% glycerol conversion and 92% selectivity to 1,2-PDO. The glycerol conversion also depends on the reaction parameters, and optimum reaction conditions were established. The present Cu–MgO catalyst tolerates even alkali salts and other impurities present in crude glycerol.Acknowledgements
The authors thank Department of Science & Technology, New Delhi, India, for financial support. MB and KJ thank CSIR for the award of Senior Research Fellowships.References
- Chemical Marketing Reporter, 1092-0110, 260 (11) (September 24, 2001) 30.
- M. A. Dasari, P. Kiatsimkul, W. R. Sutterlin and G. J. Suppes, Appl. Catal., A, 2005, 281, 225–231 CrossRef CAS.
- A. Behr, J. Eilting, K. Irawadi, J. Leschinski and F. Lindner, Green Chem., 2008, 10, 13–30 RSC.
- J. Chaminand, L. Djakovitch, P. Gallezot, P. Marion, C. Pinel and C. Rosier, Green Chem., 2004, 6, 359–361 RSC.
- M. Balaraju, V. Rekha, B. L. A. P. Devi, R. B. N. Prasad, P. S. S. Prasad and N. Lingaiah, Appl. Catal., A, 2010, 384, 107–114 CrossRef CAS.
- R. Perrin and J. P. Scharff, Chimie industrielle, ed. Masson, 1993 Search PubMed.
- M. Balaraju, V. Rekha, P. S. S. Prasad, B. L. A. P. Devi, R. B. N. Prasad and N. Lingaiah, Appl. Catal., A, 2009, 354, 82–87 CrossRef CAS.
- A. Brandner, K. Lehnert, A. Bienholz, M. Lucas and P. Claus, Top. Catal., 2009, 52, 278–287 CrossRef CAS.
- S. P. Chopade, D. J. Miller, J. E. Jackson, T. A. Werpy, J. G. Frye Jr. and A. H. Zacher, US Pat., US 6291725 to Board of Trustees operating Michigan State University, Battelle Memorial Institute, Pacific Northwest Laboratory, 2001 Search PubMed.
- J. C. Chao and D. T. A. Huibers, US Pat., US 4366332 to Hydrocarbon Research Inc, 1982 Search PubMed.
- B. Casale and A. M. Gomez, US Pat., US 5276181 to Novamont S.p.A, 1994 Search PubMed.
- P. Bloom, US Pat., US 7928148 to Archer Daniels Midland Company, 2008 Search PubMed.
- J. M. Marchetti, V. U. Miguel and A. F. Errazu, Renewable Sustainable Energy Rev., 2007, 11, 1300–1311 CrossRef CAS.
- D. T. Johnson and K. A. Taconi, Environ. Prog., 2007, 26, 338–348 CrossRef CAS.
- R. D. Cortright, R. R. Davda and J. A. Dumesic, Nature, 2002, 418, 964–967 CrossRef CAS.
- M. Pagliaro, R. Ciriminna, H. Kimura, M. Rossi and C. D. Pina, Eur. J. Lipid Sci. Technol., 2009, 111, 788–799 CrossRef CAS.
- N. R. Shiju, D. R. Brown, K. Wilson and G. Rothenberg, Top. Catal., 2010, 53, 1217–1223 CrossRef CAS.
- L. C. Meher, R. Gopinath, S. N. Naik and A. K. Dalai, Ind. Eng. Chem. Res., 2009, 48, 1840–1846 CrossRef CAS.
- T. Miyazawa, Y. Kusunoki, K. Kunimori and K. Tomishige, J. Catal., 2006, 240, 213–221 CrossRef CAS.
- Y. Kusunoki, T. Miyazawa, K. Kunimori and K. Tomishige, Catal. Commun., 2005, 6, 645–649 CrossRef CAS.
- Y. Nakagawa and K. Tomishige, Catal. Sci. Technol., 2011, 1, 179–190 CAS.
- M. Balaraju, V. Rekha, P. S. S. Prasad, R. B. N. Prasad and N. Lingaiah, Catal. Lett., 2008, 126, 119–124 CrossRef CAS.
- S. Wang and H. Liu, Catal. Lett., 2007, 117, 62–67 CrossRef CAS.
- A. Bienholz, F. Schwab and P. Claus, Green Chem., 2010, 12, 290–295 RSC.
- E. P. Maris and R. J. Davis, J. Catal., 2007, 249, 328–337 CrossRef CAS.
- E. P. Maris, W. C. Ketchie, M. Murayama and R. J. Davis, J. Catal., 2007, 251, 281–294 CrossRef CAS.
- J. Feng, J. B. Wang, Y. F. Zhou, H. Y. Fu, H. Chen and X. J. Li, Chem. Lett., 2007, 1274–1275 CrossRef CAS.
- C. Montassier, D. Giraud and J. Barbier, Heterogeneous Catalysis and Fine Chemicals, 1988, pp. 165–170 Search PubMed.
- Z. Yuan, J. Wang, L. Wang, W. Xie, P. Chen, Z. Hou and X. Zheng, Bioresour. Technol., 2010, 101, 7088–7092 CrossRef CAS.
- Z. Yuan, L. Wang, J. Wang, S. Xia, P. Chen, Z. Hou and X. Zheng, Appl. Catal., B, 2011, 101, 431–440 CrossRef CAS.
- C. J. G. Van Der Grift, A. F. H. Wielers, B. P. J. Jogh, J. Van Beunum, M. De Boer, M. Versluijs-Helder and J. W. Geus, J. Catal., 1991, 131, 178–189 CrossRef CAS.
- S. Xu, C. Huang, J. Zhang and B. Chen, Korean J. Chem. Eng., 2009, 26, 1568–1573 CrossRef CAS.
- R. Kam, C. Selomulya, R. Amal and J. Scott, J. Catal., 2010, 273, 73–81 CrossRef CAS.
- C. C. Chusuei, M. A. Brookshier and D. W. Goodman, Langmuir, 1999, 15, 2806–2808 CrossRef CAS.
- D. C. Frost, A. Ishitani and C. A. McDowell, Mol. Phys., 1972, 24, 861 CrossRef CAS.
- T. A. Carlson, Photoelectron and Auger Spectroscopy, Plenum Press, New York, 1975 Search PubMed.
- J. Feng, H. Fu, J. Wang, R. Li, H. Chen and X. Li, Catal. Commun., 2008, 9, 1458–1464 CrossRef CAS.
- E. S. Vasiliadou, E. Heracleous, I. A. Vasalos and A. A. Lemonidou, Appl. Catal., B, 2009, 92, 90–99 CrossRef CAS.
- L. Guo, J. Zhou, J. Mao, X. Guo and S. Zhang, Appl. Catal., A, 2009, 367, 93–98 CrossRef CAS.
- C. V. Rode, A. A. Ghalwadkar, R. B. Mane, A. M. Hengne, S. T. Jadkar and N. S. Biradar, Org. Process Res. Dev., 2010, 14, 1385–1392 CrossRef.
| This journal is © The Royal Society of Chemistry 2012 |


