CdS–graphene and CdS–CNT nanocomposites as visible-light photocatalysts for hydrogen evolution and organic dye degradation
Aihua
Ye
,
Wenqing
Fan
,
Qinghong
Zhang
*,
Weiping
Deng
and
Ye
Wang
*
State Key Laboratory of Physical Chemistry of Solid Surfaces, National Engineering Laboratory for Green Chemical Production of Alcohols, Ethers and Esters, Department of Chemistry, College of Chemistry and Chemical Engineering, Xiamen University, Xiamen, China. E-mail: wangye@xmu.edu.cn; zhangqh@xmu.edu.cn; Fax: +86 592 2183047; Tel: +86 592 2186156
First published on 23rd January 2012
Abstract
CdS–graphene (GR) and CdS–carbon nanotube (CNT) nanocomposites prepared by a hydrothermal method were studied as photocatalysts for the evolution of hydrogen and the degradation of methyl orange (MO) under visible-light irradiation. The incorporation of GR or CNT into CdS significantly enhanced the photocatalytic activities for both reactions. The photocatalytic activities depended on the mass ratio of CdS![[thin space (1/6-em)]](https://www.rsc.org/images/entities/char_2009.gif) :
:![[thin space (1/6-em)]](https://www.rsc.org/images/entities/char_2009.gif) GR or CdS
GR or CdS![[thin space (1/6-em)]](https://www.rsc.org/images/entities/char_2009.gif) :
:![[thin space (1/6-em)]](https://www.rsc.org/images/entities/char_2009.gif) CNT in the nanocomposites. Under optimized mass ratios, the CdS–GR was more efficient than the CdS–CNT. Our characterizations suggested that CdS nanoparticles of ∼35 nm in size were dispersed on the graphene sheets or CNT surfaces in the nanocomposites. Significant band-gap narrowing was observed due to the incorporation of GR or CNT into CdS, indicating the strong interactions between CdS and GR or CNT. The transient photocurrent response studies suggested a more efficient separation of photogenerated electrons and holes. The stronger interaction or larger contact interface between CdS and GR was proposed to accelerate the transfer of photogenerated electrons from CdS to GR more efficiently, resulting in higher photocatalytic activities of the CdS–GR composite.
CNT in the nanocomposites. Under optimized mass ratios, the CdS–GR was more efficient than the CdS–CNT. Our characterizations suggested that CdS nanoparticles of ∼35 nm in size were dispersed on the graphene sheets or CNT surfaces in the nanocomposites. Significant band-gap narrowing was observed due to the incorporation of GR or CNT into CdS, indicating the strong interactions between CdS and GR or CNT. The transient photocurrent response studies suggested a more efficient separation of photogenerated electrons and holes. The stronger interaction or larger contact interface between CdS and GR was proposed to accelerate the transfer of photogenerated electrons from CdS to GR more efficiently, resulting in higher photocatalytic activities of the CdS–GR composite.
1. Introduction
Semiconductor photocatalysts have attracted much attention in recent years because of their potential in solving global energy and environmental problems. Many photocatalysts have been reported for the splitting of water in the presence or absence of sacrificial agents, producing H2 as a clean energy source, and for the degradation of organic pollutants.1–14 However, most of these catalysts require ultraviolet (UV) light and their efficiencies are far from practical application requirements. The development of efficient visible-light-responsive photocatalysts is a highly challenging but desirable goal for the effective utilization of solar energy because visible light in the solar spectrum is much more abundant (∼43%) than UV light (∼4%).11CdS, which possesses a bandgap of ∼2.4 eV, is a simple and probably the most extensively studied visible-light-driven photocatalyst.15,16 However, the efficiency of CdS is very low because of the rapid recombination of the photogenerated electrons and holes. Most of the studies concerning CdS are focused on the enhancement of photocatalytic efficiencies by preparing nanocomposites containing CdS and other semiconductors, such as TiO2, ZnO, MoS2, PdS or layered titanate nanosheets, to suppress the fast recombination of electrons and holes.17–22
On the other hand, recent studies have revealed that carbon nanomaterials, particularly carbon nanotubes (CNTs), are promising co-catalysts in photocatalysis. The enhancement effects of CNTs on the photocatalytic performance of TiO2, a UV-light-driven photocatalyst, have been investigated by several research groups.23–26 It is proposed that CNTs are capable of accepting, transporting and storing electrons, and thus retarding or hindering the recombination of the electrons with the holes remaining on the semiconductor particles.23,25 However, the studies on the enhancement effects of carbon nanomaterials on photocatalytic behaviors of CdS are not numerous. Kamat and co-workers27 once reported that the deposition of CdS onto CNTs could lead to a fast electron transfer from photo-excited CdS into CNTs. Recently, several studies disclosed that the incorporation of CNTs into CdS could promote its photocatalytic performance.28,29
Graphene (GR), which is a two-dimensional sp2-hybridized carbon nanosheet, possesses many unique properties such as a very high theoretical specific surface area, high mobility of charge carriers and good mechanical strength.30–34 The use of GR as a co-catalyst in photocatalysis has drawn increasing attention recently.13,35 Some studies have found that the incorporation of GR into TiO2 can enhance the photocatalytic performance for the degradation of organic dyes and the evolution of H2 from aqueous solutions containing sacrificial agents, such as methanol, under UV-light irradiation.13,36–39
Very few studies have been devoted to investigating the photocatalytic properties of CdS–GR composites.40,41 Yu and co-workers40 recently reported an interesting study on the use of CdS–GR composites, prepared by a solvothermal method42 at 453 K, in which graphene oxide (GO), Cd(Ac)2 and dimethyl sulfoxide (DMSO) were used as precursors for H2 evolution from a 10% lactic acid aqueous solution under visible-light irradiation. Compared to CdS alone, the combination of GR into CdS in the presence of a Pt co-catalyst afforded a H2 formation rate ∼4.9 times higher. The use of DMSO as the precursor for sulfide and the solvent in the preparation would result in large amounts of sulfur-containing organic waste and is not environmentally friendly. Xu and co-workers41 prepared nitrogen-doped graphene (N-GR) by annealing GO in an NH3 gas flow at 773 K, and a CdS–N-GR composite by precipitating CdS in the suspension containing N-GR. Photocatalytic studies revealed that the CdS–N-GR composite showed a rate of H2 evolution from an aqueous solution of Na2S and Na2SO3 ∼5 times higher than CdS alone. The CdS–GR composite, which was prepared by the same method using GR instead of N-GR, exhibited a rate of H2 evolution only twice as high as CdS. As N-GR and GR are both hydrophobic, the interactions between CdS and these carbon materials may be not strong enough. In fact, a large fraction of N-GR or GR could not be well dispersed in aqueous solution.41
Therefore, it is still necessary to develop an environmentally benign method for the preparation of CdS–GR composites with strong interactions between CdS and GR. Moreover, although both GR40,41 and CNT28,29 have been demonstrated to enhance the photocatalytic performances of CdS, there has been no study devoted to comparing the promotional effects of GR and CNT in composites with CdS. Xu and co-workers38 once proposed that the role of GR was in essence the same as that of CNT in promoting the photocatalytic performance of TiO2 in the degradation of volatile aromatic pollutants. To clarify the advantages of GR or CNT as a co-catalyst in photocatalysis is helpful for the rational design of efficient carbon material-promoted photocatalysts.43
Herein, we report the preparation of CdS–GR composites by a new hydrothermal method using Cd(Ac)2, Na2S and GO as precursors. This method is environmentally benign because no organic sulfur-containing compounds are formed. Moreover, the precursor, i.e., GO, which contains a high concentration of oxygen-containing functional groups and is hydrophilic, can be well dispersed in aqueous solutions.34 Stronger interactions between CdS and GR can be expected by using hydrophilic GO instead of hydrophobic GR as the precursor. The photocatalytic behaviors of the prepared CdS–GR composites, for the evolution of H2 from an aqueous solution containing Na2S and Na2SO3 and the degradation of methyl orange (MO) under visible-light irradiation, are both studied to gain insight into the effect of GR on the photocatalytic properties of CdS. The present paper also contributes by comparing systematically the catalytic behaviours of the CdS–GR and CdS–CNT composites.
2. Experimental
2.1. Preparation of catalysts
GO was synthesized from graphite powder by the method reported by Hummers and Offeman,44 and the detailed synthetic procedures were described in our previous paper.39 Multi-walled CNTs with outer diameters of 20–60 nm and inner diameters of 3–5 nm were synthesized by an established method via CH4 decomposition over a Ni-MgO catalyst.45 The as-synthesized CNTs were pre-treated with concentrated HNO3 at 413 K under refluxing conditions to remove amorphous carbon and the remaining Ni catalyst. The functional groups, such as carboxylic and hydroxyl groups, were also generated and the hydrophilicity of CNTs was increased after the pre-treatment.46 For the preparation of CdS nanoparticles, the aqueous solution of Na2S was first added dropwise into an aqueous solution of Cd(Ac)2 under vigorous stirring. After being stirred for 24 h, the obtained suspension was transferred into a Teflon-lined autoclave and was subjected to hydrothermal treatment at 453 K for 40 h. The solid CdS powders were then collected by centrifugation, washed repeatedly with deionized water, and dried in vacuum at 333 K.For the preparation of CdS–GR nanocomposites, GO was first dissolved in H2O by ultrasonic treatment for 1 h to give a yellow-brown solution. Then, Cd(Ac)2 was dissolved in the aqueous solution containing GO. Subsequently, the aqueous solution of Na2S was added dropwise to the solution containing GO and Cd(Ac)2 under vigorous stirring, and the suspension was further stirred for 24 h. The mixture was transferred into a Teflon-lined autoclave and was subjected to hydrothermal treatment at 453 K for 40 h. It was expected that both the reduction of GO to GR and the loading of CdS could be achieved during the hydrothermal process.36,38,39 The resultant solid was recovered by centrifugation, washed thoroughly with deionized water, and dried in vacuum at 353 K. The same procedure was also adopted for the preparation of CdS–CNT nanocomposites except for employing CNT to replace GO. For comparison, a CdS–TiO2 composite was prepared by a similar procedure using TiO2 (P25) instead of GR or CNT.
2.2. Catalytic reactions
The photocatalytic H2 evolution was carried out in a Pyrex reaction cell connected to a closed gas circulation and evacuation system. The light source was a 200 W Xenon arc lamp (PLS-SXE300, Beijing Trusttech Co., Ltd.) with a UV cut-off filter (λ ≥ 420 nm). The focused intensity on the reaction cell was ∼90 mW cm−2. Typically, the photocatalyst (100 mg) was suspended in an aqueous solution (100 mL) containing 0.1 M Na2S and 0.05 M Na2SO3, which were used as sacrificial agents. The amount of H2 evolved was determined with an online gas chromatograph (Techcomp; GC-7890II) equipped with a molecular 5 A column and TCD detector. N2 was used as the carrier gas.The photodegradation of MO was performed in a quartz tube under the irradiation of visible light. Typically, 0.050 g of the photocatalyst was suspended in 50 mL of 0.010 g L−1 dye solution. The light source was a 200 W Xenon lamp with a UV cut-off filter (λ ≥ 420 nm). The suspension was first magnetically stirred in the dark in order to establish an adsorption and desorption equilibrium of dyes on the catalyst surface. Then, the reaction vessel was exposed to the visible-light irradiation. The reaction was performed at room temperature under continuous stirring. At specific time intervals, the reaction solution was analyzed by a UV-vis spectrophotometer. The degree of degradation was expressed by C/C0, which is the ratio of the temporal MO concentration to the initial MO concentration after absorption equilibrium in the dark. The C/C0 was proportional to the A/A0, which is the normalized maximum absorbance occurring at 465 nm.
2.3. Characterisation of catalysts
Powder X-ray diffraction (XRD) patterns were recorded on a Panalytical X'pert Pro diffractometer using Cu-Kα radiation (40 kV, 30 mA). X-ray photoelectron spectroscopy (XPS) measurements were performed on a Quantum 2000 Scanning ESCA Microprobe (Physical Electronics) using Al-Kα radiation (1846.6 eV) as the X-ray source. Diffusion reflectance UV-visible (UV-vis) spectra were recorded on a Varian-Cary 5000 spectrometer equipped with a diffuse reflectance accessory. The spectra were collected with BaSO4 as a reference. Transmission electron microscopy (TEM) measurements were performed on a JEM-2100 electron microscope operated at an acceleration voltage of 200 kV.The total organic carbon (TOC) values of the degradation of MO were measured with a TOC-5000A instrument (Shimadzu, Japan). The terephthalic acid fluorescence probe was employed to detect hydroxyl (OH) radicals possibly generated during the degradation of MO.47,48 It is known that the OH radical reacts with terephthalic acid (TA) forming TAOH, which fluoresces at ∼426 nm on the excitation of its own 312 nm absorption band.47 The fluorescence spectra were recorded on a fluorescence spectrophotometer (Hitachi F-7000, Japan). The detailed experimental procedures were similar to those for the photocatalytic activity measurements except that the aqueous dye solution was replaced by a 5 × 10⁻³ M TA aqueous solution containing 0.01 M NaOH.
The photoelectrochemical measurements were carried out using an Ivium CompactStat (Holand), using a standard three-electrode cell with a working electrode, a platinum wire as the counter electrode, and an SCE electrode as the reference electrode. A 0.5 M solution of Na2SO4 was used as the electrolyte. The working electrode was prepared by cleaning an F-doped SnO2-coated glass (FTO glass, 1 cm × 2 cm). The photocatalyst was dispersed in ethanol, and the suspension was added dropwise directly onto the FTO by microsyringe with a gentle stream of air to speed drying. The film was dried under 393 K for 1 h, and the typical surface density of the photocatalyst was 1 mg cm−2.
3. Results and discussion
3.1. Photocatalytic behaviors of CdS–GR and CdS–CNT for H2 evolution
Fig. 1 shows the amount of H2 evolved from the aqueous solution containing a 0.1 M Na2S and 0.05 M Na2SO3 over the CdS–GR composites, with different mass ratios of CdS![[thin space (1/6-em)]](https://www.rsc.org/images/entities/char_2009.gif) :
:![[thin space (1/6-em)]](https://www.rsc.org/images/entities/char_2009.gif) GR under visible-light irradiation. The amount of H2 evolved over each catalyst increased proportionally to the irradiation time. It is noteworthy that GR alone is inactive under our reaction conditions. The incorporation of GR into CdS significantly accelerated the amount of H2 evolved. All the CdS–GR composites examined here (mass ratios of CdS
GR under visible-light irradiation. The amount of H2 evolved over each catalyst increased proportionally to the irradiation time. It is noteworthy that GR alone is inactive under our reaction conditions. The incorporation of GR into CdS significantly accelerated the amount of H2 evolved. All the CdS–GR composites examined here (mass ratios of CdS![[thin space (1/6-em)]](https://www.rsc.org/images/entities/char_2009.gif) :
:![[thin space (1/6-em)]](https://www.rsc.org/images/entities/char_2009.gif) GR = 1
GR = 1![[thin space (1/6-em)]](https://www.rsc.org/images/entities/char_2009.gif) :
:![[thin space (1/6-em)]](https://www.rsc.org/images/entities/char_2009.gif) 0.005–1
0.005–1![[thin space (1/6-em)]](https://www.rsc.org/images/entities/char_2009.gif) :
:![[thin space (1/6-em)]](https://www.rsc.org/images/entities/char_2009.gif) 0.1) exhibited higher activities for H2 evolution than CdS alone. Fig. 1 also suggests that the mass ratio of CdS
0.1) exhibited higher activities for H2 evolution than CdS alone. Fig. 1 also suggests that the mass ratio of CdS![[thin space (1/6-em)]](https://www.rsc.org/images/entities/char_2009.gif) :
:![[thin space (1/6-em)]](https://www.rsc.org/images/entities/char_2009.gif) GR plays a key role in determining the amount of H2 evolution. The composite with a CdS
GR plays a key role in determining the amount of H2 evolution. The composite with a CdS![[thin space (1/6-em)]](https://www.rsc.org/images/entities/char_2009.gif) :
:![[thin space (1/6-em)]](https://www.rsc.org/images/entities/char_2009.gif) GR mass ratio of 1
GR mass ratio of 1![[thin space (1/6-em)]](https://www.rsc.org/images/entities/char_2009.gif) :
:![[thin space (1/6-em)]](https://www.rsc.org/images/entities/char_2009.gif) 0.01 showed the highest H2 evolution activity. Both higher and lower CdS
0.01 showed the highest H2 evolution activity. Both higher and lower CdS![[thin space (1/6-em)]](https://www.rsc.org/images/entities/char_2009.gif) :
:![[thin space (1/6-em)]](https://www.rsc.org/images/entities/char_2009.gif) GR ratios were disadvantageous for H2 evolution.
GR ratios were disadvantageous for H2 evolution.
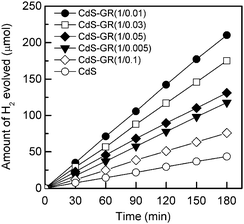 | ||
Fig. 1 Amount of H2 evolved from the aqueous solution containing 0.1 M Na2S and 0.05 M Na2SO3 over the CdS–GR composites with different mass ratios of CdS![[thin space (1/6-em)]](https://www.rsc.org/images/entities/char_2009.gif) : :![[thin space (1/6-em)]](https://www.rsc.org/images/entities/char_2009.gif) GR under visible-light irradiation. Reaction conditions: catalyst, 0.10 g; aqueous solution, 100 mL; light source, 200 W Xe lamp (λ ≥ 420 nm). GR under visible-light irradiation. Reaction conditions: catalyst, 0.10 g; aqueous solution, 100 mL; light source, 200 W Xe lamp (λ ≥ 420 nm). | ||
The photocatalytic properties of the CdS–CNT composites for H2 evolution are shown in Fig. 2. The combination of CNT with CdS also enhanced the amount of H2 evolved. The H2 formation activity increased in the order of CdS < CdS–CNT (1![[thin space (1/6-em)]](https://www.rsc.org/images/entities/char_2009.gif) :
:![[thin space (1/6-em)]](https://www.rsc.org/images/entities/char_2009.gif) 0.005) < CdS–CNT (1
0.005) < CdS–CNT (1![[thin space (1/6-em)]](https://www.rsc.org/images/entities/char_2009.gif) :
:![[thin space (1/6-em)]](https://www.rsc.org/images/entities/char_2009.gif) 0.01) < CdS–CNT (1
0.01) < CdS–CNT (1![[thin space (1/6-em)]](https://www.rsc.org/images/entities/char_2009.gif) :
:![[thin space (1/6-em)]](https://www.rsc.org/images/entities/char_2009.gif) 0.1) < CdS–CNT (1
0.1) < CdS–CNT (1![[thin space (1/6-em)]](https://www.rsc.org/images/entities/char_2009.gif) :
:![[thin space (1/6-em)]](https://www.rsc.org/images/entities/char_2009.gif) 0.03) < CdS–CNT (1
0.03) < CdS–CNT (1![[thin space (1/6-em)]](https://www.rsc.org/images/entities/char_2009.gif) :
:![[thin space (1/6-em)]](https://www.rsc.org/images/entities/char_2009.gif) 0.05). In other words, the H2 evolution activity increased with an increasing fraction of CNT in the nanocomposites and arrived at a maximum as the CNT
0.05). In other words, the H2 evolution activity increased with an increasing fraction of CNT in the nanocomposites and arrived at a maximum as the CNT![[thin space (1/6-em)]](https://www.rsc.org/images/entities/char_2009.gif) :
:![[thin space (1/6-em)]](https://www.rsc.org/images/entities/char_2009.gif) CdS mass ratio reached 0.05
CdS mass ratio reached 0.05![[thin space (1/6-em)]](https://www.rsc.org/images/entities/char_2009.gif) :
:![[thin space (1/6-em)]](https://www.rsc.org/images/entities/char_2009.gif) 1. A further increase in the mass ratio of CNT
1. A further increase in the mass ratio of CNT![[thin space (1/6-em)]](https://www.rsc.org/images/entities/char_2009.gif) :
:![[thin space (1/6-em)]](https://www.rsc.org/images/entities/char_2009.gif) CdS to 0.1
CdS to 0.1![[thin space (1/6-em)]](https://www.rsc.org/images/entities/char_2009.gif) :
:![[thin space (1/6-em)]](https://www.rsc.org/images/entities/char_2009.gif) 1 decreased the activity of H2 evolution.
1 decreased the activity of H2 evolution.
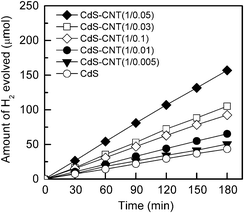 | ||
Fig. 2 Amount of H2 evolved from the aqueous solution containing 0.1 M Na2S and 0.05 M Na2SO3 over the CdS–CNT composites with different mass ratios of CdS![[thin space (1/6-em)]](https://www.rsc.org/images/entities/char_2009.gif) : :![[thin space (1/6-em)]](https://www.rsc.org/images/entities/char_2009.gif) CNT, under visible-light irradiation. Reaction conditions: catalyst, 0.10 g; aqueous solution, 100 mL; light source, 200 W Xe lamp (λ ≥ 420 nm). CNT, under visible-light irradiation. Reaction conditions: catalyst, 0.10 g; aqueous solution, 100 mL; light source, 200 W Xe lamp (λ ≥ 420 nm). | ||
The rates of H2 evolution over the CdS–GR and the CdS–CNT composites with optimized mass ratios of CdS![[thin space (1/6-em)]](https://www.rsc.org/images/entities/char_2009.gif) :
:![[thin space (1/6-em)]](https://www.rsc.org/images/entities/char_2009.gif) GR and CdS
GR and CdS![[thin space (1/6-em)]](https://www.rsc.org/images/entities/char_2009.gif) :
:![[thin space (1/6-em)]](https://www.rsc.org/images/entities/char_2009.gif) CNT are compared in Fig. 3. CdS alone provided an H2 evolution rate of 14.5 μmol h−1. Previous studies demonstrated that the combination of CdS with TiO2 could also enhance the photocatalytic performance of CdS for H2 evolution, and the CdS–TiO2 composites with CdS
CNT are compared in Fig. 3. CdS alone provided an H2 evolution rate of 14.5 μmol h−1. Previous studies demonstrated that the combination of CdS with TiO2 could also enhance the photocatalytic performance of CdS for H2 evolution, and the CdS–TiO2 composites with CdS![[thin space (1/6-em)]](https://www.rsc.org/images/entities/char_2009.gif) :
:![[thin space (1/6-em)]](https://www.rsc.org/images/entities/char_2009.gif) TiO2 mass ratios of ≥ 1.5
TiO2 mass ratios of ≥ 1.5![[thin space (1/6-em)]](https://www.rsc.org/images/entities/char_2009.gif) :
:![[thin space (1/6-em)]](https://www.rsc.org/images/entities/char_2009.gif) 1 exhibited better performances.17 Our result showed that the CdS–TiO2 composite with a CdS
1 exhibited better performances.17 Our result showed that the CdS–TiO2 composite with a CdS![[thin space (1/6-em)]](https://www.rsc.org/images/entities/char_2009.gif) :
:![[thin space (1/6-em)]](https://www.rsc.org/images/entities/char_2009.gif) TiO2 mass ratio of 2
TiO2 mass ratio of 2![[thin space (1/6-em)]](https://www.rsc.org/images/entities/char_2009.gif) :
:![[thin space (1/6-em)]](https://www.rsc.org/images/entities/char_2009.gif) 1 provided an H2 evolution rate of 34.4 μmol h−1, which was ∼2.4 times that of CdS alone. Fig. 3 reveals that both the CdS–GR and the CdS–CNT composites displayed higher rates of H2 evolution than CdS alone and the CdS–TiO2 composite, indicating the higher efficiency of GR or CNT as the co-catalyst of CdS. The CdS–GR composite was more efficient than the CdS–CNT composite. The H2 evolution rate over the CdS–GR composite reached 70 μmol h−1, which was 4.8 times higher than CdS and 1.3 times higher than the CdS–CNT (52 μmol h−1). GR alone was inactive for the photocatalysis of H2 evolution under our reaction conditions. Moreover, we have examined the photocatalytic performance of a physical mixture of CdS and GR with a CdS
1 provided an H2 evolution rate of 34.4 μmol h−1, which was ∼2.4 times that of CdS alone. Fig. 3 reveals that both the CdS–GR and the CdS–CNT composites displayed higher rates of H2 evolution than CdS alone and the CdS–TiO2 composite, indicating the higher efficiency of GR or CNT as the co-catalyst of CdS. The CdS–GR composite was more efficient than the CdS–CNT composite. The H2 evolution rate over the CdS–GR composite reached 70 μmol h−1, which was 4.8 times higher than CdS and 1.3 times higher than the CdS–CNT (52 μmol h−1). GR alone was inactive for the photocatalysis of H2 evolution under our reaction conditions. Moreover, we have examined the photocatalytic performance of a physical mixture of CdS and GR with a CdS![[thin space (1/6-em)]](https://www.rsc.org/images/entities/char_2009.gif) :
:![[thin space (1/6-em)]](https://www.rsc.org/images/entities/char_2009.gif) GR mass ratio of 1
GR mass ratio of 1![[thin space (1/6-em)]](https://www.rsc.org/images/entities/char_2009.gif) :
:![[thin space (1/6-em)]](https://www.rsc.org/images/entities/char_2009.gif) 0.01. This mixture showed almost the same rate of H2 evolution as CdS alone, indicating that the physical mixing was ineffective. This implies that the interaction between GR and CdS plays a key role in enhancing the photocatalytic performance.
0.01. This mixture showed almost the same rate of H2 evolution as CdS alone, indicating that the physical mixing was ineffective. This implies that the interaction between GR and CdS plays a key role in enhancing the photocatalytic performance.
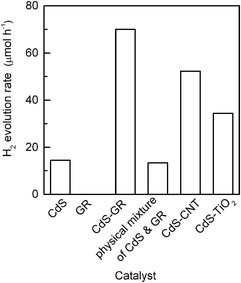 | ||
Fig. 3 Comparison of photocatalytic performances of CdS, GR, CdS–GR composite (CdS![[thin space (1/6-em)]](https://www.rsc.org/images/entities/char_2009.gif) : :![[thin space (1/6-em)]](https://www.rsc.org/images/entities/char_2009.gif) GR = 1 GR = 1![[thin space (1/6-em)]](https://www.rsc.org/images/entities/char_2009.gif) : :![[thin space (1/6-em)]](https://www.rsc.org/images/entities/char_2009.gif) 0.01), physical mixture of CdS and GR (CdS 0.01), physical mixture of CdS and GR (CdS![[thin space (1/6-em)]](https://www.rsc.org/images/entities/char_2009.gif) : :![[thin space (1/6-em)]](https://www.rsc.org/images/entities/char_2009.gif) GR = 1 GR = 1![[thin space (1/6-em)]](https://www.rsc.org/images/entities/char_2009.gif) : :![[thin space (1/6-em)]](https://www.rsc.org/images/entities/char_2009.gif) 0.01), CdS–CNT composite (CdS 0.01), CdS–CNT composite (CdS![[thin space (1/6-em)]](https://www.rsc.org/images/entities/char_2009.gif) : :![[thin space (1/6-em)]](https://www.rsc.org/images/entities/char_2009.gif) CNT = 1 CNT = 1![[thin space (1/6-em)]](https://www.rsc.org/images/entities/char_2009.gif) : :![[thin space (1/6-em)]](https://www.rsc.org/images/entities/char_2009.gif) 0.05) and CdS–TiO2 (CdS 0.05) and CdS–TiO2 (CdS![[thin space (1/6-em)]](https://www.rsc.org/images/entities/char_2009.gif) : :![[thin space (1/6-em)]](https://www.rsc.org/images/entities/char_2009.gif) TiO2 = 2 TiO2 = 2![[thin space (1/6-em)]](https://www.rsc.org/images/entities/char_2009.gif) : :![[thin space (1/6-em)]](https://www.rsc.org/images/entities/char_2009.gif) 1) composite for the evolution of H2 from the aqueous solution containing 0.1 M Na2S and 0.05 M Na2SO3. Reaction conditions: catalyst, 0.10 g; aqueous solution, 100 mL; light source, 200 W Xe lamp (λ ≥ 420 nm). 1) composite for the evolution of H2 from the aqueous solution containing 0.1 M Na2S and 0.05 M Na2SO3. Reaction conditions: catalyst, 0.10 g; aqueous solution, 100 mL; light source, 200 W Xe lamp (λ ≥ 420 nm). | ||
Instability was a problem for CdS-based photocatalysts because of the possible photocorrosion of CdS in aqueous medium.49 Thus, we have examined the stability of the CdS–GR composite (CdS![[thin space (1/6-em)]](https://www.rsc.org/images/entities/char_2009.gif) :
:![[thin space (1/6-em)]](https://www.rsc.org/images/entities/char_2009.gif) GR = 1
GR = 1![[thin space (1/6-em)]](https://www.rsc.org/images/entities/char_2009.gif) :
:![[thin space (1/6-em)]](https://www.rsc.org/images/entities/char_2009.gif) 0.01). After each run, the CdS–GR catalyst was evacuated for 30 min and was re-used in the next run. The result in Fig. 4 manifests that no deactivation occurs for 5 recycles.
0.01). After each run, the CdS–GR catalyst was evacuated for 30 min and was re-used in the next run. The result in Fig. 4 manifests that no deactivation occurs for 5 recycles.
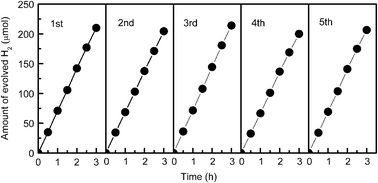 | ||
Fig. 4 Changes of photocatalytic performances of CdS–GR composite (CdS![[thin space (1/6-em)]](https://www.rsc.org/images/entities/char_2009.gif) : :![[thin space (1/6-em)]](https://www.rsc.org/images/entities/char_2009.gif) GR = 1 GR = 1![[thin space (1/6-em)]](https://www.rsc.org/images/entities/char_2009.gif) : :![[thin space (1/6-em)]](https://www.rsc.org/images/entities/char_2009.gif) 0.01) during repeated uses for the evolution of H2 from the aqueous solution containing 0.1 M Na2S and 0.05 M Na2SO3. Reaction conditions: catalyst, 0.10 g; aqueous solution, 100 mL; light source, 200 W Xe lamp (λ ≥ 420 nm). 0.01) during repeated uses for the evolution of H2 from the aqueous solution containing 0.1 M Na2S and 0.05 M Na2SO3. Reaction conditions: catalyst, 0.10 g; aqueous solution, 100 mL; light source, 200 W Xe lamp (λ ≥ 420 nm). | ||
3.2. Photocatalytic behaviors of CdS–GR and CdS–CNT for degradation of MO
Photocatalytic degradation is an effective means to eliminate organic dyes in aqueous solutions.1,5 Here, we have studied the photocatalytic behavior of the CdS–GR and the CdS–CNT composites for the degradation of MO, which is one of the representative organic dyes,5 under visible-light irradiation.It was reported that the incorporation of GR into TiO2 could increase the adsorption of organic dyes onto the photocatalysts, contributing to the enhancement in degradation activities.36,38Fig. 5 shows the remaining concentration fractions of MO and the corresponding sample pictures for the CdS–GR composites with different mass ratios of CdS![[thin space (1/6-em)]](https://www.rsc.org/images/entities/char_2009.gif) :
:![[thin space (1/6-em)]](https://www.rsc.org/images/entities/char_2009.gif) GR after the adsorption equilibrium in the dark. The adsorption of MO was enhanced by the presence of GR in the composites, and a larger amount of MO molecules were adsorbed onto the surface of the CdS–GR composite with a higher fraction of GR. The variation of the degree of degradation (C/C0) with the time of irradiation under visible light for each catalyst is plotted in Fig. 6. The degrees of degradation for the CdS–GR composites were all significantly higher than that of CdS alone. The photodegradation performance increased with an increase in the mass ratio of GR
GR after the adsorption equilibrium in the dark. The adsorption of MO was enhanced by the presence of GR in the composites, and a larger amount of MO molecules were adsorbed onto the surface of the CdS–GR composite with a higher fraction of GR. The variation of the degree of degradation (C/C0) with the time of irradiation under visible light for each catalyst is plotted in Fig. 6. The degrees of degradation for the CdS–GR composites were all significantly higher than that of CdS alone. The photodegradation performance increased with an increase in the mass ratio of GR![[thin space (1/6-em)]](https://www.rsc.org/images/entities/char_2009.gif) :
:![[thin space (1/6-em)]](https://www.rsc.org/images/entities/char_2009.gif) CdS from 0 to 0.01
CdS from 0 to 0.01![[thin space (1/6-em)]](https://www.rsc.org/images/entities/char_2009.gif) :
:![[thin space (1/6-em)]](https://www.rsc.org/images/entities/char_2009.gif) 1 and reached the maximum at 0.01
1 and reached the maximum at 0.01![[thin space (1/6-em)]](https://www.rsc.org/images/entities/char_2009.gif) :
:![[thin space (1/6-em)]](https://www.rsc.org/images/entities/char_2009.gif) 1. Further increases in the fraction of GR decreased the photodegradation activity.
1. Further increases in the fraction of GR decreased the photodegradation activity.
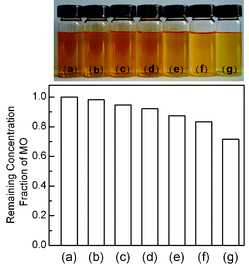 | ||
Fig. 5 Sample pictures and bar plots showing the remaining MO in the aqueous solution after reaching the adsorption equilibrium in the dark for the CdS–GR composites with different mass ratios of CdS![[thin space (1/6-em)]](https://www.rsc.org/images/entities/char_2009.gif) : :![[thin space (1/6-em)]](https://www.rsc.org/images/entities/char_2009.gif) RGO. (a) Initial MO solution, (b) CdS, (c) CdS–GR (CdS RGO. (a) Initial MO solution, (b) CdS, (c) CdS–GR (CdS![[thin space (1/6-em)]](https://www.rsc.org/images/entities/char_2009.gif) : :![[thin space (1/6-em)]](https://www.rsc.org/images/entities/char_2009.gif) GR = 1 GR = 1![[thin space (1/6-em)]](https://www.rsc.org/images/entities/char_2009.gif) : :![[thin space (1/6-em)]](https://www.rsc.org/images/entities/char_2009.gif) 0.005), (d) CdS–GR (CdS 0.005), (d) CdS–GR (CdS![[thin space (1/6-em)]](https://www.rsc.org/images/entities/char_2009.gif) : :![[thin space (1/6-em)]](https://www.rsc.org/images/entities/char_2009.gif) GR = 1 GR = 1![[thin space (1/6-em)]](https://www.rsc.org/images/entities/char_2009.gif) : :![[thin space (1/6-em)]](https://www.rsc.org/images/entities/char_2009.gif) 0.01), (e) CdS–GR (CdS) 0.01), (e) CdS–GR (CdS)![[thin space (1/6-em)]](https://www.rsc.org/images/entities/char_2009.gif) : :![[thin space (1/6-em)]](https://www.rsc.org/images/entities/char_2009.gif) GR = 1 GR = 1![[thin space (1/6-em)]](https://www.rsc.org/images/entities/char_2009.gif) : :![[thin space (1/6-em)]](https://www.rsc.org/images/entities/char_2009.gif) 0.03), (f) CdS–GR (CdS 0.03), (f) CdS–GR (CdS![[thin space (1/6-em)]](https://www.rsc.org/images/entities/char_2009.gif) : :![[thin space (1/6-em)]](https://www.rsc.org/images/entities/char_2009.gif) GR = 1 GR = 1![[thin space (1/6-em)]](https://www.rsc.org/images/entities/char_2009.gif) : :![[thin space (1/6-em)]](https://www.rsc.org/images/entities/char_2009.gif) 0.05), (g) CdS–GR (CdS 0.05), (g) CdS–GR (CdS![[thin space (1/6-em)]](https://www.rsc.org/images/entities/char_2009.gif) : :![[thin space (1/6-em)]](https://www.rsc.org/images/entities/char_2009.gif) GR = 1 GR = 1![[thin space (1/6-em)]](https://www.rsc.org/images/entities/char_2009.gif) : :![[thin space (1/6-em)]](https://www.rsc.org/images/entities/char_2009.gif) 0.1). 0.1). | ||
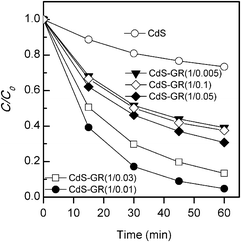 | ||
Fig. 6 Photocatalytic degradation of MO for the CdS–GR composites with different mass ratios of CdS![[thin space (1/6-em)]](https://www.rsc.org/images/entities/char_2009.gif) : :![[thin space (1/6-em)]](https://www.rsc.org/images/entities/char_2009.gif) GR under visible-light irradiation. Reaction conditions: catalyst, 0.050 g; aqueous dye solution, 50 mL; light source, 200 W Xe lamp (λ ≥ 420 nm). GR under visible-light irradiation. Reaction conditions: catalyst, 0.050 g; aqueous dye solution, 50 mL; light source, 200 W Xe lamp (λ ≥ 420 nm). | ||
Similar studies have been performed for the CdS–CNT composites with different mass ratios of CdS![[thin space (1/6-em)]](https://www.rsc.org/images/entities/char_2009.gif) :
:![[thin space (1/6-em)]](https://www.rsc.org/images/entities/char_2009.gif) CNT. As displayed in Fig. 7, the adsorption of MO in the dark was also enhanced in the presence of CNT, and the adsorption amount increased with the fraction of CNT in the composites. However, the comparison between Fig. 5 and Fig. 7 shows that the efficiency of the MO adsorption on the CdS–CNT is lower than that on the CdS–GR. Fig. 8 demonstrates that, similar to the photocatalytic H2 evolution, there also exists an optimum mass ratio of CNT
CNT. As displayed in Fig. 7, the adsorption of MO in the dark was also enhanced in the presence of CNT, and the adsorption amount increased with the fraction of CNT in the composites. However, the comparison between Fig. 5 and Fig. 7 shows that the efficiency of the MO adsorption on the CdS–CNT is lower than that on the CdS–GR. Fig. 8 demonstrates that, similar to the photocatalytic H2 evolution, there also exists an optimum mass ratio of CNT![[thin space (1/6-em)]](https://www.rsc.org/images/entities/char_2009.gif) :
:![[thin space (1/6-em)]](https://www.rsc.org/images/entities/char_2009.gif) CdS (0.03
CdS (0.03![[thin space (1/6-em)]](https://www.rsc.org/images/entities/char_2009.gif) :
:![[thin space (1/6-em)]](https://www.rsc.org/images/entities/char_2009.gif) 1) for the photodegradation of MO; both lower and higher CNT
1) for the photodegradation of MO; both lower and higher CNT![[thin space (1/6-em)]](https://www.rsc.org/images/entities/char_2009.gif) :
:![[thin space (1/6-em)]](https://www.rsc.org/images/entities/char_2009.gif) CdS mass ratios are unfavorable for the photodegradation reaction.
CdS mass ratios are unfavorable for the photodegradation reaction.
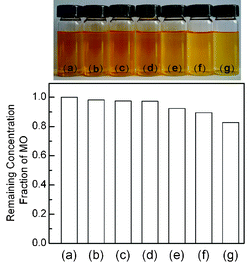 | ||
Fig. 7 Sample pictures and bar plots showing the remaining MO in the aqueous solution, after reaching the adsorption equilibrium in the dark for the CdS–CNT composites with different mass ratios of CdS![[thin space (1/6-em)]](https://www.rsc.org/images/entities/char_2009.gif) : :![[thin space (1/6-em)]](https://www.rsc.org/images/entities/char_2009.gif) CNT. (a) Initial MO solution, (b) CdS, (c) CdS–CNT (CdS CNT. (a) Initial MO solution, (b) CdS, (c) CdS–CNT (CdS![[thin space (1/6-em)]](https://www.rsc.org/images/entities/char_2009.gif) : :![[thin space (1/6-em)]](https://www.rsc.org/images/entities/char_2009.gif) CNT = 1 CNT = 1![[thin space (1/6-em)]](https://www.rsc.org/images/entities/char_2009.gif) : :![[thin space (1/6-em)]](https://www.rsc.org/images/entities/char_2009.gif) 0.005), (d) CdS–CNT (CdS 0.005), (d) CdS–CNT (CdS![[thin space (1/6-em)]](https://www.rsc.org/images/entities/char_2009.gif) : :![[thin space (1/6-em)]](https://www.rsc.org/images/entities/char_2009.gif) CNT = 1 CNT = 1![[thin space (1/6-em)]](https://www.rsc.org/images/entities/char_2009.gif) : :![[thin space (1/6-em)]](https://www.rsc.org/images/entities/char_2009.gif) 0.01), (e) CdS–CNT (CdS 0.01), (e) CdS–CNT (CdS![[thin space (1/6-em)]](https://www.rsc.org/images/entities/char_2009.gif) : :![[thin space (1/6-em)]](https://www.rsc.org/images/entities/char_2009.gif) CNT = 1 CNT = 1![[thin space (1/6-em)]](https://www.rsc.org/images/entities/char_2009.gif) : :![[thin space (1/6-em)]](https://www.rsc.org/images/entities/char_2009.gif) 0.03), (f) CdS–CNT (CdS 0.03), (f) CdS–CNT (CdS![[thin space (1/6-em)]](https://www.rsc.org/images/entities/char_2009.gif) : :![[thin space (1/6-em)]](https://www.rsc.org/images/entities/char_2009.gif) CNT = 1 CNT = 1![[thin space (1/6-em)]](https://www.rsc.org/images/entities/char_2009.gif) : :![[thin space (1/6-em)]](https://www.rsc.org/images/entities/char_2009.gif) 0.05), (g) CdS–CNT (CdS 0.05), (g) CdS–CNT (CdS![[thin space (1/6-em)]](https://www.rsc.org/images/entities/char_2009.gif) : :![[thin space (1/6-em)]](https://www.rsc.org/images/entities/char_2009.gif) CNT = 1 CNT = 1![[thin space (1/6-em)]](https://www.rsc.org/images/entities/char_2009.gif) : :![[thin space (1/6-em)]](https://www.rsc.org/images/entities/char_2009.gif) 0.1). 0.1). | ||
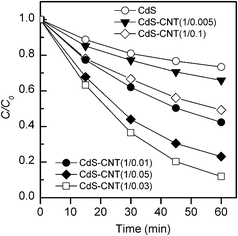 | ||
Fig. 8 Photocatalytic degradation of MO for the CdS–CNT composites with different mass ratios of CdS![[thin space (1/6-em)]](https://www.rsc.org/images/entities/char_2009.gif) : :![[thin space (1/6-em)]](https://www.rsc.org/images/entities/char_2009.gif) CNT under visible-light irradiation. Reaction conditions: catalyst, 0.050 g; aqueous dye solution, 50 mL; light source, 200 W Xe lamp (λ ≥ 420 nm). CNT under visible-light irradiation. Reaction conditions: catalyst, 0.050 g; aqueous dye solution, 50 mL; light source, 200 W Xe lamp (λ ≥ 420 nm). | ||
The comparison of the photodegradation activities between the two series of composites (Fig. 6 and 8) reveals that GR is more efficient for enhancing the catalytic performance of CdS. After 60 min irradiation, the degree of MO degradation for the optimized CdS–GR (1![[thin space (1/6-em)]](https://www.rsc.org/images/entities/char_2009.gif) :
:![[thin space (1/6-em)]](https://www.rsc.org/images/entities/char_2009.gif) 0.01) reached 95%, while that for the optimized CdS–CNT (1
0.01) reached 95%, while that for the optimized CdS–CNT (1![[thin space (1/6-em)]](https://www.rsc.org/images/entities/char_2009.gif) :
:![[thin space (1/6-em)]](https://www.rsc.org/images/entities/char_2009.gif) 0.03) was 88%. To make a better comparison, we have analyzed the kinetics by assuming a pseudo first-order reaction for the degradation of organic dyes.50 The data in Fig. 6 and 8 were fitted by using the following equation: ln(C0/C) = kt, where k was the apparent rate constant. From the lines plotted in Fig. 9 and using the data points at the initial reaction stage, we calculated the rate constant for each photocatalyst. Table 1 demonstrates that the rate constant of the CdS–GR composite with the optimum composition (GR
0.03) was 88%. To make a better comparison, we have analyzed the kinetics by assuming a pseudo first-order reaction for the degradation of organic dyes.50 The data in Fig. 6 and 8 were fitted by using the following equation: ln(C0/C) = kt, where k was the apparent rate constant. From the lines plotted in Fig. 9 and using the data points at the initial reaction stage, we calculated the rate constant for each photocatalyst. Table 1 demonstrates that the rate constant of the CdS–GR composite with the optimum composition (GR![[thin space (1/6-em)]](https://www.rsc.org/images/entities/char_2009.gif) :
:![[thin space (1/6-em)]](https://www.rsc.org/images/entities/char_2009.gif) CdS = 0.01
CdS = 0.01![[thin space (1/6-em)]](https://www.rsc.org/images/entities/char_2009.gif) :
:![[thin space (1/6-em)]](https://www.rsc.org/images/entities/char_2009.gif) 1) is 7.9 times higher than that of CdS alone and is 1.8 times higher than that of the CdS–CNT composite with the optimum composition (1
1) is 7.9 times higher than that of CdS alone and is 1.8 times higher than that of the CdS–CNT composite with the optimum composition (1![[thin space (1/6-em)]](https://www.rsc.org/images/entities/char_2009.gif) :
:![[thin space (1/6-em)]](https://www.rsc.org/images/entities/char_2009.gif) 0.03). These results allow us to conclude that, for both the photocatalytic evolution of H2 and the photodegradation of MO, the CdS–GR and CdS–CNT composites exhibit significantly better performances than CdS alone, and the presence of GR is more efficient for increasing the photocatalytic activity of CdS.
0.03). These results allow us to conclude that, for both the photocatalytic evolution of H2 and the photodegradation of MO, the CdS–GR and CdS–CNT composites exhibit significantly better performances than CdS alone, and the presence of GR is more efficient for increasing the photocatalytic activity of CdS.
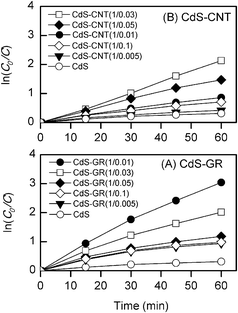 | ||
| Fig. 9 Pseudo first-order kinetic treatment for the photodegradation of MO with the CdS–GR (A) and CdS–CNT (B) composites under visible-light irradiation. Reaction conditions: catalyst, 0.050 g; aqueous dye solution, 50 mL; light source, 200 W Xe lamp (λ ≥ 420 nm). | ||
| Mass ratio of GR:CdS or CNT:CdS | Apparent rate constant (10−2 min−1) | |
|---|---|---|
| CdS–GR | CdS–CNT | |
| 0 (CdS alone) | 0.75 | 0.75 |
| 0.005 | 2.4 | 1.0 |
| 0.01 | 5.9 | 1.6 |
| 0.03 | 4.1 | 3.3 |
| 0.05 | 2.8 | 2.7 |
| 0.10 | 2.5 | 1.5 |
3.3. Possible reaction mechanism for photocatalytic degradation of MO
We have confirmed that, in the absence of our CdS-based photocatalyst (blank reaction), MO does not undergo self-sensitized degradation either with or without the addition of Na2S (Fig. 10). Thus, it is clear that the photocatalyst plays a crucial role in the degradation of MO.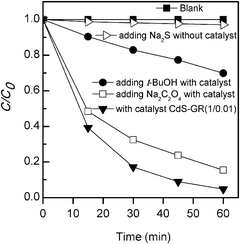 | ||
Fig. 10 Degradation of MO under different conditions. Standard reaction conditions: catalyst CdS–GR (1![[thin space (1/6-em)]](https://www.rsc.org/images/entities/char_2009.gif) : :![[thin space (1/6-em)]](https://www.rsc.org/images/entities/char_2009.gif) 0.01), 0.050 g; aqueous dye solution, 50 mL; light source, 200 W Xe lamp (λ ≥ 420 nm). Blank: without adding catalyst. 0.01), 0.050 g; aqueous dye solution, 50 mL; light source, 200 W Xe lamp (λ ≥ 420 nm). Blank: without adding catalyst. | ||
Concerning the nature of the active species for the oxidative degradation of MO, the photogenerated hole and the hydroxyl (OH) radical may be possible candidates. Further experiments have been performed to gain insight into the probable active species. We have examined the possibility of the photogenerated hole as the active species by adding sodium oxalate (Na2C2O4), which typically functions as a hole scavenger, into the reaction system. The result showed that the activity of MO degradation for CdS–GR (1![[thin space (1/6-em)]](https://www.rsc.org/images/entities/char_2009.gif) :
:![[thin space (1/6-em)]](https://www.rsc.org/images/entities/char_2009.gif) 0.01) after the addition of Na2C2O4 decreased only slightly (Fig. 10). On the other hand, the addition of tert-butanol (t-BuOH), a scavenger of OH radicals, caused a remarkable decrease in the performance of the photocatalytic degradation of MO (Fig. 10). This suggests that the OH radical may play a more important role than the photogenerated hole toward the degradation of MO.
0.01) after the addition of Na2C2O4 decreased only slightly (Fig. 10). On the other hand, the addition of tert-butanol (t-BuOH), a scavenger of OH radicals, caused a remarkable decrease in the performance of the photocatalytic degradation of MO (Fig. 10). This suggests that the OH radical may play a more important role than the photogenerated hole toward the degradation of MO.
We have detected further OH radicals by using the terephthalic acid fluorescence probe technique.47,48 In brief, if OH radicals exist in the reaction system, they can react with terephthalic acid (TA) forming TAOH, which fluoresces at ∼426 nm due to the excitation of its own 312 nm absorption band.47 We observed the fluorescence at ∼426 nm during our experiment for the suspension containing photocatalysts and an aqueous solution of TA, confirming the generation of OH radicals. Fig. 11 shows that the CdS–GR (1![[thin space (1/6-em)]](https://www.rsc.org/images/entities/char_2009.gif) :
:![[thin space (1/6-em)]](https://www.rsc.org/images/entities/char_2009.gif) 0.01) composite displays a much higher intensity of the fluorescence than the CdS–CNT composite (1
0.01) composite displays a much higher intensity of the fluorescence than the CdS–CNT composite (1![[thin space (1/6-em)]](https://www.rsc.org/images/entities/char_2009.gif) :
:![[thin space (1/6-em)]](https://www.rsc.org/images/entities/char_2009.gif) 0.03) and CdS alone. This suggests that a higher concentration of OH radicals has been generated in the case of the CdS–GR composite, which exhibits a higher activity in the photodegradation of MO (Table 1). As the photogenerated hole cannot oxidize H2O or HO− directly into OH radicals, we speculate that the OH radical may be generated from the activation of O2 by the photogenerated electrons via O−2 [eqn (1)–(3)].47,51
0.03) and CdS alone. This suggests that a higher concentration of OH radicals has been generated in the case of the CdS–GR composite, which exhibits a higher activity in the photodegradation of MO (Table 1). As the photogenerated hole cannot oxidize H2O or HO− directly into OH radicals, we speculate that the OH radical may be generated from the activation of O2 by the photogenerated electrons via O−2 [eqn (1)–(3)].47,51
| e−CB + O2 → O−2 | (1) |
| 2H+ + e−CB + O−2 → H2O2 | (2) |
| e¬ + H2O2 → ˙HO + HO− | (3) |
We have also measured the total organic carbon (TOC) values for the MO solutions before and after photodegradation. The results summarized in Table 2 show that the TOC values all decrease after the photodegradation, suggesting that part of MO can be mineralized to CO2 and H2O. Table 2 further demonstrates that the CdS–GR composite is more active than the CdS–CNT composite and both composites are more effective than CdS alone.
| Catalyst | TOC values (mg L−1) | |
|---|---|---|
| Initial | After photodegradation | |
| CdS | 4.8 | 4.3 |
CdS–GR (1![[thin space (1/6-em)]](https://www.rsc.org/images/entities/char_2009.gif) : :![[thin space (1/6-em)]](https://www.rsc.org/images/entities/char_2009.gif) 0.01) 0.01) |
4.8 | 2.1 |
CdS–CNT (1![[thin space (1/6-em)]](https://www.rsc.org/images/entities/char_2009.gif) : :![[thin space (1/6-em)]](https://www.rsc.org/images/entities/char_2009.gif) 0.03) 0.03) |
4.8 | 3.4 |
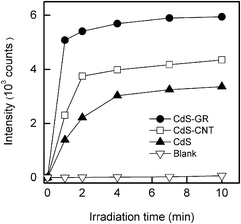 | ||
| Fig. 11 The changes to the fluorescence intensity of TAOH at 426 nm, at different irradiation times (λex = 312 nm). | ||
3.4. Characterizations of CdS–GR and CdS–CNT nanocomposites
The crystalline structures of the nanocomposites were studied by XRD. The XRD pattern of GO showed a strong and sharp diffraction peak at 2θ of 10.6° (Fig. 12), corresponding to a d-spacing of ∼0.84 nm. This was consistent with the lamellar structure of GO. For the GR obtained after the hydrothermal process without CdS, this strong diffraction peak disappeared and a very broad and very weak peak at 2θ of ∼25°, corresponding to a d-spacing of ∼0.36 nm, was observed. This suggests the reduction of GO to GR sheets during the hydrothermal process.52 The CNT displayed an intense peak at ∼26°, corresponding to a d-spacing of ∼0.34 nm for the sp2-carbon layer. CdS alone showed three main diffraction peaks at 2θ of 26.5°, 43.9° and 52.0°. These peaks were assigned to a cubic phase of CdS (zinc blend structure), while the other weak peaks at 2θ of 24.9°, 28.2°, 36.7° and 47.9° could be ascribed to a hexagonal phase of CdS (wurzite structure).22 Thus, the present CdS crystallites were composed of both cubic and hexagonal phases. The CdS–GR and the CdS–CNT composites displayed XRD patterns similar to that of CdS alone. The diffraction peak of CNT at ∼26° was probably overlapped with a main peak of CdS at almost the same position.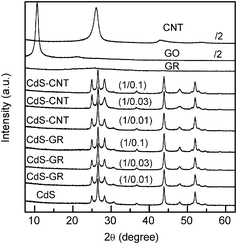 | ||
Fig. 12 XRD patterns of CdS, CNT, GO, GR, CdS–GR with different mass ratios of CdS![[thin space (1/6-em)]](https://www.rsc.org/images/entities/char_2009.gif) : :![[thin space (1/6-em)]](https://www.rsc.org/images/entities/char_2009.gif) GR, and CdS–CNT composites with different mass ratios of CdS GR, and CdS–CNT composites with different mass ratios of CdS![[thin space (1/6-em)]](https://www.rsc.org/images/entities/char_2009.gif) : :![[thin space (1/6-em)]](https://www.rsc.org/images/entities/char_2009.gif) CNT. CNT. | ||
The chemical states of elements on the surfaces of the nanocomposites were investigated by XPS. Fig. 13 shows the C 1s, Cd 3d and S 2p XPS spectra for the CdS–GR and the CdS–CNT composites together with carbon materials and CdS alone. As shown in Fig. 13A, two main peaks were observed for GO; the peak at 284.6 eV was assignable to the sp2-carbon species, while the peak at higher binding energies (286–288 eV) was ascribed to oxygenated carbon species such as hydroxyl and carboxyl groups. For the GR and the CdS–GR (CdS![[thin space (1/6-em)]](https://www.rsc.org/images/entities/char_2009.gif) :
:![[thin space (1/6-em)]](https://www.rsc.org/images/entities/char_2009.gif) GR = 1
GR = 1![[thin space (1/6-em)]](https://www.rsc.org/images/entities/char_2009.gif) :
:![[thin space (1/6-em)]](https://www.rsc.org/images/entities/char_2009.gif) 0.01), the peak at a higher binding energy position became significantly weakened or almost disappeared, indicating the reduction of GO to GR sheets in the CdS–GR nanocomposites. The C 1s spectra for CNT and the CdS–CNT (CdS
0.01), the peak at a higher binding energy position became significantly weakened or almost disappeared, indicating the reduction of GO to GR sheets in the CdS–GR nanocomposites. The C 1s spectra for CNT and the CdS–CNT (CdS![[thin space (1/6-em)]](https://www.rsc.org/images/entities/char_2009.gif) :
:![[thin space (1/6-em)]](https://www.rsc.org/images/entities/char_2009.gif) CNT = 1
CNT = 1![[thin space (1/6-em)]](https://www.rsc.org/images/entities/char_2009.gif) :
:![[thin space (1/6-em)]](https://www.rsc.org/images/entities/char_2009.gif) 0.05) are also displayed in Fig. 13A. The peaks of oxygenated carbon species for these samples were weak. The binding energies of Cd 3d5/2 were found at 406.0–406.2 eV for CdS, CdS–GR and CdS–CNT composites (Fig. 13B), suggesting that cadmium was in the Cd2+ state in all these samples.28 The S 2p3/2 peaks were observed at 161.9–162.0 eV for these samples (Fig. 13C), in agreement with the expectation that sulfur existed as the sulfide species (S2−).28 The C 1s, Cd 3d and S 2p XPS spectra for the CdS–GR composite (CdS
0.05) are also displayed in Fig. 13A. The peaks of oxygenated carbon species for these samples were weak. The binding energies of Cd 3d5/2 were found at 406.0–406.2 eV for CdS, CdS–GR and CdS–CNT composites (Fig. 13B), suggesting that cadmium was in the Cd2+ state in all these samples.28 The S 2p3/2 peaks were observed at 161.9–162.0 eV for these samples (Fig. 13C), in agreement with the expectation that sulfur existed as the sulfide species (S2−).28 The C 1s, Cd 3d and S 2p XPS spectra for the CdS–GR composite (CdS![[thin space (1/6-em)]](https://www.rsc.org/images/entities/char_2009.gif) :
:![[thin space (1/6-em)]](https://www.rsc.org/images/entities/char_2009.gif) GR = 1
GR = 1![[thin space (1/6-em)]](https://www.rsc.org/images/entities/char_2009.gif) :
:![[thin space (1/6-em)]](https://www.rsc.org/images/entities/char_2009.gif) 0.01) after the photocatalytic evolution of H2 are also shown in Fig. 13. No significant changes could be observed in these spectra, confirming that no photocorrosion of CdS occurred and the catalyst was stable under our reactions conditions.
0.01) after the photocatalytic evolution of H2 are also shown in Fig. 13. No significant changes could be observed in these spectra, confirming that no photocorrosion of CdS occurred and the catalyst was stable under our reactions conditions.
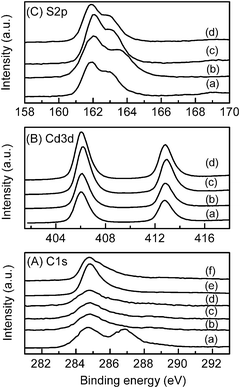 | ||
Fig. 13 XPS spectra. (A) C 1s: (a) GO, (b) RGO, (c) CdS–RGO (CdS![[thin space (1/6-em)]](https://www.rsc.org/images/entities/char_2009.gif) : :![[thin space (1/6-em)]](https://www.rsc.org/images/entities/char_2009.gif) RGO = 1 RGO = 1![[thin space (1/6-em)]](https://www.rsc.org/images/entities/char_2009.gif) : :![[thin space (1/6-em)]](https://www.rsc.org/images/entities/char_2009.gif) 0.01), (d) CdS–RGO (CdS 0.01), (d) CdS–RGO (CdS![[thin space (1/6-em)]](https://www.rsc.org/images/entities/char_2009.gif) : :![[thin space (1/6-em)]](https://www.rsc.org/images/entities/char_2009.gif) RGO = 1 RGO = 1![[thin space (1/6-em)]](https://www.rsc.org/images/entities/char_2009.gif) : :![[thin space (1/6-em)]](https://www.rsc.org/images/entities/char_2009.gif) 0.01) after reaction, (e) CNT, (f) CdS–CNT (CdS 0.01) after reaction, (e) CNT, (f) CdS–CNT (CdS![[thin space (1/6-em)]](https://www.rsc.org/images/entities/char_2009.gif) : :![[thin space (1/6-em)]](https://www.rsc.org/images/entities/char_2009.gif) CNT = 1 CNT = 1![[thin space (1/6-em)]](https://www.rsc.org/images/entities/char_2009.gif) : :![[thin space (1/6-em)]](https://www.rsc.org/images/entities/char_2009.gif) 0.05). (B) Cd 3d: (a) CdS, (b) CdS–RGO (CdS 0.05). (B) Cd 3d: (a) CdS, (b) CdS–RGO (CdS![[thin space (1/6-em)]](https://www.rsc.org/images/entities/char_2009.gif) : :![[thin space (1/6-em)]](https://www.rsc.org/images/entities/char_2009.gif) RGO = 1 RGO = 1![[thin space (1/6-em)]](https://www.rsc.org/images/entities/char_2009.gif) : :![[thin space (1/6-em)]](https://www.rsc.org/images/entities/char_2009.gif) 0.01), (c) CdS–RGO (CdS 0.01), (c) CdS–RGO (CdS![[thin space (1/6-em)]](https://www.rsc.org/images/entities/char_2009.gif) : :![[thin space (1/6-em)]](https://www.rsc.org/images/entities/char_2009.gif) RGO = 1 RGO = 1![[thin space (1/6-em)]](https://www.rsc.org/images/entities/char_2009.gif) : :![[thin space (1/6-em)]](https://www.rsc.org/images/entities/char_2009.gif) 0.01) after reaction, (d) CdS–CNT (CdS 0.01) after reaction, (d) CdS–CNT (CdS![[thin space (1/6-em)]](https://www.rsc.org/images/entities/char_2009.gif) : :![[thin space (1/6-em)]](https://www.rsc.org/images/entities/char_2009.gif) CNT = 1 CNT = 1![[thin space (1/6-em)]](https://www.rsc.org/images/entities/char_2009.gif) : :![[thin space (1/6-em)]](https://www.rsc.org/images/entities/char_2009.gif) 0.05). (C) S 2p: (a) CdS, (b) CdS–RGO (CdS 0.05). (C) S 2p: (a) CdS, (b) CdS–RGO (CdS![[thin space (1/6-em)]](https://www.rsc.org/images/entities/char_2009.gif) : :![[thin space (1/6-em)]](https://www.rsc.org/images/entities/char_2009.gif) RGO = 1 RGO = 1![[thin space (1/6-em)]](https://www.rsc.org/images/entities/char_2009.gif) : :![[thin space (1/6-em)]](https://www.rsc.org/images/entities/char_2009.gif) 0.01), (c) CdS–RGO (CdS 0.01), (c) CdS–RGO (CdS![[thin space (1/6-em)]](https://www.rsc.org/images/entities/char_2009.gif) : :![[thin space (1/6-em)]](https://www.rsc.org/images/entities/char_2009.gif) RGO = 1 RGO = 1![[thin space (1/6-em)]](https://www.rsc.org/images/entities/char_2009.gif) : :![[thin space (1/6-em)]](https://www.rsc.org/images/entities/char_2009.gif) 0.01) after reaction, (d) CdS–CNT (CdS 0.01) after reaction, (d) CdS–CNT (CdS![[thin space (1/6-em)]](https://www.rsc.org/images/entities/char_2009.gif) : :![[thin space (1/6-em)]](https://www.rsc.org/images/entities/char_2009.gif) CNT = 1 CNT = 1![[thin space (1/6-em)]](https://www.rsc.org/images/entities/char_2009.gif) : :![[thin space (1/6-em)]](https://www.rsc.org/images/entities/char_2009.gif) 0.05). 0.05). | ||
Fig. 14 shows the TEM images of the CdS–GR (CdS![[thin space (1/6-em)]](https://www.rsc.org/images/entities/char_2009.gif) :
:![[thin space (1/6-em)]](https://www.rsc.org/images/entities/char_2009.gif) GR = 1
GR = 1![[thin space (1/6-em)]](https://www.rsc.org/images/entities/char_2009.gif) :
:![[thin space (1/6-em)]](https://www.rsc.org/images/entities/char_2009.gif) 0.01) and CdS–CNT (CdS
0.01) and CdS–CNT (CdS![[thin space (1/6-em)]](https://www.rsc.org/images/entities/char_2009.gif) :
:![[thin space (1/6-em)]](https://www.rsc.org/images/entities/char_2009.gif) CNT = 1
CNT = 1![[thin space (1/6-em)]](https://www.rsc.org/images/entities/char_2009.gif) :
:![[thin space (1/6-em)]](https://www.rsc.org/images/entities/char_2009.gif) 0.05) composites together with GO, GR and CdS alone. The sheet-like structure was clearly observed for GO and GR, while CdS prepared in this work had a nanoparticle morphology. In the CdS–CNT and the CdS–GR composites, CdS nanoparticles were dispersed on the CNT surfaces or the GR sheets. The high-resolution TEM image for the CdS–GR composite (Fig. 14f) reveals that a crystallized CdS nanoparticle with a lattice spacing of 0.34 nm, corresponding to the (111) plane of cubic CdS, is directly connected with the GR sheets. The CdS particle size distributions are also shown in Fig. 14. The average CdS particle size for CdS alone was 33 nm. The average CdS particle sizes became slightly larger in the CdS–CNT (34 nm) and the CdS–GR (36 nm) composites. The phenomenon that the presence of GO or GR promoted the crystallization of CdS during the synthetic procedure was also observed in a previous study.40 This may also suggest that there exists interactions between CdS and GR in the composites.
0.05) composites together with GO, GR and CdS alone. The sheet-like structure was clearly observed for GO and GR, while CdS prepared in this work had a nanoparticle morphology. In the CdS–CNT and the CdS–GR composites, CdS nanoparticles were dispersed on the CNT surfaces or the GR sheets. The high-resolution TEM image for the CdS–GR composite (Fig. 14f) reveals that a crystallized CdS nanoparticle with a lattice spacing of 0.34 nm, corresponding to the (111) plane of cubic CdS, is directly connected with the GR sheets. The CdS particle size distributions are also shown in Fig. 14. The average CdS particle size for CdS alone was 33 nm. The average CdS particle sizes became slightly larger in the CdS–CNT (34 nm) and the CdS–GR (36 nm) composites. The phenomenon that the presence of GO or GR promoted the crystallization of CdS during the synthetic procedure was also observed in a previous study.40 This may also suggest that there exists interactions between CdS and GR in the composites.
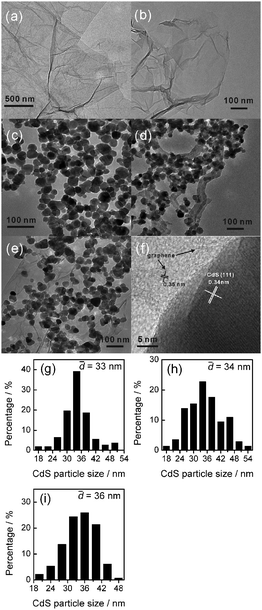 | ||
Fig. 14 TEM micrographs and CdS particle size distributions. TEM micrographs: (a) GO, (b) GR, (c) CdS, (d) CdS–CNT (CdS![[thin space (1/6-em)]](https://www.rsc.org/images/entities/char_2009.gif) : :![[thin space (1/6-em)]](https://www.rsc.org/images/entities/char_2009.gif) CNT = 1 CNT = 1![[thin space (1/6-em)]](https://www.rsc.org/images/entities/char_2009.gif) : :![[thin space (1/6-em)]](https://www.rsc.org/images/entities/char_2009.gif) 0.05), (e) CdS–GR (CdS 0.05), (e) CdS–GR (CdS![[thin space (1/6-em)]](https://www.rsc.org/images/entities/char_2009.gif) : :![[thin space (1/6-em)]](https://www.rsc.org/images/entities/char_2009.gif) GR = 1 GR = 1![[thin space (1/6-em)]](https://www.rsc.org/images/entities/char_2009.gif) : :![[thin space (1/6-em)]](https://www.rsc.org/images/entities/char_2009.gif) 0.01), (f) CdS–GR (CdS 0.01), (f) CdS–GR (CdS![[thin space (1/6-em)]](https://www.rsc.org/images/entities/char_2009.gif) : :![[thin space (1/6-em)]](https://www.rsc.org/images/entities/char_2009.gif) GR = 1 GR = 1![[thin space (1/6-em)]](https://www.rsc.org/images/entities/char_2009.gif) : :![[thin space (1/6-em)]](https://www.rsc.org/images/entities/char_2009.gif) 0.01) high resolution. CdS particle size distributions: (g) CdS, (h) CdS–CNT (CdS 0.01) high resolution. CdS particle size distributions: (g) CdS, (h) CdS–CNT (CdS![[thin space (1/6-em)]](https://www.rsc.org/images/entities/char_2009.gif) : :![[thin space (1/6-em)]](https://www.rsc.org/images/entities/char_2009.gif) CNT = 1 CNT = 1![[thin space (1/6-em)]](https://www.rsc.org/images/entities/char_2009.gif) : :![[thin space (1/6-em)]](https://www.rsc.org/images/entities/char_2009.gif) 0.05), (i) CdS–GR (CdS 0.05), (i) CdS–GR (CdS![[thin space (1/6-em)]](https://www.rsc.org/images/entities/char_2009.gif) : :![[thin space (1/6-em)]](https://www.rsc.org/images/entities/char_2009.gif) GR = 1 GR = 1![[thin space (1/6-em)]](https://www.rsc.org/images/entities/char_2009.gif) : :![[thin space (1/6-em)]](https://www.rsc.org/images/entities/char_2009.gif) 0.01). 0.01). | ||
The CdS–GR and the CdS–CNT composites have further been characterized by diffuse reflectance UV-vis spectroscopy. The results for the two series of composites are shown in Fig. 15 and 16. The background in the visible light region (≥ 550 nm) was increased in the composites containing GR or CNT. This corresponded to the change in the sample color from orange to olive due to the combination of black GR or CNT with CdS. From the plots of the modified Kubelka-Munk function, i.e., [F(R∞)hυ]1/2, versus the energy of exciting light (hυ), the band-gap energy for a semiconductor can be evaluated.53 The plots of [F(R∞)hυ]1/2 against hυ for the CdS–GR and the CdS–CNT composites with different compositions are shown in Fig. 15B and 16B. The plot for CdS alone afforded a band-gap energy of 2.27 eV. The increase in the mass ratio of GR![[thin space (1/6-em)]](https://www.rsc.org/images/entities/char_2009.gif) :
:![[thin space (1/6-em)]](https://www.rsc.org/images/entities/char_2009.gif) CdS in the CdS–GR composites decreased the band-gap energy; the band-gap energies for the CdS–GR composites with GR
CdS in the CdS–GR composites decreased the band-gap energy; the band-gap energies for the CdS–GR composites with GR![[thin space (1/6-em)]](https://www.rsc.org/images/entities/char_2009.gif) :
:![[thin space (1/6-em)]](https://www.rsc.org/images/entities/char_2009.gif) CdS mass ratios of 0.005, 0.01, 0.03 and 0.05 declined to 2.22, 2.21, 2.18 and 2.15 eV, respectively. This band-gap narrowing was also observed for TiO2 in the TiO2–GR composites, which was suggested to correspond to the formation of a Ti–O–C bond between TiO2 and GR.36,38,39 We propose that the band-gap narrowing observed for the CdS–GR composite indicates the strong interactions between CdS and GR.
CdS mass ratios of 0.005, 0.01, 0.03 and 0.05 declined to 2.22, 2.21, 2.18 and 2.15 eV, respectively. This band-gap narrowing was also observed for TiO2 in the TiO2–GR composites, which was suggested to correspond to the formation of a Ti–O–C bond between TiO2 and GR.36,38,39 We propose that the band-gap narrowing observed for the CdS–GR composite indicates the strong interactions between CdS and GR.
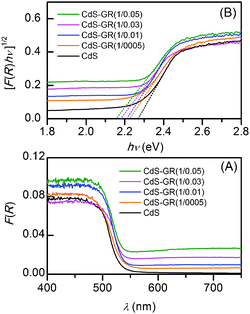 | ||
Fig. 15 (A) Diffuse reflectance UV–vis spectra for CdS and CdS–GR composites with different mass ratios of CdS![[thin space (1/6-em)]](https://www.rsc.org/images/entities/char_2009.gif) : :![[thin space (1/6-em)]](https://www.rsc.org/images/entities/char_2009.gif) GR. (B) Corresponding plot of transformed Kubelka-Munk function versus the energy of the light. GR. (B) Corresponding plot of transformed Kubelka-Munk function versus the energy of the light. | ||
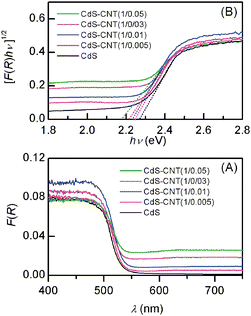 | ||
Fig. 16 (A) Diffuse reflectance UV–vis spectra for CdS and CdS–CNT composites with different mass ratios of CdS![[thin space (1/6-em)]](https://www.rsc.org/images/entities/char_2009.gif) : :![[thin space (1/6-em)]](https://www.rsc.org/images/entities/char_2009.gif) CNT. (B) Corresponding plot of transformed Kubelka-Munk function versus the energy of the light. CNT. (B) Corresponding plot of transformed Kubelka-Munk function versus the energy of the light. | ||
Similarly, the increase in the mass ratio of CNT![[thin space (1/6-em)]](https://www.rsc.org/images/entities/char_2009.gif) :
:![[thin space (1/6-em)]](https://www.rsc.org/images/entities/char_2009.gif) CdS in the CdS–CNT composites also decreased the band-gap energy as shown in Fig. 16B; the band-gap energies for the CdS–CNT composites with CNT
CdS in the CdS–CNT composites also decreased the band-gap energy as shown in Fig. 16B; the band-gap energies for the CdS–CNT composites with CNT![[thin space (1/6-em)]](https://www.rsc.org/images/entities/char_2009.gif) :
:![[thin space (1/6-em)]](https://www.rsc.org/images/entities/char_2009.gif) CdS mass ratios of 0.005, 0.01, 0.03 and 0.05 were 2.25, 2.23, 2.21 and 2.18 eV, respectively. The comparison between the two series of composites demonstrates that, for the sample with the same mass ratio of carbon
CdS mass ratios of 0.005, 0.01, 0.03 and 0.05 were 2.25, 2.23, 2.21 and 2.18 eV, respectively. The comparison between the two series of composites demonstrates that, for the sample with the same mass ratio of carbon![[thin space (1/6-em)]](https://www.rsc.org/images/entities/char_2009.gif) :
:![[thin space (1/6-em)]](https://www.rsc.org/images/entities/char_2009.gif) CdS, the band-gap narrowing is relatively larger for the CdS–GR composite. Our previous studies indicated that the degree of the band-gap narrowing may reflect the degree of the interactions or the contact interfaces between TiO2 and carbon materials.39 Thus, a larger band-gap narrowing observed for the CdS–GR composite may suggest a stronger interaction or a larger contact interface between CdS and RGO than that between CdS and CNT.
CdS, the band-gap narrowing is relatively larger for the CdS–GR composite. Our previous studies indicated that the degree of the band-gap narrowing may reflect the degree of the interactions or the contact interfaces between TiO2 and carbon materials.39 Thus, a larger band-gap narrowing observed for the CdS–GR composite may suggest a stronger interaction or a larger contact interface between CdS and RGO than that between CdS and CNT.
The transient photocurrent response has been demonstrated to be a useful technique for investigating the efficiency of the separation of photogenerated electron-hole pairs.26,54–56Fig. 17 shows the curves of transient photocurrent density versus time with several on-off cycles of intermittent visible-light irradiation for CdS, the CdS–GR (CdS![[thin space (1/6-em)]](https://www.rsc.org/images/entities/char_2009.gif) :
:![[thin space (1/6-em)]](https://www.rsc.org/images/entities/char_2009.gif) GR = 1
GR = 1![[thin space (1/6-em)]](https://www.rsc.org/images/entities/char_2009.gif) :
:![[thin space (1/6-em)]](https://www.rsc.org/images/entities/char_2009.gif) 0.01) and CdS–CNT (CdS
0.01) and CdS–CNT (CdS![[thin space (1/6-em)]](https://www.rsc.org/images/entities/char_2009.gif) :
:![[thin space (1/6-em)]](https://www.rsc.org/images/entities/char_2009.gif) CNT = 1
CNT = 1![[thin space (1/6-em)]](https://www.rsc.org/images/entities/char_2009.gif) :
:![[thin space (1/6-em)]](https://www.rsc.org/images/entities/char_2009.gif) 0.05) composites. As expected, in each case, the photocurrent density decreased rapidly to zero as soon as the light irradiation was turned off, and it increased again to almost the same value as the light was turned on. Fig. 17 revealed that the CdS–GR composite exhibited a higher photocurrent than the CdS–CNT composite, and the photocurrents for both composites were significantly higher than that for CdS alone. These results demonstrate that the efficiency of the separation of photogenerated electron-hole pairs increases in the order of CdS < CdS–CNT < CdS–GR.
0.05) composites. As expected, in each case, the photocurrent density decreased rapidly to zero as soon as the light irradiation was turned off, and it increased again to almost the same value as the light was turned on. Fig. 17 revealed that the CdS–GR composite exhibited a higher photocurrent than the CdS–CNT composite, and the photocurrents for both composites were significantly higher than that for CdS alone. These results demonstrate that the efficiency of the separation of photogenerated electron-hole pairs increases in the order of CdS < CdS–CNT < CdS–GR.
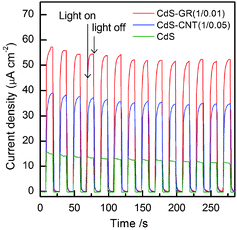 | ||
Fig. 17 Transient photocurrent responses for CdS, CdS–GR (1![[thin space (1/6-em)]](https://www.rsc.org/images/entities/char_2009.gif) : :![[thin space (1/6-em)]](https://www.rsc.org/images/entities/char_2009.gif) 0.01) and CdS–CNT (1 0.01) and CdS–CNT (1![[thin space (1/6-em)]](https://www.rsc.org/images/entities/char_2009.gif) : :![[thin space (1/6-em)]](https://www.rsc.org/images/entities/char_2009.gif) 0.05). 0.05). | ||
3.5. Structure–performance correlation
We have demonstrated that the incorporation of both GR and CNT into CdS to form nanocomposites can enhance the photocatalytic performances of CdS for the evolution of H2 and the degradation of MO. There exists optimum mass ratios of GR![[thin space (1/6-em)]](https://www.rsc.org/images/entities/char_2009.gif) :
:![[thin space (1/6-em)]](https://www.rsc.org/images/entities/char_2009.gif) CdS and CNT
CdS and CNT![[thin space (1/6-em)]](https://www.rsc.org/images/entities/char_2009.gif) :
:![[thin space (1/6-em)]](https://www.rsc.org/images/entities/char_2009.gif) CdS for both types of photocatalytic reactions. For the CdS–GR composites, the maximum photocatalytic performances have been achieved at a relatively lower mass ratio of GR
CdS for both types of photocatalytic reactions. For the CdS–GR composites, the maximum photocatalytic performances have been achieved at a relatively lower mass ratio of GR![[thin space (1/6-em)]](https://www.rsc.org/images/entities/char_2009.gif) :
:![[thin space (1/6-em)]](https://www.rsc.org/images/entities/char_2009.gif) CdS (0.01
CdS (0.01![[thin space (1/6-em)]](https://www.rsc.org/images/entities/char_2009.gif) :
:![[thin space (1/6-em)]](https://www.rsc.org/images/entities/char_2009.gif) 1), whereas the optimum CNT
1), whereas the optimum CNT![[thin space (1/6-em)]](https://www.rsc.org/images/entities/char_2009.gif) :
:![[thin space (1/6-em)]](https://www.rsc.org/images/entities/char_2009.gif) CdS mass ratios are 0.05
CdS mass ratios are 0.05![[thin space (1/6-em)]](https://www.rsc.org/images/entities/char_2009.gif) :
:![[thin space (1/6-em)]](https://www.rsc.org/images/entities/char_2009.gif) 1 and 0.03
1 and 0.03![[thin space (1/6-em)]](https://www.rsc.org/images/entities/char_2009.gif) :
:![[thin space (1/6-em)]](https://www.rsc.org/images/entities/char_2009.gif) 1 for the H2 evolution and the MO degradation, respectively. The catalytic performances of the optimized CdS–GR composite have been found to be better than those of the optimized CdS–CNT composite for both reactions. The characterizations for the two series of nanocomposites suggest that CdS nanoparticles with mean sizes of ∼35 nm are dispersed on the GR sheets or on the CNT outer surfaces. As suggested by the larger band-gap narrowing for the CdS–GR composite (Fig. 15), there exists stronger interactions or larger contact interfaces between CdS and GR than those between CdS and CNT.
1 for the H2 evolution and the MO degradation, respectively. The catalytic performances of the optimized CdS–GR composite have been found to be better than those of the optimized CdS–CNT composite for both reactions. The characterizations for the two series of nanocomposites suggest that CdS nanoparticles with mean sizes of ∼35 nm are dispersed on the GR sheets or on the CNT outer surfaces. As suggested by the larger band-gap narrowing for the CdS–GR composite (Fig. 15), there exists stronger interactions or larger contact interfaces between CdS and GR than those between CdS and CNT.
It is expected that the stronger interactions or the larger contact interfaces between CdS and GR may result in a more efficient electron transfer from the CdS nanoparticles to GR sheets under visible-light irradiation and a more efficient separation of photogenerated electrons and holes. The increase in the efficiency of the separation of photogenerated electron-hole pairs has been confirmed by the transient photocurrent response studies (Fig. 17). We have also demonstrated that the physical mixture of CdS and GR did not show any enhancing effect of GR (Fig. 3). Thus, we propose that the stronger interactions or the larger contact interfaces is the main reason for the higher photocatalytic activities of the CdS–GR composite for both the H2 evolution and the organic dye degradation. The unique two dimensional sheet-like structure, the larger surface area, and the higher concentration of oxygen-containing functional groups of GO may favor the direct contact between CdS and the GR sheet during the preparation stage.
It is noteworthy that the degree of band-gap narrowing or the contact interfaces between CdS and CNT could be increased by increasing the mass ratio of CNT![[thin space (1/6-em)]](https://www.rsc.org/images/entities/char_2009.gif) :
:![[thin space (1/6-em)]](https://www.rsc.org/images/entities/char_2009.gif) CdS in the CdS–CNT nanocomposites. We speculate that this is why a higher fraction of carbon materials is required for obtaining the maximum photocatalytic performances over the CdS–CNT composites. Here, the next question may arise. Why are the maximum photocatalytic performances of the CdS–CNT lower than those of the CdS–GR if similar contact interfaces can be obtained? It is expected that there are two main contradictory roles of carbon materials in influencing the photocatalytic property of a semiconductor catalyst. The positive role is to accelerate the electron-hole separation as described above. On the other hand, the black carbon materials in the nanocomposites may exert a negative “shielding effect”.26,40 In other words, CNT or GR in the composites may shield the light absorption of the semiconductor photocatalyst. This negative role has been observed in several studies for the TiO2–CNT and TiO2–GR composites, particularly at higher fractions of carbon materials.26,36–40 We believe that this is the main reason for the decrease in the photocatalytic performances at higher GR
CdS in the CdS–CNT nanocomposites. We speculate that this is why a higher fraction of carbon materials is required for obtaining the maximum photocatalytic performances over the CdS–CNT composites. Here, the next question may arise. Why are the maximum photocatalytic performances of the CdS–CNT lower than those of the CdS–GR if similar contact interfaces can be obtained? It is expected that there are two main contradictory roles of carbon materials in influencing the photocatalytic property of a semiconductor catalyst. The positive role is to accelerate the electron-hole separation as described above. On the other hand, the black carbon materials in the nanocomposites may exert a negative “shielding effect”.26,40 In other words, CNT or GR in the composites may shield the light absorption of the semiconductor photocatalyst. This negative role has been observed in several studies for the TiO2–CNT and TiO2–GR composites, particularly at higher fractions of carbon materials.26,36–40 We believe that this is the main reason for the decrease in the photocatalytic performances at higher GR![[thin space (1/6-em)]](https://www.rsc.org/images/entities/char_2009.gif) :
:![[thin space (1/6-em)]](https://www.rsc.org/images/entities/char_2009.gif) CdS or CNT
CdS or CNT![[thin space (1/6-em)]](https://www.rsc.org/images/entities/char_2009.gif) :
:![[thin space (1/6-em)]](https://www.rsc.org/images/entities/char_2009.gif) CdS mass ratios. Therefore, the better photocatalytic performance of the optimized CdS–GR as compared to the optimized CdS–CNT can be interpreted by the fact that the CdS–GR composites can provide stronger interactions or larger contact interfaces between CdS and carbon materials at a lower ratio of carbon:CdS.
CdS mass ratios. Therefore, the better photocatalytic performance of the optimized CdS–GR as compared to the optimized CdS–CNT can be interpreted by the fact that the CdS–GR composites can provide stronger interactions or larger contact interfaces between CdS and carbon materials at a lower ratio of carbon:CdS.
4. Conclusions
We succeeded in preparing the nanocomposites of CdS–GR and CdS–CNT by an environmentally benign hydrothermal method. Hydrophilic GO was used as the precursor with an aim to obtaining a composite with strong interactions between CdS and GR. The characterizations using different techniques uncovered that GO was reduced to GR sheets in the nanocomposites. Characterization results also suggested that CdS nanoparticles with a mean diameter of ∼35 nm were dispersed on the GR sheets or on the CNT outer surfaces in the nanocomposites. As compared to CdS alone, the incorporation of GR or CNT led to band-gap narrowing, indicating the strong interactions between CdS and GR or CdS and CNT in the composites. There exists stronger interactions or larger contact interfaces between CdS and GR than those between CdS and CNT in the composite with the same mass ratio of carbon![[thin space (1/6-em)]](https://www.rsc.org/images/entities/char_2009.gif) :
:![[thin space (1/6-em)]](https://www.rsc.org/images/entities/char_2009.gif) CdS. We studied the photocatalytic properties of the CdS–GR and the CdS–CNT nanocomposites for the evolution of H2 from the aqueous solution containing Na2S and Na2SO3 and the degradation of MO under visible-light irradiation. The CdS–GR and the CdS–CNT composites both exhibited significantly better performances for the two photocatalytic reactions than CdS alone. The photocatalytic performances of the two series of composites depended on the mass ratios of CdS
CdS. We studied the photocatalytic properties of the CdS–GR and the CdS–CNT nanocomposites for the evolution of H2 from the aqueous solution containing Na2S and Na2SO3 and the degradation of MO under visible-light irradiation. The CdS–GR and the CdS–CNT composites both exhibited significantly better performances for the two photocatalytic reactions than CdS alone. The photocatalytic performances of the two series of composites depended on the mass ratios of CdS![[thin space (1/6-em)]](https://www.rsc.org/images/entities/char_2009.gif) :
:![[thin space (1/6-em)]](https://www.rsc.org/images/entities/char_2009.gif) GR or CdS
GR or CdS![[thin space (1/6-em)]](https://www.rsc.org/images/entities/char_2009.gif) :
:![[thin space (1/6-em)]](https://www.rsc.org/images/entities/char_2009.gif) CNT. The rate of H2 evolution for the CdS–GR nanocomposite with an optimum mass ratio of CdS
CNT. The rate of H2 evolution for the CdS–GR nanocomposite with an optimum mass ratio of CdS![[thin space (1/6-em)]](https://www.rsc.org/images/entities/char_2009.gif) :
:![[thin space (1/6-em)]](https://www.rsc.org/images/entities/char_2009.gif) GR (1
GR (1![[thin space (1/6-em)]](https://www.rsc.org/images/entities/char_2009.gif) :
:![[thin space (1/6-em)]](https://www.rsc.org/images/entities/char_2009.gif) 0.01) was 4.8 times higher than that over CdS alone, whereas the physical mixture of CdS and GR showed a similar photocatalytic activity with CdS. The rate of H2 evolution for this CdS–GR composite was higher than that of the CdS–CNT composite with an optimum mass ratio of CdS
0.01) was 4.8 times higher than that over CdS alone, whereas the physical mixture of CdS and GR showed a similar photocatalytic activity with CdS. The rate of H2 evolution for this CdS–GR composite was higher than that of the CdS–CNT composite with an optimum mass ratio of CdS![[thin space (1/6-em)]](https://www.rsc.org/images/entities/char_2009.gif) :
:![[thin space (1/6-em)]](https://www.rsc.org/images/entities/char_2009.gif) CNT (1
CNT (1![[thin space (1/6-em)]](https://www.rsc.org/images/entities/char_2009.gif) :
:![[thin space (1/6-em)]](https://www.rsc.org/images/entities/char_2009.gif) 0.05). The CdS–GR composite was stable and could be used repeatedly for H2 evolution. The rate of photodegradation of MO was also the highest for the CdS–GR composite with a mass ratio of CdS
0.05). The CdS–GR composite was stable and could be used repeatedly for H2 evolution. The rate of photodegradation of MO was also the highest for the CdS–GR composite with a mass ratio of CdS![[thin space (1/6-em)]](https://www.rsc.org/images/entities/char_2009.gif) :
:![[thin space (1/6-em)]](https://www.rsc.org/images/entities/char_2009.gif) GR of 1
GR of 1![[thin space (1/6-em)]](https://www.rsc.org/images/entities/char_2009.gif) :
:![[thin space (1/6-em)]](https://www.rsc.org/images/entities/char_2009.gif) 0.01. The apparent rate constant of the pseudo first-order degradation of MO for this catalyst was 7.9 times higher than that of CdS alone, and 1.8 times higher than that of the CdS–CNT composite with an optimum mass ratio of CdS
0.01. The apparent rate constant of the pseudo first-order degradation of MO for this catalyst was 7.9 times higher than that of CdS alone, and 1.8 times higher than that of the CdS–CNT composite with an optimum mass ratio of CdS![[thin space (1/6-em)]](https://www.rsc.org/images/entities/char_2009.gif) :
:![[thin space (1/6-em)]](https://www.rsc.org/images/entities/char_2009.gif) CNT (1
CNT (1![[thin space (1/6-em)]](https://www.rsc.org/images/entities/char_2009.gif) :
:![[thin space (1/6-em)]](https://www.rsc.org/images/entities/char_2009.gif) 0.03). The stronger interactions or the larger contact interfaces favor the transfer of photogenerated electrons from CdS to GR, leading to a higher efficiency in the separation of photogenerated electron-hole pairs and a higher photocatalytic performance of the CdS–GR composite.
0.03). The stronger interactions or the larger contact interfaces favor the transfer of photogenerated electrons from CdS to GR, leading to a higher efficiency in the separation of photogenerated electron-hole pairs and a higher photocatalytic performance of the CdS–GR composite.
Acknowledgements
This work was supported by the National Basic Research Program of China (No. 2010CB732303), the NSF of China (Nos. 21173172, 21173174 and 21161130522), the Program for Changjiang Scholars and Innovative Research Team in University (No. IRT1036) and the Research Fund for the Doctoral Program of Higher Education (No. 20090121110007).Notes and references
- M. R. Hoffmann, S. T. Martin, W. Choi and D. W. Bahnemann, Chem. Rev., 1995, 95, 69 CrossRef CAS.
- A. L. Linsebiger, G. Lu and J. T. Yates Jr., Chem. Rev., 1995, 95, 735 CrossRef.
- K. Maeda and K. Domen, J. Phys. Chem. C, 2007, 111, 76 Search PubMed.
- F. E. Osterloh, Chem. Mater., 2008, 20, 35 CrossRef CAS.
- K. Rajeshwar, M. E. Osugi, W. Chanmanee, C. R. Chenthamarakshan, M. V. B. Zanoni, P. Kajitvichyanukul and R. Krishnan-Ayer, J. Photochem. Photobiol., C, 2008, 9, 171 CrossRef CAS.
- A. Kudo and Y. Miseki, Chem. Soc. Rev., 2009, 38, 253 RSC.
- R. M. N. Yerga, M. C. Á. Galván, F. Del Valle, J. A. V. De la Mano and J. L. G. Fierro, ChemSusChem, 2009, 2, 471 CrossRef.
- Y. Inoue, Energy Environ. Sci., 2009, 2, 364 CAS.
- M. D. Hernández-Alonso, F. Fresno, S. Suárez and J. M. Coronado, Energy Environ. Sci., 2009, 2, 1231 Search PubMed.
- D. Leung, X. Fu, C. Wang, M. Ni, M. Leung, X. Wang and X. Fu, ChemSusChem, 2010, 3, 681 CrossRef CAS.
- R. Abe, J. Photochem. Photobiol., C, 2010, 11, 179 CrossRef CAS.
- X. Chen, S. Shen, J. Guo and S. S. Mao, Chem. Rev., 2010, 110, 6503 CrossRef CAS.
- Q. Xiang, J. Yu and M. Jaroniec, Chem. Soc. Rev., 2012, 41, 782 RSC.
- Y. J. Li and W. Chen, Catal. Sci. Technol., 2011, 1, 802 Search PubMed.
- M. Ashokkumar, Int. J. Hydrogen Energy, 1998, 23, 427 CrossRef CAS.
- P. V. Kamat, J. Phys. Chem. C, 2007, 111, 2834 CAS.
- H. Park, W. Choi and M. R. Hoffmann, J. Mater. Chem., 2008, 18, 2379 RSC.
- X. W. Wang, G. Liu, Z. G. Chen, F. Li, L. Wang, G. Q. Lu and H. M. Cheng, Chem. Commun., 2009, 3452 RSC.
- X. Zong, H. Yan, G. Wu, G. Ma, F. Wen, L. Wang and C. Li, J. Am. Chem. Soc., 2008, 130, 7176 CrossRef CAS.
- H. Yan, J. Yang, G. Ma, G. Wu, X. Zong, Z. Lei, J. Shi and C. Li, J. Catal., 2009, 266, 165 CrossRef CAS.
- Y. B. Wang, J. C. Wu, J. W. Zheng and R. Xu, Catal. Sci. Technol., 2011, 1, 940 CAS.
- H. N. Kim, T. W. Kim, I. Y. Kim and S. J. Hwang, Adv. Funct. Mater., 2011, 21, 3111 CrossRef CAS.
- K. Woan, G. Pyrgiotakis and W. Sigmund, Adv. Mater., 2009, 21, 2233 CrossRef CAS.
- C. G. Silva and J. L. Faria, ChemSusChem, 2010, 3, 609 CrossRef CAS.
- R. Leary and A. Westwood, Carbon, 2011, 49, 741 CrossRef CAS.
- J. Yu, T. Ma and S. Liu, Phys. Chem. Chem. Phys., 2011, 13, 3491 RSC.
- I. Robel, B. A. Bunker and P. V. Kamat, Adv. Mater., 2005, 17, 2458 CrossRef CAS.
- Y. K. Kim and H. Park, Energy Environ. Sci., 2011, 4, 685 CAS.
- T. Peng, P. Zeng, D. Ke, X. Liu and X. Zhang, Energy Fuels, 2011, 25, 2203 CrossRef CAS.
- A. K. Geim and K. S. Novoselov, Nat. Mater., 2007, 6, 183 CrossRef CAS.
- A. K. Geim, Science, 2009, 324, 1530 CrossRef CAS.
- V. N. R. Rao, A. K. Sood, K. S. Subrahmanyam and A. Govindaraj, Angew. Chem., Int. Ed., 2009, 48, 7752 CrossRef.
- M. J. Allem, V. C. Tung and R. B. Kaner, Chem. Rev., 2010, 110, 132 CrossRef.
- K. S. Novoselov, Angew. Chem., Int. Ed., 2011, 50, 6986 CrossRef CAS.
- X. J. Liu, L. K. Pan, T. Lv, T. Lu, G. Zhu, Z. Sun and C. Q. Sun, Catal. Sci. Technol., 2011, 1, 1189 CAS.
- H. Zhang, X. Lv, Y. Li, Y. Wang and J. Li, ACS Nano, 2010, 4, 380 CrossRef CAS.
- X. Y. Zhang, H. P. Li, X. L. Cui and Y. Lin, J. Mater. Chem., 2010, 20, 2801 RSC.
- Y. Zhang, Z. R. Tang, X. Fu and Y. J. Xu, ACS Nano, 2010, 4, 7303 CrossRef CAS.
- W. Fan, Q. Lai, Q. Zhang and Y. Wang, J. Phys. Chem. C, 2011, 115, 10694 CAS.
- Q. Li, B. Guo, J. Yu, J. Ran, B. Zhang, H. Yan and J. R. Gong, J. Am. Chem. Soc., 2011, 133, 10878 CrossRef CAS.
- L. Jia, D. H. Wang, Y. X. Huang, A. W. Xu and H. Q. Yu, J. Phys. Chem. C, 2011, 115, 11466 CAS.
- A. Cao, Z. Liu, S. Chu, M. Wu, Z. Ye, Z. Cai, Y. Chang, S. Wang, Q. Gong and Y. Liu, Adv. Mater., 2010, 22, 103 CrossRef CAS.
- Y. Zhang, Z. R. Tang, X. Fu and Y. J. Xu, ACS Nano, 2011, 5, 7426 CrossRef CAS.
- W. S. Hummers and R. J. Offeman, J. Am. Chem. Soc., 1958, 80, 1339 CrossRef CAS.
- P. Chen, H. B. Zhang, G. D. Lin, Q. Hong and K. R. Tsai, Carbon, 1997, 35, 1495 CrossRef CAS.
- J. Kang, S. Zhang, Q. Zhang and Y. Wang, Angew. Chem., Int. Ed., 2009, 48, 2565 CrossRef CAS.
- T. Hirakawa and Y. Nosaka, Langmuir, 2002, 18, 3247 CrossRef CAS.
- Y. Fu and X. Wang, Ind. Eng. Chem. Res., 2011, 50, 7210 CrossRef CAS.
- H. Zhang and Y. Zhu, J. Phys. Chem. C, 2010, 114, 5822 CAS.
- Y. Liang, H. Wang, H. S. Casalongue, Z. Chen and H. J. Dai, Nano Res., 2010, 3, 701 CrossRef CAS.
- X. Zhang, X. Quan, S. Chen and H. Yu, Appl. Catal., B, 2011, 105, 237 CrossRef CAS.
- C. Nethravath and M. Rajamathi, Carbon, 2008, 46, 1994 CrossRef.
- S. Sakthivel and H. Kisch, Angew. Chem., Int. Ed., 2003, 42, 4908 CrossRef CAS.
- N. J. Bell, Y. H. Ng, A. Du, H. Coster, S. C. Smith and R. Amal, J. Phys. Chem. C, 2011, 115, 6004 CAS.
- Q. Xiang, J. Yu and M. Jaroniec, Nanoscale, 2011, 3, 3670 RSC.
- Q. Xiang, J. Yu and M. Jaroniec, J. Phys. Chem. C, 2011, 115, 7355 CAS.
| This journal is © The Royal Society of Chemistry 2012 |
