Interfacial interaction driven CO oxidation: nanostructured Ce1−xLaxO2−δ/TiO2 solid solutions†
Lakshmi
Katta
a,
Benjaram M.
Reddy
*a,
Martin
Muhler
b and
Wolfgang
Grünert
b
aInorganic and Physical Chemistry Division, Indian Institute of Chemical Technology, Uppal Road, Hyderabad-500607, India. E-mail: bmreddy@iict.res.in; mreddyb@yahoo.com; Fax: +91 40 2716 0921; Tel: +91 40 27191714
bLaboratory of Industrial Chemistry, Ruhr-University Bochum, D-44780, Bochum, Germany. E-mail: w.gruenert@techem.rub.de
First published on 9th December 2011
Abstract
Titania supported ceria–lanthana solid solutions (CexLa1−xO2−δ/TiO2; CLT) have been synthesized by a facile and economical route. Existence of synergism between ceria–lanthana (CL) solid solutions and titania-anatase phase, which leads to decrease in the crystallite size, retarded titania phase transformation, and improved redox properties, has been thoroughly investigated by various techniques, namely, X-ray diffraction (XRD), X-ray photoelectron spectroscopy (XPS), transmission electron microscopy (TEM), UV-visible diffuse reflectance spectroscopy (UV–vis DRS), Raman spectroscopy (UV–RS and Vis–RS), BET surface area analysis, and temperature programmed reduction (TPR). Two key observations made from the whole exercise were (i) mutual interaction of Ce and Ti ions could impose typical Ce–O–Ti modes at the interfacial region and (ii) the La3+ ion as a dopant provokes a large number of oxygen vacancies via a charge compensation mechanism. The promising role of these factors in the CO oxidation (one of the most formidable challenges) has been comprehensively described. The observed enhanced activity for the CLT sample is primarily attributed to an apparent specific orientation of the active component over the support, which is endorsed by the interfacial interaction. This specific mode could facilitate the CO adsorption with simultaneous bulk oxygen diffusion for more consumption and in turn better activity.
1. Introduction
Compared to bulk materials, quite different properties are expected for nanomaterials, primarily due to (quantum) size effects, increased surface-to-volume ratio, and exposed low-coordinated surface sites.1 Hence, nanomaterials have attracted a great deal of attention with everlasting interest over the past decades owing to the impending vital environmental crisis and the current global dependence. Particularly, the design/synthesis of nanomaterials for the mitigation of pollutant emissions namely, CO, hydrocarbons, and nitrogen oxides from the auto exhaust has presented an immense interest.2 Amongst them, CeO2−δ, a rare-earth oxide, is of constantly growing importance due to its chemical versatility in adjusting its valence states (3+ and 4+) accompanied by the formation of oxygen vacancies, which are crucial for the potential application of ceria in different fields.3 However, at elevated temperatures, a mere consequence i.e., particles tend to aggregate with consequent degradation in oxygen storage/release capacity (OSC) makes ceria inefficient.4 A vast number of approaches have been pursued to minimize these concerns. The quest for a viable approach to achieve improved thermal stability and oxygen storage properties for various functional applications has been the driving force behind the partial substitution of ceria. Accordingly, these studies have prompted a thorough investigation of various metal ions doped ceria with a common target of obtaining stable single-phase solid solutions preserving cubic symmetry (cube within a cube).5–7 As a matter of fact, the dopant ion is trapped into the ceria lattice and the interaction between the two metal ions leads to forcible non-equivalent metal–oxygen distances and as a result, decrease in the vacancy formation energy.8 Thus, the dopant ion induces a vacancy gradient extending from the surface to bulk that in turn facilitates outward diffusion of bulk oxygen to the surface thereby progress in the catalytic performance.Unfortunately, inadequate thermal stability and oxygen storage, and fall of specific surface area at high temperatures are some of the major problems encountered even in the case of modified ceria, as many applications need high temperature treatments. Therefore, to overcome these drawbacks, the present study was undertaken to incorporate an appropriate support material and to investigate the structural and redox characteristics of the resulting supported solid solutions. Since the past few years, titania (TiO2) has been extensively used as a catalyst/support material.9,10 Anatase (tetragonal, I41/amd), rutile (tetragonal, P42/mnm), and brookite (orthorhombic, Pcab) are the three different polymorphs of crystalline TiO2 which exhibit distinct physical and chemical properties.11 Among these, anatase was proven to be the most promising candidate as a support for several reasons, including its low cost, chemical stability, non-toxicity, and environmentally friendly nature. On the other hand, the rutile phase is used as pigment and for optical and electronic purposes because of its high refractive index and high dielectric constant. Many studies dealt with different titania (anatase) supported ceria-based oxides for a variety of applications, but, the features at the interfacial regions of the support and active component and their consequences have seldom been elucidated so far.10,12 These challenges were successfully addressed here by developing novel thermally stable nanosized titania supported ceria–lanthana (CLT) solid solutions.
For the synthesis of CLT, we have devised a simple and convenient strategy based on aqueous deposition coprecipitation in which particles with a diameter of approximately 6–8 nm are obtained. The synthesized materials have been subjected to various characterization techniques, namely, XRD, XPS, UV–vis DRS, TEM, Raman spectroscopy, BET surface area analysis, and TPR. The structural and reduction behaviours of the resulting supported solid solutions have been systematically studied with the objective to better understand the influence of the support i.e., to identify whether titania remains as a spectator or it would direct specific catalytic behaviour. If the former is true, then the specific interactions that are observed from various characterization studies would have no effect on the catalytic behaviour. To accomplish this, the CO oxidation reaction has been carried out for CLT samples and compared with the unsupported ceria–lanthana (CL) sample. Interestingly, the CLT sample calcined at 773 K showed better activity for the oxidation of CO.
2. Experimental section
2.1 Material synthesis
The CexLa1−xO2−δ/TiO2 (CLT; TiO2![[thin space (1/6-em)]](https://www.rsc.org/images/entities/char_2009.gif) :
:![[thin space (1/6-em)]](https://www.rsc.org/images/entities/char_2009.gif) CeO2
CeO2![[thin space (1/6-em)]](https://www.rsc.org/images/entities/char_2009.gif) :
:![[thin space (1/6-em)]](https://www.rsc.org/images/entities/char_2009.gif) La2O3 = 100
La2O3 = 100![[thin space (1/6-em)]](https://www.rsc.org/images/entities/char_2009.gif) :
:![[thin space (1/6-em)]](https://www.rsc.org/images/entities/char_2009.gif) 80
80![[thin space (1/6-em)]](https://www.rsc.org/images/entities/char_2009.gif) :
:![[thin space (1/6-em)]](https://www.rsc.org/images/entities/char_2009.gif) 20 mol% based on oxides) sample was prepared by a deposition coprecipitation method using aqueous NH3 solution. The precursors used in the preparation were Ce(NO3)3·6H2O (Aldrich AR grade), La(NO3)3·6H2O (Aldrich AR grade), and TiO2-anatase powder (EU consortium, SA 49 m2 g−1). At first, the desired quantity of finely powdered titania was dispersed into 1000 mL deionized water and stirred for 1 h. Cerium nitrate and lanthanum nitrate were dissolved separately into deionized water and mixed together. Then under stirring conditions, the two solutions were thoroughly mixed and the whole mixture solution was diluted to 4000 mL with deionized water. Under vigorous stirring, diluted aqueous NH3 solution was added dropwise to the mixture solution until pH reached ∼8.5. The resulting precipitate was washed several times to free from anion impurities followed by filtration. The obtained cake was oven dried for 12 h and finally calcined to various temperatures from 773 to 1073 K for 5 h at 5 K min−1 to give oxide products. The unsupported CexLa1−xO2−δ sample was also prepared by the same method. The required amounts of cerium(III) nitrate and lanthanum(III) nitrate were dissolved separately and then mixed together. Under vigorous stirring, aqueous NH3 solution was added dropwise to the mixture solution until pH ∼8.5. After completion of precipitation, the obtained slurry was annealed at various temperatures, characterized and employed for catalytic evaluation.
20 mol% based on oxides) sample was prepared by a deposition coprecipitation method using aqueous NH3 solution. The precursors used in the preparation were Ce(NO3)3·6H2O (Aldrich AR grade), La(NO3)3·6H2O (Aldrich AR grade), and TiO2-anatase powder (EU consortium, SA 49 m2 g−1). At first, the desired quantity of finely powdered titania was dispersed into 1000 mL deionized water and stirred for 1 h. Cerium nitrate and lanthanum nitrate were dissolved separately into deionized water and mixed together. Then under stirring conditions, the two solutions were thoroughly mixed and the whole mixture solution was diluted to 4000 mL with deionized water. Under vigorous stirring, diluted aqueous NH3 solution was added dropwise to the mixture solution until pH reached ∼8.5. The resulting precipitate was washed several times to free from anion impurities followed by filtration. The obtained cake was oven dried for 12 h and finally calcined to various temperatures from 773 to 1073 K for 5 h at 5 K min−1 to give oxide products. The unsupported CexLa1−xO2−δ sample was also prepared by the same method. The required amounts of cerium(III) nitrate and lanthanum(III) nitrate were dissolved separately and then mixed together. Under vigorous stirring, aqueous NH3 solution was added dropwise to the mixture solution until pH ∼8.5. After completion of precipitation, the obtained slurry was annealed at various temperatures, characterized and employed for catalytic evaluation.
2.2 Characterization studies
The synthesized catalyst samples were analyzed by X-ray diffraction using a Rigaku Multiflex instrument equipped with a nickel-filtered Cu Kα (0.15418 nm) radiation source and a Scintillation counter detector. The intensity data were collected over a 2θ range of 12–80° with a 0.02° step size and using a counting time of 1 s per point. The average crystallite size of the oxide phases was estimated with the help of the Scherrer equation and the lattice parameter was calculated by a standard cubic indexation method. The TEM-HREM studies were made on a JEM-2010 (JEOL) instrument equipped with a slow-scan CCD camera and at an accelerating voltage of 200 kV. Samples for TEM were prepared by crushing the materials in an agate mortar and dispersing them ultrasonically in ethyl alcohol. After dispersion, a droplet was deposited on a copper grid supporting a perforated carbon film and allowed to dry. The specimen was examined under vacuum at room temperature. Specific surface areas of the samples were determined by BET analysis of the nitrogen adsorption isotherms at liquid N2 temperature (77 K) recorded on a SMART SORB–92/93 instrument via a thermal conductivity detector (TCD). Prior to the experiment, samples were degassed at 393 K for 2 h to remove any surface adsorbed residual moisture. The surface area is obtained by using desorption data.The XPS analysis was performed using a Shimadzu (ESCA 3400) spectrometer. The X-ray source utilized was Mg Kα (1253.6 eV) radiation. The analysis was done at room temperature and samples were maintained in a rigorous vacuum typically in the order of less than 10−8 Pa to avoid a large amount of noise in the spectra from contaminates. All binding energies measured were within a precision of ±0.2 eV. The binding energies were corrected by setting the binding energy (BE) of the adventitious carbon (C 1s) peak at 284.6 eV. Small shifts in the peak positions in all spectra could be due to the problem in referencing the C1s peak. The UV–vis DRS measurements were performed over the wavelength range of λ = 200–750 nm using a GBS-Cintra 10e UV–vis NIR spectrophotometer with an integration sphere diffuse reflectance attachment. The sample was diluted in a KBr matrix by pelletization. The band gap of the samples was determined from the equation Eg = 1239.8/λ, where Eg is the band gap (eV) and λ (nm) is the wavelength of the absorption edges in the spectrum.
The Raman spectra were recorded with a LabRam HR800UV Raman spectrometer (Horiba Jobin-Yvon) equipped with a confocal microscope and a liquid-nitrogen cooled charge-coupled device (CCD) detector. Generally, the information related to surface/bulk of the material is a function of the laser source and it was reported that the Raman information detected by excitation laser with shorter wavelength is more sensitive to the near surface region.13 As excitation laser wavelength increases, the obtained information is nearer to the bulk of the sample. Therefore, we have selected, a 325 nm UV laser line from He–Cd laser (Melles Griot Laser), and a 632.81 nm visible laser line from an Ar+ ion laser (Spectra Physics) as excitation sources to vary the information depth of the analysis. The emission line was focused on the sample under the microscope with the diameter of the analyzed spot being ∼1 μm. The time of acquisition was adjusted according to the intensity of Raman scattering. The wavenumber values reported from the spectra are accurate to within 1 cm−1.
Reducibility of the samples was examined by TPR using a thermal conductivity detector of a gas chromatograph (Shimadzu) in a conventional apparatus. Approximately 30 mg of the sample was loaded in an isothermal zone of the reactor and heated at a rate of 10 K min–1 to 473 K using 30 mL min–1 He gas flow which facilitated driving away of the molecules that had been pre-adsorbed on the surface of the sample. After the sample was cooled to room temperature, the He was switched to 5% H2/Ar with a rate of 20 mL min−1 and the temperature was linearly raised to 1073 K at a continuous heating ramp of 5 K min–1, keeping all the parameters unchanged. The hydrogen consumption during the reduction process was calculated by passing the effluent gas through a molecular sieve trap to remove the produced water and then to the TCD.
2.3 CO oxidation reaction
The catalytic performance of the sample for CO oxidation was studied at normal pressure in the temperature range 300–773 K in a fixed bed microreactor under the temperature ramp of 5 K min−1. Approximately 100 mg of the catalyst sample (250–355 μm sieve fraction) was diluted with quartz particles of the same sieve fraction and placed in a quartz reactor. The reactor ends were plugged with ceramic wool. The reaction temperature was monitored using a thermocouple placed in the hollow part of the reactor. The following gases and gas mixtures were used for the oxidation (supplied by Air Liquide): argon (>99.999% purity), 9.98% CO (CO purity, >99.997%), and 10.2% O2 (oxygen purity, >99.995%). The total flow rates maintained by three mass flow controllers were in the range of 50–60 sccm (standard cubic centimetres per minute). The CO and CO2 gas concentrations were measured using a Uras 14 infrared analyzer module, and the O2 concentration was measured using a Magnos 16 analyzer (Hartmann & Braun). Prior to oxidation of CO, the catalyst was heated to 773 K in the 10.2% O2/Ar gas mixture, using a heating ramp of 10 K min−1, and kept at the final temperature for 1 h. The oxidized sample was then purged in argon. Partial pressures of CO and O2 were in the range of 10 mbar.3. Results and discussion
3.1 Structural characterization
The surface area of the CLT 773 sample is found to be 106 m2 g−1 CL. This increased surface area of the titania supported CL sample compared to unsupported CL (66 m2 g−1) could be explained as high dispersion of the active component over the support. The lattice parameters and crystallite sizes calculated using XRD data for various samples are summarized in Table 1. From the table, it is evident that smaller crystallites of the active component are observed at various calcination temperatures, which obviously confirms a distinct sintering compared to unsupported CL. This could be explained based on the diffusion barrier concept: the identical crystallites coagulate easily at relatively low temperatures due to agglomeration, if such similar crystallites are isolated by another type of crystallites, then the agglomeration can be suppressed.14–16XRD patterns of the CLT sample calcined at various temperatures from 773 to 1073 K are presented in Fig. 1. For comparison, XRD patterns of titania (T), ceria (C), and ceria–lanthana (CL) samples are also included. All the peaks of pure ceria could be indexed to (111), (200), (220), (311), (400), (331), and (420) crystal faces characteristic of fluorite-type cubic structure. Similar to pure ceria, the CL patterns are also typical of cubic structure, nevertheless the features are broad, systematically shifted to lower Bragg angles, and resulted in a lattice parameter of ∼5.488 Å.17 This disparate feature compared to pure ceria can be explained as due to the formation of solid solutions that originated from the partial substitution of Ce4+ (0.097 nm ionic radius) ions with large sized La3+ (0.111 nm ionic radius) ions.17
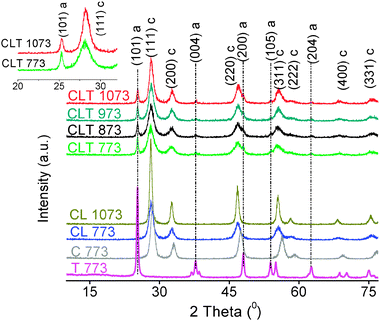 | ||
| Fig. 1 XRD patterns of ceria (C), titania (T), ceria–lanthana (CL), and titania supported ceria–lanthana (CLT) calcined at various temperatures (inset, expanded view), a–anatase; c–ceria. | ||
Both CeO2-cerianite and TiO2-anatase peaks are invariably observed from the diffraction patterns of the CLT sample. It is clear that the peaks related to ceria in CLT become much broader compared to CL. With increase in the calcination temperature, the intensity of the fluorite peaks is slightly increased, whereas to our surprise, the intensity of anatase peaks is gradually decreased (a significant decrease from CLT 773 to CLT 873 and subsequently a meagre decrease from CLT 873 to CLT 1073). The former decrease may be due to ordering of the residue disordered portions of the precipitates. The expected reasons for the latter remarkable observation could be (i) anatase–rutile phase transformation, (ii) Ti incorporation into the ceria lattice, and (iii) formation of mixed compounds with ceria. However, the features corresponding to the rutile phase are not detected in the investigated range, which evidences the inhibition of anatase–rutile transformation. In addition, the lattice parameter of the CLT sample (∼5.492 Å) at various calcination temperatures is found to be analogous to that of the CL sample since the peak position is retained in the XRD, which confirms that under the present preparation conditions the Ti incorporation is not taking place. Moreover, the absence of any other peak in the explored temperature range emphasizes that there is no formation of mixed compounds. However, we cannot completely rule out the possibility of the formation of mixed compounds which could be in the form of the amorphous state being beyond the detection limit. Apart from this, a set of elegant experiments were performed by various research groups and they came out with different explanations for this type of observation. For instance, Gao and co-authors performed selective catalytic reduction of NO with NH3 on a CeO2/TiO2 catalyst, where the decrease in the titania-anatase peak intensity was interpreted based on the interaction of ceria with titania: the lower the peak intensity, the more the interaction (the anatase phase is stabilized by the interaction between the tetrahedral Ti and octahedral Ti).18,19 On the other hand, Larsson and Anderssony indicated that an enough number of ceria crystallites are able to prevent the TiO2 crystals from being in contact with each other and thereby reduce the crystal growth.10 To understand this issue clearly, further clarifications are envisaged.
XPS is a convenient means of measuring the valence states of the constituents present in the sample. O 1s core level spectra are shown in Fig. 2. The O 1s spectrum is considered as being composed of more than one peak. The component peak that resides at high binding energy (∼532.2 eV) is assigned to either the presence of a weakly adsorbed species and/or subsurface low-coordinated oxygen ions or surface hydroxyl and/or carbonate species.20 The presence of the hydroxyl and carbonate groups is also confirmed from FTIR (∼3425 cm−1; OH stretching) and C 1s spectra (∼290 eV), respectively. It is noted that this peak is observed at high intensity for the CLT 773 sample compared to CL 773. But, the shoulder of the C 1s core level peak at ∼290 eV for CLT 773 is less intense than the CL 773 (figure not shown), hence major contribution from carbonates seems unlikely, which indicated the presence of either defective titania or a slight excess amount of Ce3+ ions (major contribution comes from the OH groups) over the CLT surface.21–23 The additional low binding energy component peak is ascribed to oxygen present in the lattice site. This particular component peak for the CLT sample has been slightly shifted (∼0.6 eV, the extent of the shift is not consistent at different calcination temperatures, which may be due to the C 1s referencing problem) toward the higher binding energy side with reference to the CL sample. In fact, the binding energy of lattice oxygen for CL is around 529.4 ± 0.1 eV and that for titania is ∼530.0 ± 0.2 eV.24 In addition, it is well known that Ti is more electronegative in nature and has high electron affinity. The mixture of CL and titania phases could stimulate transfer of some electron density from O2− to Ti4+ as a result, shifting the lattice oxygen peak toward high binding energy. Therefore, these results have given a clue that the titania supported solid solutions formed not by the simple deposition rather a chemical interaction at the interface between the support and the active component.25 With increase in the calcination temperature, the relative ratio of high and low binding energy component peak intensities consistently decreased signifying progressive loss of surface residues.
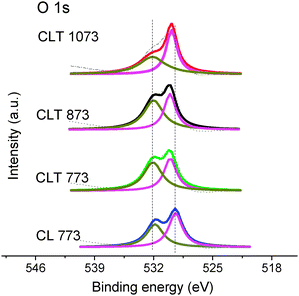 | ||
| Fig. 2 O 1s XPS of ceria–lanthana (CL) and titania supported ceria–lanthana (CLT) solid solutions calcined at various temperatures. | ||
Ti 2p core levels are very good indicators of the stoichiometry of the TiO2 surface. The Ti 2p3/2 peak for pure titania is observed approximately at 459.5 eV indicating that Ti certainly existed in the core level in a quadrivalent chemical state.25–27 Ti 2p core level spectra are shown in Fig. 3. A small but significant shift toward lower binding energy is noted for CLT 773 (∼0.2 eV) and is increased with increasing calcination temperature (∼0.8 eV shift for CLT 1073). This shift is significantly larger than the shifts originating from the referencing problems (as mentioned in the Experimental section). But, the shift is not high enough to be assigned to Ti3+ since the difference is much smaller than the reported value of ∼2.0 eV between Ti4+ and Ti3+ ions.28 Generally, such core-level binding energy shifts are attributed to the combination of factors such as local electronic properties, bonding geometries, change in coordination, etc., which have been verified in several previous reports.29–31 Therefore, the low binding energy shift is perhaps because Ti ions not only bind to neighbouring Ti ions by Ti–O–Ti linkages but also to the surrounding overlayer through the formation of Ti–O–M (M; Ce/La) cross linkages at the interface.
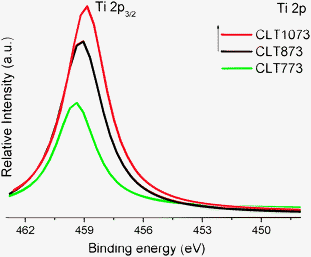 | ||
| Fig. 3 Ti 2p XPS of titania supported ceria–lanthana (CLT) solid solutions calcined at various temperatures; the intensity is given relative to the intensity of the Ce 3d signal. | ||
Ce 3d core level spectra are presented in Fig. 4. Ce 3d is composed of u and v multiplets corresponding to 3d3/2 and 3d5/2, respectively, referring to various final states that are caused by transitions from O 2p to Ce 4f states. The assignment of peaks defined in the figure was clearly designated in the earlier reports.32 The peaks v0 and u0 are very difficult to resolve from v and u because their energy separation is small. It can be stated from peak envelopes of pure ceria and CL samples that the chemical valence of Ce on the surface is mostly Ce4+. Although most of the Ce ions are in the Ce4+ state, the presence of Ce3+ ions is also unveiled. The intensity of u/ and v/ is clearly increased at the expense of u// and v// by the addition of the titania support. This disclosed the existence of high amounts of Ce3+ over the CL surface when it was dispersed onto the support material. With increase in the calcination temperature, a slight increase in the u//v/ and u0/v0 with simultaneous decrease in u////v/// intensity is observed, which infers a gradual increase of Ce3+ ions.
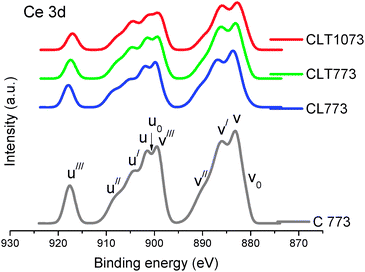 | ||
| Fig. 4 Ce 3d XPS of ceria (C 773), ceria–lanthana (CL 773), and titania supported ceria–lanthana (CLT) solid solutions calcined at different temperatures. | ||
The low binding energy shift in the Ti 2p core level peak in association with a small excess amount of Ce3+ (observed from Ce 3d) may signify the stabilization of the anionic oxygen layer on the titania surface that produced an electrostatic potential between itself and its cationic counterpart at the metal–oxide interface, consequently facilitating a mere charge transfer between them, which is discussed in the subsequent sections. After consideration of both XRD and XPS results, it is clear that there may be a probable formation of Ti–O–Ce type of bonds by the interaction of Ce and Ti ions at the interface, devoid of intermixing which is presumed in XRD. Supporting this, the recent reports also outlined and well explained that the oxygen (probably two bridging and one in plane oxygen) of Ti is shared by both Ce and Ti in an interfacial region of the active component and support.19,33,34 These interactions are thought to play an important role in assisting the CO oxidation, discussed in ensuing sections.
UV–vis DRS is a suitable technique for the solids. DR measurement is performed in the ultra-violet region to observe the charge transfer transitions. Generally, for pure ceria, three characteristic absorption bands are noted in the range of 250–400 nm and no absorption bands beyond this region (Fig. S1, ESI†).17 By analogy to the pure ceria, the CLT sample has also given characteristic bands which are presented in Fig. 5. Specifically, appearance of the Ce3+ ← O2− charge transfer band at ∼255 nm reflects the defects induced in the ceria lattice, which is high in intensity and well resolved compared to pure ceria. The latter two bands are assigned to Ce4+ ← O2− charge transfer and interband transitions, respectively. In general, the adsorption edge for pure titania anatase is estimated to be around 400 nm.35 From the spectrum, a small red-shift of the electronic absorption with respect to the pure titania and a significant blue-shift with respect to pure ceria are observed (see the inset). With increase in the calcination temperature, the absorption edge further shifts to the visible light region. Interaction of Ti with Ce ions at the interface can be deemed as an impurity band with n-type identity.36 As aforementioned, the red-shift can be ascribed to the charge-transfer between the impurity band and the conduction band of TiO2. Accordingly, the band gap energy diminishes from 3.2 → 2.9 → 2.8 eV for titania → CLT 773 → CLT 1073, respectively. Therefore, with the influence of the interface effects, the electronic properties of titania are also modified in conjunction with the shift in the binding energy of Ti 2p3/2 as exemplified in the XPS.
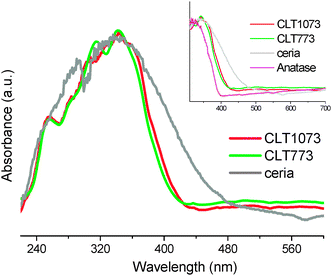 | ||
| Fig. 5 UV–vis DRS of ceria, titania (anatase), and titania supported ceria–lanthana (CLT) solid solutions calcined at different temperatures (inset, the expanded view of adsorption edge). | ||
TEM is one of the most powerful and versatile techniques for characterization of nanostructured systems. TEM images of the CLT sample calcined at 773 and 1073 K are not clearly visible rather aggregated particles are observed (Fig. S2, ESI†). HREM micrographs of the CLT sample calcined at 773 and 1073 K are presented in Fig. 6 and 7, respectively. The closer view of selected areas of the HREM image revealed the presence of fringes with different d-spacing which allow for assigning the TiO2 and ceria–lanthana. It is clear from the figures that the particle size fall in the nanometre range and the mean particle sizes are nearly close to the crystallite sizes calculated by the Scherrer equation. Generally, nanoparticles (large surface-to-volume ratio) with high surface energy fuse together and become large ensembles in order to lower the surface energy.37 Therefore, with increase in the calcination temperature, particles congregate with each other and lead to sintered particles. However, it has given an impression that the titania particle size is not significantly changed with temperature. Zhang et al. have suggested that the titania agglomeration and subsequent anatase to rutile phase transformation start at the interface of two titania-anatase particles (Fig. 6, inset A).35 Interestingly, the active component avoided the intimate contact of two interfaces of the titania-anatase particles (Fig. 6 (inset B) and Fig. 7), hence the particle size of titania was not affected much and thereby inhibiting anatase–rutile phase transformation. The overlapped region of two interfaces of the active component and the support (Fig. 6, inset B) could also be an additional indication of the intimate interaction of the active component with the support.
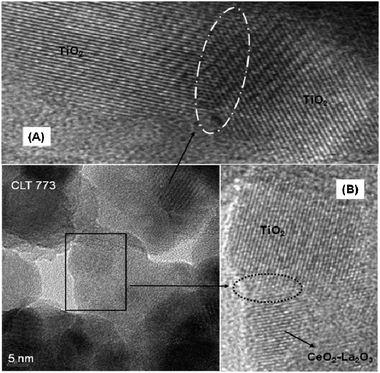 | ||
| Fig. 6 HREM of titania supported ceria–lanthana (CLT) solid solutions calcined at 773 K ((A) and (B) are insets). | ||
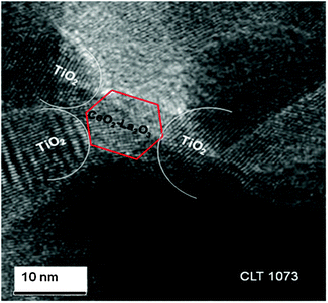 | ||
| Fig. 7 HREM of titania supported ceria–lanthana (CLT) solid solutions calcined at 1073 K. | ||
Raman spectroscopy is an interesting tool to analyze structural characteristics of the nanomaterials at a local level, particularly of ceria based materials owing to the strong sensitivity of phonon characteristics to the nature of the dopant ions. UV–RS of CLT are presented as stacked plots in Fig. 8. For comparison, titania (T), ceria (C), and ceria–lanthana (CL) samples are also included. The corresponding Vis–RS are shown in Fig. S3 (ESI†). Ceria crystallizes in fluorite-like cubic structure and frequently gives a sharp first-order Raman band at ∼465 cm−1 (F2g) due to symmetrical stretching of the Ce–O vibrational unit in 8-fold coordination.38 Usually, this band is influenced by several factors, such as strain, inhomogeneity of the size distribution, defects, variations in phonon relaxation with particle size, etc.38 As the La3+ ion gets incorporated into the ceria lattice, the F2g band shifts toward the lower wavenumber, the shape of this feature gets asymmetric and becomes broader, and peaks corresponding to La2O3 disappeared (the band often observed at ∼405 cm−1 is attributed to the torsional skeleton mode of hexagonal units), indicating that ceria formed a solid solution with lanthana.17,39
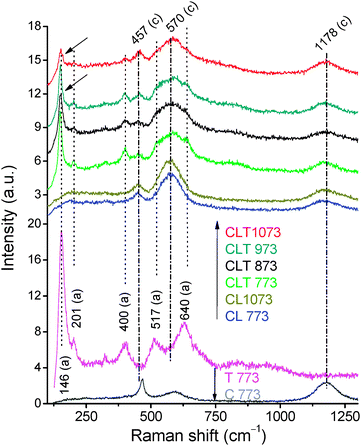 | ||
| Fig. 8 UV–RS of titania (T), ceria (C), ceria–lanthana (CL), and titania supported ceria–lanthana (CLT) solid solutions calcined at various temperatures, a—anatase; c—ceria. | ||
In the UV/Vis–RS of CLT, five distinctive anatase bands at 146 cm−1 (Eg), 201 cm−1 (Eg), 400 cm−1 (B1g), 517 cm−1 (A1g + B1g), and 640 cm−1 (Eg) along with the F2g band are observed.23 No bands related to the rutile phase (232 cm−1 (the peak related to a multi-phonon process), 446 cm−1 (Eg), and 609 cm−1 (A1g)) are observed, suggesting the existence of only anatase phase in the presence of the CL component despite the stable rutile phase.27 In addition, from the figure, it could be seen that the F2g band position of CLT is unaffected with reference to the CL sample, indicating supported ceria–lanthana solid solution formation without incorporation of titania into the ceria lattice. In agreement with the XRD results, with increase in calcination temperature, the intensity of the anatase peak is consistently decreased in both UV–and Vis–RS. Simultaneously, a weak hump particularly in UV–RS is observed at ∼159 cm−1 (indicated with arrows) evidencing the oxygen deficiency in the titania lattice.40
In UV–RS, along with the anatase and F2g bands, two supplementary bands, non-degenerate LO mode at ∼570 cm−1 and 2 LO modes at ∼1170 cm–1 are also observed.41,42 These two non-degenerate LO and 2 LO bands are typical of oxygen vacancies introduced due to strain/charge compensation.43,44 Particularly, for La3+ doped ceria the band at ∼570 cm−1 is relatively highly intense compared to pure ceria, inferring a large number of oxygen vacancies near the surface region.13
H2-consumption profiles of CL and CLT samples are presented in Fig. 9. Pure ceria gives two reduction peaks at ∼770 and ∼1100 K ascribed to easily reducible surface capping oxygen and bulk reduction, respectively.45,46 It is generally accepted that the doped ceria strongly favours the reduction, first by making easier surface reduction because of high surface area followed by bulk reduction through accelerating oxygen mobility in the bulk. As stated, for the CL sample also, both surface and bulk reduction peaks are shifted to the low temperature side. CLT 773 and CLT 1073 exhibited two reduction peaks at 696, 837 K and 701, 853 K for surface and bulk reductions, respectively. No peaks beyond 1000 K are observed. The perusal of TPR profiles revealed that reduction peaks corresponding to CLT (surface as well as bulk) shifted to low temperature compared to pure ceria due to the combined effect of the La dopant and the titania support.47 The titania support induces more surface active sites to absorb more amount of hydrogen through the dispersion of the active component over it, on the other hand, the La3+ dopant provokes the oxygen vacancies into the lattice and thus decreases the activation energy for the bulk oxygen diffusion. Therefore, for CLT 773, both surface and bulk reductions are observed as one volcano curve with a low trough in the middle and could not be distinguished as both processes occur almost simultaneously. While for the CLT 1073 sample, both peaks appeared to be well resolved since the bulk reduction peak is shifted to high temperature. In addition to the shift, H2 consumption is also decreased with calcination temperature due to sintering of the sample.
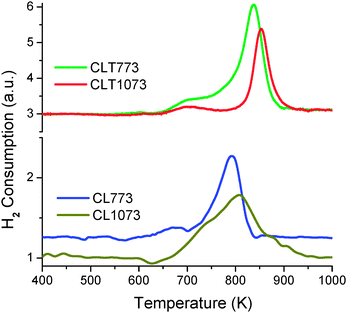 | ||
| Fig. 9 TPR of ceria–lanthana (CL) and titania supported ceria–lanthana (CLT) solid solutions calcined at different temperatures. | ||
3.2 Catalytic activity
CO conversion as a function of reaction temperature is shown in Fig. 10. The catalytic performance was measured using T50 (temperature where 50% of CO is consumed). The CO performance order is as follows: CLT 773 > CL 773 > CL 1073 > CLT 1073. Another important finding is that the difference between the limiting temperature (T100) and light off temperature (T50) is as high as ∼156 K for the CL 773 sample, whereas, it is only 44 K for the CLT 773 sample.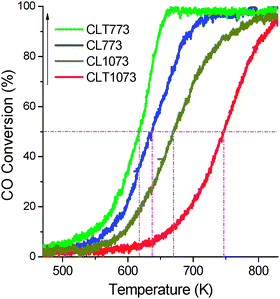 | ||
| Fig. 10 CO conversion vs. reaction temperature of ceria–lanthana (CL) and titania supported ceria–lanthana (CLT) solid solutions calcined at different temperatures. | ||
CO oxidation is slightly difficult to anticipate due to strong interdependence of the structure, redox behaviour, and catalytic activity. It is widely established that CO oxidation involves lattice oxygen of CeO2 through the Mars–van Krevelen (MVK) mechanism where CO adsorbs (through C-end) on the surface oxygen and simultaneously facilitates bond making between O of ceria and C of CO, and bond breaking between Ce–O, ultimately expelling the CO2.48 On the basis of both the MVK mechanism and our characterization results, we have proposed an hypothetical scheme for the CO oxidation as shown in Fig. 11. The scheme illustrates that the CO oxidation proceeds through a monotonous reduction and oxidation of the surface, driven by the repeated formation and consecutive replenishment of oxygen vacancies utilizing gas-phase oxygen/bulk oxygen, respectively. Diffusion of bulk oxygen occurs via a vacancy hopping mechanism: the oxygen vacancy penetrates into the bulk, conversely the oxide ion diffuses onto the surface of the material.49,50 If the diffusion of bulk oxygen is sufficiently fast, then a continuous supply of oxygen from the bulk to the surface will guarantee the enhancement in the reducibility. It is widely known that the La3+ ion as a dopant induces one oxygen vacancy (v) for every two Ce4+ ions to maintain the electrostatic balance.17 The presence of these vacancies is also supported by the peaks at the respective positions in the RS and UV-vis DRS measurements.17 These newly engendered oxygen vacancies ease diffusion of bulk oxygen for the involvement in the redox process. Besides, the interaction of Ce and Ti at the interface renders an apparent specific orientation for the effective adsorption of CO and for the bulk oxygen diffusion, thereby rapid and repeatable redox cycles.
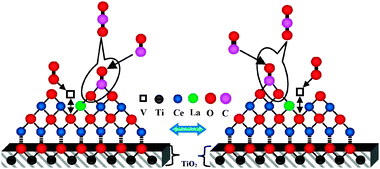 | ||
| Fig. 11 Proposed schematic representation for the CO oxidation pathway over titania supported ceria–lanthana (CLT) solid solutions. | ||
Interestingly, though the Ce and Ti interaction is increased with calcination temperature, the reaction appeared to be sluggish. CLT 1073 is seemed to be even less active than the unsupported CL 1073 despite its lower particle size. The increased interaction of Ce and Ti with calcination temperature has turned out to be ineffective, which may compromise the redox efficiency of Ce ions, consequently declining the CO conversion. Decrease in the surface area, loss of dispersion, and decrease in the reducibility (confirmed by H2-TPR) could also be responsible for the decrease in CO activity. It is worth mentioning here that the amount of La3+ is crucial for the creation of an optimum amount of oxygen vacancies.51 Therefore, a best balance among the redox species (Ce), dopant element (La), and Ce and Ti interaction ensured the enhanced CO activity.
4. Conclusions
Titania supported ceria–lanthana solid solution was successfully synthesized by a deposition coprecipitation method. La3+ dopant ions induced prominent oxygen vacancies at the expense of charge neutralization. With the titania support and in turn with increase in the calcination temperature from 773 to 1073 K, quite intriguing observations were found: (i) decrease in the titania-anatase peak intensity from both XRD and Raman results, (ii) high and low binding energy shifts, respectively, from O 1s and Ti 2p and a relatively good number of Ce3+ ions from Ce 3d core level spectra, (iii) a slight red shift in the absorption edge from UV-vis DRS, and (iv) insignificant particle growth from TEM. All these remarkable observations suggested that the formation of supported solid solutions is not by simple deposition rather a chemical interaction at the interfaces with Ti–O–Ce type of bond formation. The catalytic performance of various samples followed the order: CLT 773 > CL 773 > CL 1073 > CLT 1073. The combination of different experimental findings indicated that the observed enhanced catalytic performance for CLT 773 was mainly related to oxygen deficiency induced by doping coupled with the Ce and Ti interaction at the interface of the highly dispersed active component and the support. In the light of results obtained from material characterization and activity studies, the optimized amount of oxygen vacancies and Ce and Ti interaction as well could make CLT an excellent material even at elevated temperatures, which will be undertaken in our ongoing research.Acknowledgements
L.K. thanks Council of Scientific and Industrial Research (CSIR), New Delhi, for senior research fellowship. Thanks are due to DST, New Delhi, and DAAD, Germany, for financial support under a bilateral collaboration program (DST-DAAD-PPP-2010).Notes and references
- T.-D. Nguyen and T.-O. Do, in Size- and Shape-Controlled Synthesis of Monodisperse Metal Oxide and Mixed Oxide Nanocrystals, ed. Y. Masuda, In Tech, Canada, 2011, ch. 2, pp. 55–84 Search PubMed.
- Y. Xu and M. Mavrikakis, J. Phys. Chem. B, 2003, 107, 9298 CrossRef CAS.
- W. Y. Hernandez, M. A. Centeno, F. R. Sarria and J. A. Odriozola, J. Phys. Chem., 2009, 113, 5629 CAS.
- B. Bonnetot, V. Rakic, T. Yuzhakova, C. Guimon and A. Auroux, Chem. Mater., 2008, 20, 1585 CrossRef CAS.
- W. Shan, W. Shen and C. Li, Chem. Mater., 2003, 15, 4761 CrossRef CAS.
- J.-G. Li, T. Ikegami, T. Mori and T. Wada, Chem. Mater., 2001, 13, 2913 CrossRef CAS.
- M. Alifanti, B. Baps, N. Blangenois, J. Naud, P. Grange and B. Delmon, Chem. Mater., 2003, 15, 395 CrossRef CAS.
- G. Dutta, U. V. Waghmare, T. Baidya, M. S. Hegde, K. R. Priolkar and P. R. Sarode, Chem. Mater., 2006, 18, 3249 CrossRef CAS.
- B. M. Reddy, P. Bharali, P. Saikia, G. Thrimurthulu, Y. Yamada and T. Kobayashi, Ind. Eng. Chem. Res., 2009, 48, 453 CrossRef CAS.
- P.-O. Larsson and A. Anderssony, J. Catal., 1998, 179, 72 CrossRef CAS.
- J. Matthiesen, PhD Thesis, University of Aarhus, Denmark, 2007 Search PubMed.
- E. Guglielminotti and F. Boccuzzi, J. Mol. Catal. A: Chem., 1996, 104, 273 CrossRef CAS.
- M.-F. Luo, Z.-L. Yan, L.-Y. Jin and M. He, J. Phys. Chem. B, 2006, 110, 13068 CrossRef CAS.
- M. Sugiura, Catal. Surv. Asia, 2003, 1, 77 CrossRef.
- H. Shinjoh, J. Alloys Compd., 2006, 408, 1061 CrossRef.
- S. Matsumoto, Catal. Today, 2004, 90, 183 CrossRef CAS.
- B. M. Reddy, L. Katta and G. Thrimurthulu, Chem. Mater., 2010, 22, 467 CrossRef CAS.
- X. Gao, Y. Jiang, Y. Fu, Y. Zhong, Z. Luo and K. Cen, Catal. Commun., 2010, 11, 465 CrossRef CAS.
- M. S. P. Francisco and V. R. Mastelaro, Chem. Mater., 2002, 14, 2514 CrossRef CAS.
- H. Borchert, Y. V. Frolova, V. V. Kaichev, I. P. Prosvirin, G. M. Alikina, A. I. Lukashevich, V. I. Zaikovskii, E. M. Moroz, S. N. Trukhan, V. P. Ivanov, E. A. Paukshtis, V. I. Bukhtiyarov and V. A. Sadykov, J. Phys. Chem. B, 2005, 109, 5728 CrossRef CAS.
- W. Göpel, J. A. Anderson, D. Frankel, M. Jaehnig, K. Phillips, J. A. Schafer and G. Rocker, Surf. Sci., 1984, 139, 333 CrossRef.
- R. L. Kurtz, R. Stockbauer, T. E. Madey, E. Roman and J. L. Desegovia, Surf. Sci., 1989, 218, 178 CrossRef CAS.
- P. Ji, J. Zhang, F. Chen and M. Anpo, J. Phys. Chem. C, 2008, 112, 17809 CAS.
- J. Fang, X. Bi, D. Si, Z. Jiang and W. Huang, Appl. Surf. Sci., 2007, 253, 8952 CrossRef CAS.
- S. Watanabe, X. Ma and C. Song, J. Phys. Chem. C, 2009, 113, 14249 CAS.
- X. Chen, Y. Lou, A. C. S. Samia, C. Burda and J. L. Gole, Adv. Funct. Mater., 2005, 15, 41 CrossRef CAS.
- U. Diebold, Surf. Sci. Rep., 2003, 48, 53 CrossRef CAS.
- C. D. Wagner, W. M. Riggs, L. E. Davis and J. F. Moulder, in Handbook of X-ray Photoelectron Spectroscopy, ed. G. F. Mullenberg, Perkin-Elmer Corporation, Eden Prairie, MN, 1978 Search PubMed.
- D. Kumar, M. S. Chen and D. W. Goodman, Thin Solid Films, 2006, 515, 1475 CrossRef CAS.
- B. M. Reddy, B. Chowdhury and P. G. Smirniotis, Appl. Catal., A, 2001, 211, 19 CrossRef CAS.
- R. Reiche, S. Oswald, F. Yubero, J. P. Espinos, J. P. Holgado and A. R. Gonzalez-Elipe, J. Phys. Chem. B, 2004, 108, 9905 CrossRef CAS.
- A. Burroughs, A. Hamnett, A. F. Orchard and G. Thornton, J. Chem. Soc., Dalton Trans., 1976,(17), 1686 RSC.
- J. B. Park, J. Graciani, J. Evans, D. Stacchiola, S. D. Senanayake, L. Barrio, P. Liu, J. F. Sanz, J. Hrbek and J. A. Rodriguez, J. Am. Chem. Soc., 2010, 132, 356 CrossRef CAS.
- J. B. Park, J. Graciani, J. Evans, D. Stacchiola, M. Shuguo, L. Ping, A. Nambu, J. F. Sanz, J. Hrbek and J. A. Rodriguez, Proc. Natl. Acad. Sci. U. S. A., 2009, 106, 4975 CrossRef CAS.
- J. Zhang, M. Li, Z. Feng, J. Chen and C. Li, J. Phys. Chem. B, 2006, 110, 927 CrossRef CAS.
- C.-H. Wei, X.-H. Tang, J.-R. Liang and S.-Y. Tan, J. Environ. Sci. (Beijing, China), 2007, 19, 90 CAS.
- H. T. Zhang, G. Wu and X. H. Chen, Mater. Chem. Phys., 2007, 101, 415 CrossRef CAS.
- B. M. Reddy, G. Thrimurthulu, L. Katta, Y. Yamada and S.-E. Park, J. Phys. Chem. C, 2009, 113, 15882 CAS.
- R. Abe, M. Higashi, K. Sayama, Y. Abe and H. Sugihara, J. Phys. Chem. B, 2006, 110, 2219 CrossRef CAS.
- G. Liu, H. G. Yang, X. Wang, L. Cheng, H. Lu, L. Wang, G. Q. Lu and H.-M. Cheng, J. Phys. Chem. C, 2009, 113, 21784 CAS.
- T. Taniguchi, T. Watanabe, N. Sugiyama, A. K. Subramani, H. Wagata, N. Matsushita and M. Yoshimura, J. Phys. Chem. C, 2009, 113, 19789 CAS.
- W. H. Weber, K. C. Hass and J. R. Mc Bridge, Phys. Rev. B: Condens. Matter, 1993, 48, 178 CrossRef CAS.
- J. E. Spanier, R. D. Robinson, F. Zhang, S. W. Chan and I. P. Herman, Phys. Rev. B: Condens. Matter, 2001, 64, 245407 CrossRef.
- W. Shan, Z. Feng, Z. Li, J. Zhang, W. Shen and C. Li, J. Catal., 2004, 228, 206 CrossRef CAS.
- L. Katta, P. Sudarsanam, G. Thrimurthulu and B. M. Reddy, Appl. Catal., B, 2010, 101, 101 CrossRef CAS.
- A. Trovarelli, Comments Inorg. Chem., 1999, 20, 263 CrossRef CAS.
- J. Xu, J. Harmer, G. Li, T. Chapman, P. Collier, S. Longworth and S. C. Tsang, Chem. Commun., 2010, 46(11), 1887 RSC.
- M. Huang and S. Fabris, J. Phys. Chem. C, 2008, 112, 8643 CAS.
- C. R. A. Catlow, J. Chem. Soc., Faraday Trans., 1990, 86, 1167 RSC.
- M. Nolan, J. E. Fearon and G. W. Watson, Solid State Ionics, 2006, 177, 3069 CrossRef CAS.
- F. Deganello and A. Martorana, J. Solid State Chem., 2002, 163, 527 CrossRef CAS.
Footnote |
| † Electronic supplementary information (ESI) available: Additional characterization studies supporting the results which include: UV-vis DRS, TEM, and Vis-RS measurements. See DOI: 10.1039/c2cy00449f |
| This journal is © The Royal Society of Chemistry 2012 |
