Promotional effect of zirconium additives on Ti0.8Ce0.2O2 for selective catalytic reduction of NO
Yuesong
Shen
*,
Yifan
Ma
and
Shemin
Zhu
College of Materials Science and Engineering, State Key Laboratory of Materials-Oriented Chemical Engineering, Nanjing University of Technology, Nanjing 210009, China. E-mail: sys-njut@163.com; Fax: +86 25 83240205
First published on 21st December 2011
Abstract
Flue gas denitrification has been a worldwide topic to build a low carbon society. In view of its high efficiency, high stability, mature technology and large amount of flue gas treatment, selective catalytic reduction (SCR) has been the most promising approach for removing NOx. As the core of the SCR technology, the catalyst has been attracting wide attention. In particular, developing a novel metal oxide denitrification catalyst with merits of high efficiency, low cost and being environmentally friendly has become an emerging research topic for environmental protection. The TiO2–CeO2 complex oxides reveal optimal catalytic performance and are considered by many as an excellent catalytic material for future SCR of NOx. In order to further enhance its anti-poisoning ability and optimize the catalytic stability of the TiO2–CeO2 complex oxides in denitrification, the promotional effect of a zirconium additive on the catalytic performance of the representative Ti0.8Ce0.2O2 for NH3-SCR of NO is systematically studied for the first time in the present work. Results show that zirconium additives not only dramatically improve the catalytic activity and N2 selectivity, but also significantly enhance the anti-sulfur ability. The promotional mechanism indicates that the improving effects are not induced by variation of specific surface area, but are caused by other reasons relating to redox properties, microstructure, and surface acidity of the catalyst.
1. Introduction
In view of worsening air pollution and global warming threats, it has been a worldwide topic to build a low carbon society.1 Nitrogen oxides (NOx) are major air pollutants that not only cause acid rain and photochemical smog but also induce the greenhouse effect.2–4 Currently, NOx pollution is getting more serious. Stringent emission regulations, rigorous emission control standards and growing environmental awareness are being imposed or raised to reduce the NOx pollution. Thereby, highly efficient denitrification has become a very important and challenging research subject worldwide. Various alternative denitrification techniques such as selective non-catalytic reduction, selective catalytic reduction, electron beam irradiation, pulse corona plasma, carbon reduction, adsorption method, microwave method, microbiological method, plasma method, and so on,5,6 have been explored in recent years to remove NOx from stationary sources. Among all the denitrification techniques, selective catalytic reduction (SCR) has been recognized as the most promising approach for removing NOx from coal-fired flue gas.5,7,8 As the technological core of the SCR process, SCR catalysts include noble metals, metal oxides and ion exchanged zeolites.9 In particular, transition metal oxides are probably the best candidates for SCR of NOx due to efficient catalytic activity, high selectivity, good anti-poisoning performance, superior hydrothermal stability, and low cost.10–13 Of all the metal oxides, a complex oxide-based catalyst of V2O5(WO3,MoO3)/TiO2 is the most attractive for NH3-SCR of NOx. However, vanadium pentoxide is toxic, the spent catalysts are secondary solid pollutants,14 and nano-titania is very expensive.15 Consequently, commercial applications of V2O5(WO3,MoO3)/TiO2 will be limited in the near future. Therefore developing a novel metal oxide denitrification catalyst with merits of high efficiency, low cost and friendly environment has become an emerging research topic for environmental protection.Cerium-based oxides with advantages of high oxygen storage capacity, an empty d-electron orbital, excellent sulfur-resistance and excellent redox properties have been attracting wide attention.16 A novel CeO2/ACF catalyst is highly active for the NH3-SCR of NO at low temperature.17 The maximum NO conversion of a CeO2/Al2O3/ATS catalyst of more than 98% can be obtained at 300 °C, as described in our previous work.16 A nano-scale CeO2 catalyst withstands up to 10% water vapor in the gas mixture without losing much activity in SCR of NO with hydrocarbons.18 A novel catalyst of Ce/TiO2 is highly effective for reducing NO in the temperature range of 275–400 °C and yields 100% N2 selectivity.19 As stated above, ceria is promising to replace vanadium pentoxide and become a potential active component for NH3-SCR of NOx.
However, the oxygen storage system of the ceria is related to its thermal resistance, low-temperature activity and textural stability, which are not high enough to meet the requirements of high-temperature applications.20,21 In order to increase its thermal stability and ability to store and release oxygen during high temperature operations, other transition and non-transition metal ions can be introduced into the ceria cubic structure.22,23 Such modifications in the defect structure of ceria confer new properties to the cerium-based complex oxides, such as better resistance to sintering at high temperatures and high catalytic activity for various reactions.24 Reddy and coworkers21,22,25–28 have investigated in depth the thermal stability, micro-structure, and the oxygen storage capacity (OSC) of CeO2–MO2 binary oxides, and confirmed that the thermal stability and OSC of CeO2–TiO2 complex oxides were better than those of pure CeO2. However, they rarely investigated the catalytic application of the ceria-based complex oxides. Gao et al.29 reported that the CeO2–TiO2 complex oxide powders yield 98.6% NO conversion and 100% N2 selectivity at typical SCR reaction temperatures of 300–400 °C. Our previous work also shows that a representative Ti0.8Ce0.2O2 complex oxide reveals stable activity for NH3-SCR of NO.30
Zirconia is a novel acid–base amphoteric oxide with good redox properties, and it has been widely used as an inhibitor of crystal transformation and co-catalyst in catalysis.31,32 Zirconium additives greatly improved the properties of ceria, including oxygen storage capacity, redox properties, thermal resistance and catalytic activity at low temperature.33–37 Hickey et al.38 found that zirconia dramatically improved sulphur resistance of Ag/Ce0.16Zr0.84O2 and Ag/ZrO2 for C3H6-SCR of NO at low temperature. Herein, in order to further enhance the practical anti-poisoning ability and optimize the low temperature catalytic stability of Ti0.8Ce0.2O2 in denitrification, the promotional effect of zirconium additives on the catalytic performance of Ti0.8Ce0.2O2 for NH3-SCR of NO is systematically studied for the first time in the present work. The concrete effects of the zirconium additive on catalytic activity, N2 selectivity, anti-sulfur ability and anti-water influence are examined and discussed. A series of zirconium-doped Ti0.8Ce0.2O2 complex oxides are synthesized and tested in NH3-SCR of NO. The characterizations regarding phase transition (TG-DSC), specific surface area (N2-BET), crystal phase structure (XRD), micro-morphology (HR-TEM), surface acid amount and acid strength (NH3-TPD), surface acid sites (Py-IR) and functional groups (FT-IR) for the catalyst samples are analyzed.
2. Experimental
2.1. Synthesis of catalysts
The catalyst samples of titanium–zirconium–cerium complex oxides are separately synthesized by thermal decomposition of aged titanium–zirconium–cerium composite gels calcined at 500 °C for 2 h. The titanium–zirconium–cerium composite sols are synthesized using Ti(OC4H9)4, ZrOCl2·8H2O and Ce(NO3)3·6H2O as precursors. Composite solution A is synthesized by dissolving Ti(OC4H9)4 in ethanol (CH3CH2OH) under continuous stirring for 10 min, and composite solution B is synthesized by mixing glacial acetic acid, deionized water and CH3CH2OH. Solution B is added dropwise into solution A under continuous stirring for 20 min, and then the required amounts of Ce(NO3)3·6H2O and ZrOCl2·8H2O are dissolved in AB mixed solution under vigorous stirring for 30 min to obtain the resulting titanium–zirconium–cerium composite sols. The aged gels are obtained by aging of the sols.In order to increase the dispersion of the catalysts for NH3-SCR of NO, an activated ceramic with the particle size of 1.25–8.00 mm is used as support to load with the catalysts by impregnation methods. Each impregnation is followed by drying in air at 60 °C for 12 h and 110 °C for 6 h, and then by calcining in air at 500 °C for 2 h. The resulting catalysts and their abbreviations are given in Table 1.
| Sample | Sample abbreviations | Ti/Ce (in mol) | Ti/Zr (in mol) | Specific surface (m2 g−1) |
|---|---|---|---|---|
| Ti0.8Ce0.2O2 | TC-4 | 4 | — | 107.89 |
| Ti0.8Zr0.8Ce0.2O3.6 | TZC-1 | 4 | 1 | 108.80 |
| Ti0.8Zr0.4Ce0.2O2.8 | TZC-2 | 4 | 2 | 108.86 |
| Ti0.8Zr0.27Ce0.2O2.54 | TZC-3 | 4 | 3 | 108.73 |
| Ti0.8Zr0.2Ce0.2O2.4 | TZC-4 | 4 | 4 | 108.70 |
| Ti0.8Zr0.16Ce0.2O2.32 | TZC-5 | 4 | 5 | 108.39 |
| Ti0.8Zr0.13Ce0.2O2.26 | TZC-6 | 4 | 6 | 108.21 |
| Ti0.8Zr0.11Ce0.2O2.22 | TZC-7 | 4 | 7 | 108.14 |
| Ti0.8Zr0.1Ce0.2O2.2 | TZC-8 | 4 | 8 | 107.99 |
| Ti0.8Zr0.09Ce0.2O2.18 | TZC-9 | 4 | 9 | 107.96 |
| Ti0.8Zr0.08Ce0.2O2.16 | TZC-10 | 4 | 10 | 107.88 |
2.2. Characterization
TG-DSC measurements are performed on a STA449C comprehensive thermal analyzer. The measurement covers the temperature range 50–600 °C with a heating rate of 10 °C min−1 under an oxygen atmosphere. The specific surface area, pore volume and average pore diameter (BJH method) of the samples are measured by N2 adsorption/desorption isotherms at 77 K using a surface area analyzer (Micromeritics, 2020M V3.00H). All the samples are degassed at 350 °C under vacuum for 3 h prior to the adsorption experiments. X-ray diffraction (XRD) patterns are obtained on a D/MAX-RB X-ray diffractometer (Rigaku, Japan) using Cu Kα radiation. The 2θ scans cover the range 5–80°, and the accelerating voltage and applied current are 40 kV and 40 mA, respectively. Transmission electron microscopy is conducted by a JEM-2010 UHR transmission electron microscope (HR-TEM), using a 200 kV accelerating voltage. The samples are dispersed in methanol using an ultrasonicator for 5 min and fixed on a carbon-coated copper grid (LC200-Cu, EMS) prior to the TEM analysis. The surface functional groups and chemical bonds for the catalyst samples are identified by a FT-IR apparatus (NEXUS-670, American Nicolet Company) after being pressed with KBr.Total acidity measurement is evaluated by a temperature-programmed desorption (TPD) of ammonia using an Autochem 2910 (Micromeritics). The samples are preheated to 450 °C under a helium flow for 1 h, and then cooled to 100 °C for the ammonia adsorption. A stream containing 10 vol% NH3 in helium (30 mL min−1) is introduced for 1 h to achieve the adsorption equilibrium. Then the samples are purged with helium for 1 h to remove the weakly adsorbed ammonia. Finally ammonia is desorbed in a flow rate of 30 mL min−1 helium from 100 °C to 800 °C at a heating rate of 10 °C min−1. The ammonia desorption is monitored online by Thermo ONIX ProLab mass spectrometer. Pyridine adsorption infrared spectrum (Py-IR) measurement is performed on a Nexus 670 model FT-IR apparatus. The spectra are recorded at a resolution of 4 cm−1 and with a scan number of 64. The sample is pretreated under vacuum conditions (110 °C, 1 × 10⁻³ Pa) for 2 h, and then cooled to room temperature, finally a spectrum of the catalyst is taken as a background. After adsorbing pyridine, the sample is temperature programmed to a setting point (110 °C) for vacuum treatment for 30 min (1 × 10⁻³ Pa). After being cooled to room temperature, the IR spectrum of the sample is recorded from 1800 cm−1 to 1400 cm−1.
2.3. Measurement of catalytic activity and selectivity
Catalytic activity measurements of the catalysts for NH3-SCR of NO are carried out in a fixed-bed quartz reactor (10 mm i.d.), with 10.0 mL catalyst and 1333.3 mL min−1 gas flow rate corresponding to a gaseous hourly space velocity (GHSV) of 8000 h−1. The simulated flue gas compositions are 600 parts per million by volume (ppmv) NO, 600 ppmv NH3, 5 vol% O2, and balance Ar. The NO concentrations at the inlet and outlet of the reactor are monitored on-line by a flue gas analyzer (KM9106, Kane, British). The schematic diagram of the experimental setup is depicted in Scheme 1.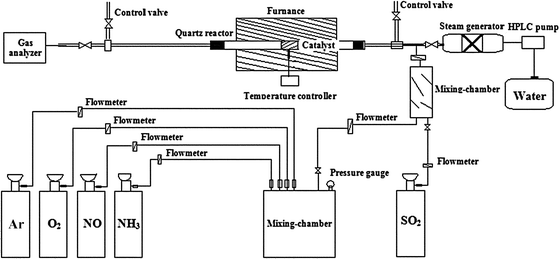 | ||
| Scheme 1 Schematic diagram of experimental setup. | ||
The catalytic activity for NH3-SCR of NO is expressed by the equation:
| XNO = ([NO]inlet − [NO]outlet)/[NO]inlet × 100% | (1) |
| 4NH3 + 4NO + O2 → 4N2 + 6H2O | (2) |
 | (3) |
3. Results and discussion
3.1. Effect of zirconium additive on catalytic activity and N2 selectivity for NH3-SCR of NO
The catalytic performances of the Ti0.8ZrxCe0.2O2(1+x) complex oxides for NH3-SCR of NO in the presence of oxygen are compared with the catalytic performance of TC-4 as shown in Fig. 1. All the catalysts are studied under identical reaction conditions (NH3/NO = 1, GHSV = 8000 h−1). As the reaction temperature increases, firstly all the catalytic activities increase in the low temperature range of 100–200 °C, and then reach their highest activities and keep stability in a certain middle temperature range of 200–350 °C, and finally decrease dramatically above 350 °C. Increasing temperature can enhance surface activation energy of the catalysts and increase kinetic energy of reactive gases, so the catalytic activities are improved greatly during the low temperature range. The maximum NO conversion in the middle temperature range for NH3-SCR of NO is a result of two competing reactions: NO reduction by NH3 and oxidation of NH3 by oxygen.39 The oxidation of NH3, which reduces the amount of reductant, becomes dominating at higher temperatures and consequently the catalytic activities decrease quickly.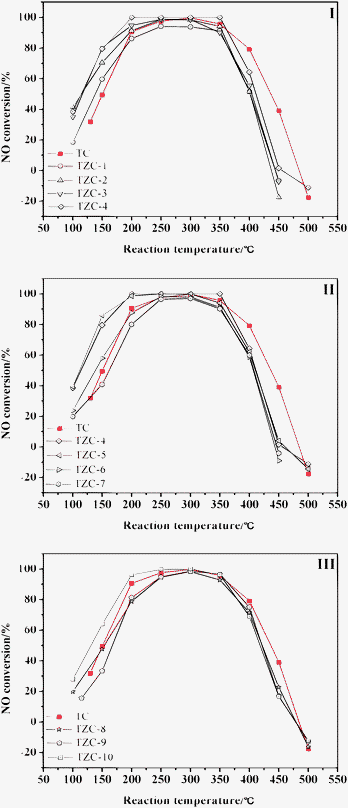 | ||
| Fig. 1 Effect of reaction temperature on NO conversions for NH3-SCR of NO. | ||
In a comparison of catalytic activities of Ti0.8ZrxCe0.2O2(1+x) complex oxides and TC-4, zirconium additives lead to different shifts of the catalytic activities toward lower temperatures compared to the TC-4 catalyst. However, zirconium additives have little effect on the active temperature window of 200–350 °C, which may be dependent on the intrinsic properties of Ti–Zr–Ce element chemical compositions.
However, as the amount of zirconium additive decreases, the real catalytic activities behave differently in the active temperature window of 200–350 °C: when 1 ≤ Ti/Zr ≤ 4, the catalytic activity increases as the zirconium additive decreases, as seen in Fig. 1(I); meanwhile, when 4 ≤ Ti/Zr ≤ 7, the catalytic activity decreases as the zirconium additive decreases, as seen in Fig. 1(II); when 8 ≤ Ti/Zr ≤ 10, the catalytic activity again increases as the zirconium additive decreases, as shown in Fig. 1(III). In the view that the redox and acid functions are the main effective factors in the NH3-SCR of NO,40 perhaps the effect mechanism of zirconium additive is also related to the redox and acid functions of the Ti0.8ZrxCe0.2O2(1+x) catalysts. In the following sections, we will significantly discuss the effect mechanism combined with characterization analysis. In any case, zirconium additives improve the catalytic activities in the low temperature of 100–200 °C. Hickey et al.38 and Adamowska et al.41 also confirmed that zirconium additives improved catalytic deNOx performance of ceria at lower temperatures. Compared with the TC-4 catalyst, particularly when the Ti/Zr is equal to 4, the TZC-4 complex oxide exhibits the most stability in the broadest active temperature range. In the following work, we will focus our attention on this optimised sample.
Both the TC-4 and TZC-4 complex oxides obtain their maximum catalytic activities at 300 °C. For the TC-4 complex oxide, the maximum catalytic activity is 99.6%; for the TZC-4 complex oxide, the maximum catalytic activity is 100%. Herein we further obtain the N2 selectivities of the two representative samples for NH3-SCR of NO at 300 °C: the TC-4 complex oxide yields 93.0% N2 selectivity and the TZC-4 complex oxide yields 99.2%. These results suggest that the interactions between the zirconium additives and the TC-4 complex oxide also enhance the N2 selectivity of the TZC-4 complex oxide for NH3-SCR of NO. Xu et al.19 and Gao et al.29 also demonstrated that the N2 selectivity of the TiO2–CeO2 complex oxides could reach 100%.
3.2. Catalyst phase transition during calcination
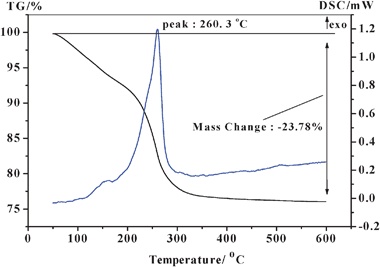
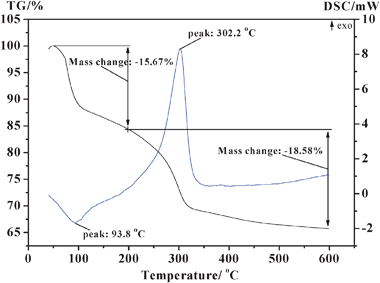
The as-synthesized TC-4 and TZC-4 complex oxides were subjected to TG-DSC analysis before calcination. The obtained thermograms, in the range of 50–600 °C and at a ramp of 10 °C min−1, are shown in Fig. 2 and 3. The thermograms of the TC-4 and TZC-4 complex oxides, in general, reveal one major DSC peak. In the case of the TC-4 sample, the total weight loss of 23.78% from 50–600 °C is primarily due to the loss of physisorbed water, dehydration of water from micropores, subsequent dehydroxylation, and thermal decomposition of nitrate and organic functional groups. However, the weight loss between 450 and 600 °C is less than 1%, which indicates that, in the temperature range of 450–600 °C, the TC-4 binary oxide is quite stable in terms of phases and chemical composition. In the case of the TZC-4, the weight loss of 15.67% from 50 to 200 °C is due to loss of physisorbed water and dehydration of water from micropores; the weight loss of 18.58% from 200 to 600 °C is due to loss of subsequent dehydroxylation, and thermal decomposition of nitrate and organic functional groups. However, the slight weight loss between 500 and 600 °C is also less than 1%. Accordingly, the TZC-4 complex oxide seems to be thermally quite stable in the range of 500–600 °C. In a comparison of the weight loss trend with the TC-4 and TZC-4 in the high temperature range of 450–500 °C, the TC-4 complex oxide seems to be more thermally stable than the TZC-4 complex oxide. From the structural point of view, there is a quite significant misfit between the ionic radii of Ce4+ (0.97 Å) and Zr4+ (0.84 Å), which is responsible for modifications of the CeO2 lattice upon insertion of ZrO2.21,42 Furthermore, the more presence of ZrO2 in the CeO2 lattice at higher calcination temperatures makes the lattice more defective, which eventually enhances the mobility of oxygen in the bulk of the CeO2–ZrO2 mixed oxides.22 Herein the zirconium additives in the TZC-4 complex oxides may also have the same effect, and the zirconium additives should enhance the OSC of the TZC-4 complex oxides, which need to be demonstrated by TPR under our further study.The DSC profile of the TC-4 sample is dramatically different in the peak maximum temperature from the TZC-4 complex oxide. The DSC profile of the TC-4 complex oxide reveals a prominent exothermic peak at 260.3 °C, indicating the titania phase transformation from amorphous to anatase and the solid-state reaction of titania–ceria mixed oxides. The DSC profile of the TZC-4 complex oxide reveals another prominent exothermic peak at 302.2 °C, also indicating the titania phase transformation from amorphous to anatase and the solid-state reaction of titania–zirconia–ceria mixed oxides. As mentioned above, the zirconium additives lead to a shift of the prominent DSC exothermic peak towards a higher temperature, conforming that zirconium additives inhibit the titania phase transformation from amorphous to anatase.
3.3. Textural characteristics
The specific surface area, pore diameter and pore volume are detected by the N2-BET method. As shown in Table 1, the BET specific surface areas of the representative TC-4 and TZC-4 complex oxides are 107.89 m2 g−1 and 108.70 m2 g−1, respectively. The BET specific surface areas of the two samples are quite similar to each other, indicating that the promotional effects of zirconium additives on the catalytic performance in NH3-SCR of NO are not induced by variation of specific surface area. In view of ionic radius influence, the ionic radii of Zr4+ and Ti4+ are 0.84 Å and 0.64 Å, respectively, and they satisfy the equation43 of| 15% < (r1 − r2)/r1 < 30%; | (4) |
However, the average pore diameters of TC-4 and TZC-4 are 9.9 nm and 8.8 nm, and the pore volumes are 0.27 cm3 g−1 and 0.24 cm3 g−1, respectively. These results illustrate that zirconium additives decrease the pore diameter and pore volume of the TZC-4 complex oxide. As the Zr4+ radius is bigger than Ti4+ radius, so the zirconium additives should increase the pore size, but the result is converse, which merely suggests that zirconium additives refine the particle size of the TZC-4 complex oxide, and the small pore diameter produces the small pore volume. Additionally, according to the Brunauer, Deming, Deming and Teller (BDDT) classifications, the N2 adsorption isotherms at 77 K for the TC-4 and TZC-4 complex oxides reveal typical IV isotherm shape, indicating the mesoporous structure of the two samples.
3.4. XRD analysis
Fig. 4 presents the X-ray diffraction patterns of zirconium-doped Ti0.8ZrxCe0.2O2(1+x) powders calcined at 500 °C for 2 h. All the reflections of the Ti0.8ZrxCe0.2O2(1+x) complex oxides provide typical diffraction patterns for the anatase TiO2 (PDF-ICDD 1-562), cubic CeO2 (PDF-ICDD 1-800), orthorhombic ZrTiO4 (PDF-ICDD 7-290), orthorhombic Ce2TiO5 (PDF-ICDD 49-1606), and cubic Ce2Zr2O7 (PDF-ICDD 8-221). As shown in Fig. 4, the crystallinity decreases as the zirconium additive increases. The intensities of the diffraction peaks pertaining to TiO2-anatase and CeO2 cubic phases decrease as the Ti/Zr molar ratios decrease and the intensity of the broad diffraction peaks centered at 31° pertaining to amorphous phase becomes more prominent, indicating that zirconium additives inhibit the titania phase transformation from amorphous to anatase and inhibit crystal nucleus growing, so the zirconium additives enhance the thermal stability of active amorphous phase. Moreover, as the ionic radii of Zr4+ (0.84 Å) and Ti4+ (0.64 Å), and the ionic radii of Ce3+ (1.18 Å) and Zr4+ (0.84 Å) both satisfy eqn (4), respectively, so the ZrO2 can react with TiO2 or Ce2O3 to form discontinuous solid solutions, which are demonstrated by the diffraction peaks pertaining to ZrTiO4 and Ce2Zr2O7.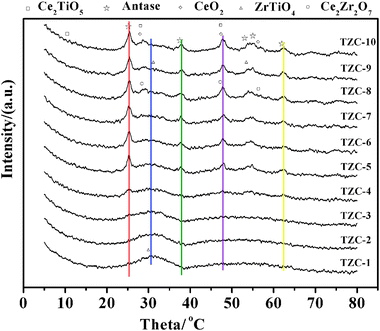 | ||
| Fig. 4 X-ray diffraction patterns of Ti0.8ZrxCe0.2O2(1+x) complex oxide powders. | ||
Furthermore, the introduction of zirconium to titanium oxide causes expansion of unit cell as a result of substitution of the Ti4+ cation by the bigger Zr4+ one (lattice distortion), which favors structural defect formation. However, due to the same ionic valence, the substitution reaction can not destroy the electric neutrality of the unit cell. If the ZrO2 is incorporated into the Ce2O3 according to the reaction:
 | (5) |
Additionally, when the Ti/Zr molar ratio is less than 4, the solid phase structures of the Ti0.8ZrxCe0.2O2(1+x) are almost amorphous as the amount of zirconium additives increases. Conversely, when the Ti/Zr molar ratio is more than 4, the phase coexistence of amorphous and crystal has been found simultaneously as the amount of zirconium additive decreases. Only when the Ti/Zr molar ratio is equal to 4, the solid-state structure of the TZC-4 complex oxide is in the critical phase state, and its weak diffraction peak pertaining to matted crystal of anatase is able to be found. Meanwhile, the TZC-4 catalyst reveals the best catalytic performance in NH3-SCR of NO, indicating that the critical phase state of the TZC-4 complex oxide is very active for NH3-SCR of NO.
3.5. Micro-morphology
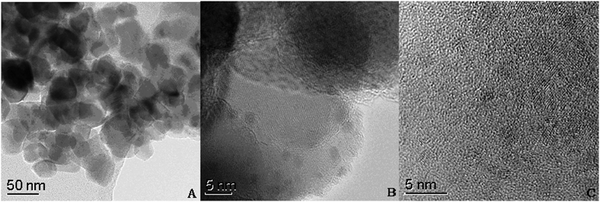
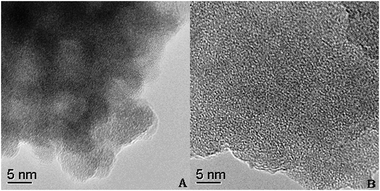
To explore the structural features at the atomic level, HR-TEM studies were performed on the selected representative TC-4 and TZC-4 samples. The TEM global views of the TC-4 and TZC-4 complex oxides calcined at 500 °C are separately shown in Fig. 5(A) and 6(A). For the TC-4 complex oxides, a particle size of 20–35 nm is estimated; as presented in Fig. 5(B), a closer inspection of the image reveals the existence of smaller crystals (15–25 nm) dispersed over an amorphous matrix with different contrasts. The fringes observed in Fig. 5(C) can be attributed to the (111) and (101) crystallographic planes of CeO2 and TiO2 anatase phases, respectively.28 Moreover, it can be observed that some small bidimensional dark spots are dispersed on the interface and surface of the big amorphous particles. This dispersed phase is presented in the form of small amorphous of 2–3 nm average sizes. For the TZC-4 complex oxides as shown in Fig. 6, particle agglomerates are observed, and a particle size of 6–8 nm is estimated. For deeper insight, the analysis of high-resolution images were undertaken to establish the structure of the particles. Fig. 6(B) shows the HR-TEM image of the TZC-4 complex oxide subjected to the same thermal treatment, but no crystallinity can be found in the amorphous region. As shown above, zirconium additives not only refine the particle size but also inhibit the solid phase transformations from amorphous to crystalline. The solid-phase of catalysts is an important affecting factor for NH3-SCR of NO. As is known, performance is determined by material structure. For instance, the amorphous-TiO2 possesses lower catalytic activity at high temperature compared with the anatase-TiO2; even the rutile-TiO2 possesses very low catalytic activity. Herein the zirconium additives inhibit titania phase transformation from amorphous to anatase, so the Zr-added catalysts show lower activity at high temperature, such as 400 °C, in comparison to the TC-4 catalyst. Moreover, the redox properties of the TZC-4 are stronger than those of the TC-4; consequently the stronger redox properties induce more activation of the adsorbed NH3 at high temperature.3.6. Surface acid amount and strength
Total acidity studies are evaluated by a temperature-programmed desorption (TPD) of ammonia. Fig. 7 shows the ammonia desorption profiles of the TC-4 and TZC-4 complex oxides. The ammonia desorption of the TC-4 complex oxide proceeds in two stages: one ammonia desorption centered at 221 °C represents a weak acid position, the other centered at 623 °C represents a strong acid position. The ammonia desorption of the TZC-4 complex oxide also proceeds in two stages: one ammonia desorption centered at 222 °C represents a weak acid position, the other centered at 647 °C represents a strong acid position. As mentioned above, it seems that the acid strengths of the two weak acid sites are quite similar. Moreover, the ammonia desorption profiles at the weak acid sites of the two samples are almost overlapping, indicating that the acid amounts of the two weak acid sites are almost the same.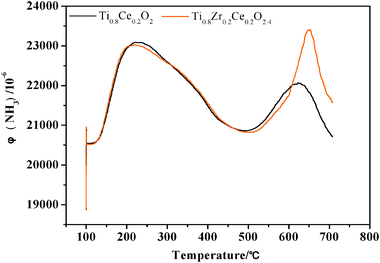 | ||
| Fig. 7 NH3-TPD profiles of the TC-4 and TZC-4 complex oxides. | ||
However, the zirconium additives lead to a shift of the strong acid position towards a higher temperature by about 24 °C, and dramatically increase the peak area of ammonia desorption profile at the strong acid position. These results illustrate that the zirconium additives not only enhance the acid strength but also increase the acid amount of the strong acid site.
3.7. Acid sites
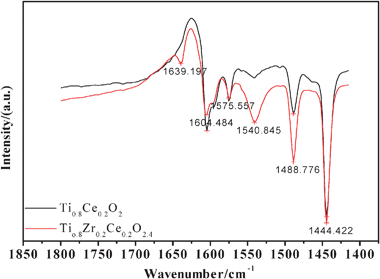
Generally, the acid sites correspond to stronger molecular adsorbed ammonia on Lewis sites or ammonia adsorbed as ammonium ions on Brønsted acidic hydroxy groups.46 In order to discriminate the type of acid sites, the Py-IR studies are performed on the selected representative TC-4 and TZC-4 complex oxides calcined at 500 °C. To the best of our knowledge, when pyridine is adsorbed on the Lewis and Brønsted acid sites of the catalysts, vibration peaks will emerge at 1450 cm−1 and 1540 cm−1, respectively.47,48 These two peaks are able to distinguish the acid site types (Lewis acid site or Brønsted acid site) and relative acid amount of the acid sites on the surface of the catalysts. As shown in Fig. 8, it can be seen that the vibration peaks centered at 1444.422 cm−1 and 1540.845 cm−1 corresponding to Lewis and Brønsted acid sites simultaneously appear, and the peak intensity and peak area present a much bigger acid amount of Lewis acid sites than that of Brønsted sites. Furthermore, the zirconium additives merely lead to a significant enhancement of the Brønsted sites, but have little effect on the acid amount of the Lewis acid sites.The chemical structures of TiO2–CeO2 and TiO2–ZrO2, where the TiO2 is the major component, are shown in Fig. 9(a) and (b). According to Tanabe's hypothesis,49 the charge difference for one bond is +4/8 −4/6 = −1/6, and for all the bonds the valence unit of −1/6 × 8 = −4/3 is excess. In this case, the Brønsted acidity is assumed to appear upon the presence of an excess of the negative charge. In addition, the Py-IR spectra have already confirmed the existence of the Brønsted acid sites. Thereby, the strong acid sites that the zirconium additive enhanced are the Brønsted acid sites rather than Lewis acid sites, and the enhancement of the strong Brønsted acid sites greatly improves the catalytic performance for NH3-SCR of NO.
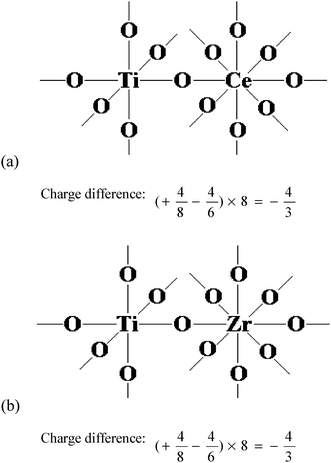 | ||
| Fig. 9 Model structures of TiO2–CeO2 and TiO2–ZrO2. | ||
3.8. Effect of SO2 on catalytic activity
Fig. 10 exhibits the catalytic performance of the TC-4 complex oxide for NH3-SCR of NO both in presence and absence of SO2. For the catalytic performance in the absence of SO2, the TC-4 complex oxide reveals the best catalytic performance in the active temperature window of 200–350 °C, and the highest catalytic activity at 300 °C reaches 99.6%. Moreover, the catalytic activities change in a parabolic trend as the reaction temperature increases. These are already described in the first part of the results and discussion. However, for the catalytic performance in the presence of SO2 under identical reaction conditions, when the molar ratio of SO2/NO is 0.1, the total catalytic activity decreases by about 18%, and the highest catalytic activity at 350 °C is 81.3%. Additionally, the sulfur dioxide atmosphere leads to a shift of the active temperature towards a higher temperature by about 50 °C. Xu et al.19 also reported that SO2 had negative effect on the catalytic activity of Ce/TiO2 catalysts, and the inhibiting effect increased as the SO2 concentration increased. However, the catalytic activity could still be maintained at about 85% in presence of SO2 and water vapor. Overall, a sulfur dioxide atmosphere dramatically decreases the catalytic performance of the TC-4 complex oxide in NH3-SCR of NO.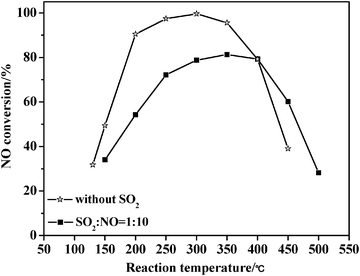 | ||
| Fig. 10 Catalytic activities for NH3-SCR of NO over TC-4 catalysts both in the presence of SO2 and without SO2. | ||
Fig. 11 presents the catalytic performance of the TZC-4 complex oxide for NH3-SCR of NO both in presence and absence of SO2. For the catalytic performance in the absence of SO2, the TZC-4 complex oxide reveals 100% catalytic activity in the active temperature window of 200–350 °C. Moreover, as the reaction temperature increases, the catalytic activities below 200 °C increase and above 350 °C decrease. These results have already been described in the first part of the results and discussion. However, for the catalytic performance in the presence of SO2 under identical reaction conditions, when the molar ratio of SO2/NO is 0.1, the catalytic activities decrease slightly, although the catalytic activities in the active temperature window of 200–350 °C are still more than 90%, and the highest catalytic activity at 300 °C is 99.7%. Additionally, the sulfur dioxide atmosphere improves the catalytic performance in the high temperature range of 350–500 °C. When the SO2/NO molar ratio is 0.2, the total catalytic activities decrease by about 6%; the catalytic activities in the active temperature window of 200–400 °C are still more than 81.3%, and the highest catalytic activity at 300 °C is 96.1%. Moreover, sulfur dioxide atmosphere broadens the high active temperature by about 50–100 °C. When the SO2/NO ratio is 0.5, the total catalytic activities decrease by about 8%, and the highest catalytic activity at 350 °C is 92.3%. Furthermore, sulfur dioxide atmosphere leads to a shift of the active temperature window towards a higher temperature by about 100 °C, and dramatically increase the catalytic performance in the high temperature range of 350–500 °C. As stated above, it seems that the catalytic activities are improved greatly in the high temperature range of 350–500 °C as the concentration of sulfur dioxide atmosphere increases. Therefore, sulfur dioxide atmosphere has less effect on the catalytic performance of the TZC-4 complex oxide in NH3-SCR of NO.
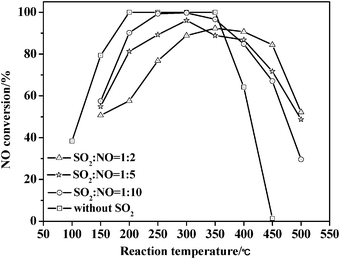 | ||
| Fig. 11 Catalytic activities for NH3-SCR of NO over TZC-4 catalysts both in the presence of SO2 and without SO2. | ||
Comparing catalytic performance between the TC-4 and TZC-4 complex oxides in the presence of SO2, zirconium additives dramatically enhance the anti-sulfur ability of the TZC-4 complex oxide. Furthermore, a sulfur dioxide atmosphere is able to improve the catalytic performance at higher temperatures. Hickey et al.38 also confirmed that zirconium additives enhanced the anti-sulfur ability in NH3-SCR of NO. Hou et al.50 demonstrated that a sulfur dioxide atmosphere improved the NH3-SCR of NO over V2O5/ACF catalysts with the V2O5 loading amount of less than 5%. They found that the mechanism responsible is that the SO2 adsorbed on the surface of the catalysts was oxidized into SO3, and finally formed SO42−. The SO42− possessed a strong adsorption capacity for ammonia, so the sulfur dioxide atmosphere improved NH3-SCR of NO. Nakamoto et al.51 also confirmed the formation of SO42− by infrared and Raman spectroscopy.
3.9. Effect of water vapor on catalytic activity
In previous work, studies on the effect of water vapor on the catalytic performance are mostly carried out in the presence of low H2O concentrations of 3–10 vol%,19 and it has already been found that the effect is mostly reversible.52 However, sometimes a high concentration of water vapor may be appear under some specific unstable industrial conditions, which will have a major influence on the catalyst, especially for the commercial catalyst, V2O5(WO3,MoO3)/TiO2. Herein, we study the effect of water vapor under extreme conditions. Fig. 12 presents the catalytic performances of the TC-4 and TZC-4 complex oxides for NH3-SCR of NO both in the absence and presence of a high concentration of water vapor (50 vol%). The catalytic performances in the absence of water vapor have already been depicted in the first part of the results and discussion. For catalytic performance in the presence of 50 vol% water vapor under identical reaction conditions, the catalytic activities of both samples decrease sharply. Huang et al.53 also found that H2O inhibited the SCR reaction between the NH3 on the Lewis acid sites and NO, and the inhibition effect increased with increasing H2O content but the inhibition effect was reversible and H2O didn't poison the V2O5/AC catalyst. The highest catalytic activities of the TC-4 and TZC-4 at 350 °C can still maintain 67.3% and 65.4%, respectively, indicating that the negative effect of water vapor on the catalytic performance is limited, even under the extreme conditions of 50 vol% water vapor. The catalyst can still adsorb excess NH3 in presence of water vapor, and the negative effect mainly results from the competitive adsorption of water vapor and NO.54 The Langmuir–Hinshelwood mechanism emphasizes the premise that NH3 and NO simultaneously adsorb on the surface of the catalysts,55 while the Eley–Rideal mechanism emphasizes that NH3 firstly adsorb on the surface active sites of the catalysts, and then NO adsorb on the adsorbed NH3.56 Hence the decreased NO adsorption on the catalysts will dramatically affect the Langmuir–Hinshelwood mechanism. However, the high conversion of excess NH3 to NH4+ provides a big polarity that can be used for selective adsorption of NO in presence of water vapor. Consequently, the negative effect of the competitive adsorption on the Langmuir–Hinshelwood mechanism is greater than that of the Eley–Rideal mechanism. In other words, the negative effect of water vapor mainly results from the Langmuir–Hinshelwood mechanism, and the preserved catalytic activity is mainly maintained by the Eley–Rideal mechanism. Both of the two SCR mechanisms simultaneously exist in NH3-SCR of NO over the TZC-4 and TC-4 catalysts.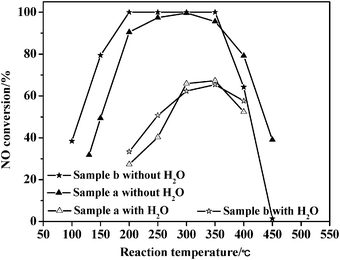 | ||
| Fig. 12 Catalytic activities of the catalysts for NH3-SCR of NO both in the presence and absence of water vapor. (a) TC-4; (b) TZC-4. | ||
Additionally, water vapor leads to a shift of the active temperature window towards a higher temperature by about 100 °C. Moreover, the TZC-4 complex oxide possesses higher catalytic activity at 400 °C than that of the TC-4 complex oxide; the changing trend is exactly converse to the result of the fresh catalysts, indicating that the TZC-4 complex oxide possesses stronger anti-influence of water vapor at higher temperature than that of the TC-4 complex oxide.
3.10. FT-IR analysis
The FT-IR spectra of the fresh samples without H2O and SO2 in Fig. 13 and 14 are from before the deNOx reaction, and the spectra of the samples with H2O or SO2 are from after the deNOx reaction.Fig. 13 shows the FT-IR spectra of the TC-4 complex oxide before and after deNOx reaction. As shown in the IR spectra, the spectral bands of 3427–3444 cm−1 and 1624–1630 cm−1 correspond to vibrational spectra of physically adsorbed water. Kijlstra et al.54 found that water vapor competed with NO and NH3 in physical adsorption on the surface of the catalysts. Additionally, the catalyst surface can also adsorb excess NH3 in presence of water vapor, so the lower adsorption of NO is the main reason that induces the decrease in catalytic activity. The wavenumber of 1124 cm−1 corresponds to a typical vibrational spectrum of chemically adsorbed SO2 on the surface of the TC-4 complex oxide that reacted in presence of SO2 (SO2/NO molar ratio = 0.1).57,58 Huang et al.53 reported that the wavenumber of 1400 cm−1 corresponds to typical vibrational spectrum of NH4+ adsorbed on the Brønsted acid sites, so the spectral bands of 1402–1404 cm−1 represent the NH4+ that adsorbed on the Brønsted acid sites. It further illustrates that a certain amount of SO2 and water vapor can improve ammonia adsorption on the Brønsted acid sites of the TC-4 complex oxides.
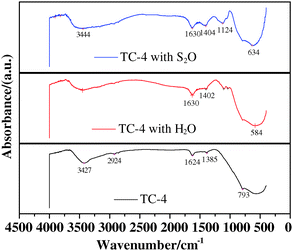 | ||
| Fig. 13 FT-IR spectra of TC-4 complex oxides. | ||
Fig. 14 shows the FT-IR spectra of the TZC-4 complex oxide before and after deNOx reaction. As shown the IR spectra, the spectral bands of 3425–3429 cm−1 and 1620–1628 cm−1 correspond to physically adsorbed water. The wavenumber of 1124 cm−1 also corresponds to a typical vibrational spectrum of chemically adsorbed SO2 on the surface of the TZC-4 complex oxide that reacted in presence of SO2 (SO2/NO molar ratio = 0.5). Moreover, the peak intensity is stronger than that of the TC-4 complex oxide, suggesting that the TZC-4 complex oxide possesses a higher concentration of sulfate oxidized from SO2 than that of the TC-4 complex oxide. In view of the fact that SO42− is able to enhance the acid sites at high temperature, as reported in the literature,59,60 the catalytic performance of the TZC-4 complex oxide is improved.
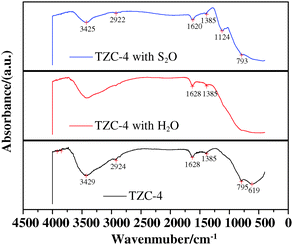 | ||
| Fig. 14 FT-IR spectra of TZC-4 complex oxides. | ||
4. Conclusions
In summary, the zirconium additives not only improve the catalytic activity but also increase the N2 selectivity of the Ti0.8ZrxCe0.2O2(1+x) complex oxides for NH3-SCR of NO. The representative Ti0.8Zr0.2Ce0.2O2.4 complex oxide is promising as a potential catalyst for removing NOx and displays the best catalytic performance and highest stability in the active temperature window of 200–350 °C.The promotional effect of zirconium additives on the catalytic performance in NH3-SCR of NO is not induced by the variation of specific surface area, but caused by the following reasons: (a) the zirconium additives enhance the OSC of the Ti0.8Zr0.2Ce0.2O2.4 complex oxide, refine the particle size and inhibit the titania phase transformation from amorphous to anatase. The critical phase state of Ti0.8Zr0.2Ce0.2O2.4 is very active for NH3-SCR of NO; (b) the zirconium additives dramatically enhance the acidity of the strong acid sites, especially enhancing the acid amount of the Brønsted acid site.
The zirconium additives not only significantly improve the anti-sulfur ability but also enhance the anti-influence of water vapor at above 400 °C. The enhancement mechanism of anti-sulfur ability is that SO2 is firstly oxidized into SO3, and then forms SO42−, which is able to enhance the acid sites at high temperatures. The effect of water vapor suggests that Langmuir–Hinshelwood and Eley–Rideal mechanisms simultaneously exist in NH3-SCR of NO over the TZC-4 and TC-4 catalysts.
Acknowledgements
This work was financially supported by the National Natural Science Foundation of China (Nos. 21106071 and 50872052), National High-Tech Research and Development Program of China (863 Program, No. 2009AA05Z313), and the Research Subject of Environmental Protection Department of Jiangsu Province of China (No. 201016). This work was also financially supported by the New Teachers' Fund for Doctor Stations Sponsored by the Ministry of Education of China (No. 20113221120004).Notes and references
- Y. G. Wang, P. He and H. S. Zhou, Energy Environ. Sci., 2011, 4, 805–817 RSC
.
- P. Forzatti, L. Lietti and I. Nova, Energy Environ. Sci., 2008, 1, 236–247 RSC
.
- G. Busca, L. Lietti, G. Ramis and F. Berti, Appl. Catal. B–Environ., 1998, 18, 1–36 CrossRef CAS
.
-
Z. Q. Tong, Air pollution control engineering, Machinery Industry Press, Beijing, 2006 Search PubMed
.
- S. Roy, M. S. Hegde and G. Madras, Appl. Energy, 2009, 86, 2283–2297 CrossRef CAS
.
- S. M. Zhu, W. F. Li, Y. W. Chen and S. B. Shen, Environ. Pollution Control, 2005, 27, 699–703 Search PubMed
.
- D. Nicosia, I. Czekaj and O. Krocher, Appl. Catal. B–Environ., 2008, 77, 228–236 CrossRef CAS
.
- K. Asa, C. Andersson, M. Ase, D. Eskilsson and S. G. Jaras, Appl. Catal. B–Environ., 2007, 69, 240–251 Search PubMed
.
- P. Forzatti, Appl. Catal. A–Gen., 2001, 222, 221–236 CrossRef CAS
.
- L. Chmielarz, P. Kuśtrowski, R. Dziembaj, P. Cool and E. F. Vansant, Appl. Catal. B–Environ., 2006, 62, 369–380 CrossRef CAS
.
- C. He, M. Paulus, W. Chu, J. Find, J. A. Nickl and K. Koehler, Catal. Today, 2008, 131, 305–313 Search PubMed
.
- S. Bennici, A. Gervasini, N. Ravasio and F. Zaccheria, J. Phys. Chem. B, 2003, 107, 5168–5176 Search PubMed
.
- H. He, C. Zhang and Y. Yu, Catal. Today, 2004, 90, 191–197 Search PubMed
.
- A. M. Chen, Y. H. Zhang and C. H. Hu, Chinese J. Ind. Hygiene Occupational Diseases, 2006, 24, 287–288 Search PubMed
.
- Z. X. Wang, China Power Enterprise Management, 2009, 16–19 Search PubMed
.
- Y. S. Shen, S. M. Zhu, T. Qiu and S. B. Shen, Catal. Commun., 2009, 11, 20–23 Search PubMed
.
- B. X. Shen, B. B. Guo, Z. L. Shi, C. F. Wu and C. Liang, J. Fuel Chem. Tech., 2007, 35, 125–128 Search PubMed
.
- S. Kawi, Y. P. Tang, K. Hidajat and L. E. Yu, J. Metastab. Nanocryst. Mater., 2005, 23, 95–98 Search PubMed
.
- W. Q. Xu, Y. B. Yu, C. B. Zhang and H. He, Catal. Commun., 2008, 9, 1453–1457 CrossRef CAS
.
- S. J. Schmieg and D. N. Belton, Appl. Catal. B–Environ., 1995, 6, 127–144 CrossRef CAS
.
- B. M. Reddy, A. Khan, Y. Yamada, T. Kobayashi, S. Loridant and J. C. Volta, J. Phys. Chem. B, 2003, 107, 11475–11484 Search PubMed
.
- B. M. Reddy and A. Khan, Catal. Surv. Asia, 2005, 9, 155–171 CrossRef CAS
.
- W. Liu and M. Flytzani-Stephanopoulos, J. Catal., 1995, 153, 304–316 CrossRef CAS
.
- B. M. Reddy and A. Khan, J. Phys. Chem. B, 2003, 107, 5162–5167 CrossRef CAS
.
- B. M. Reddy, P. Lakshmanan and A. Khan, J. Phys. Chem. B, 2005, 109, 1781–1787 Search PubMed
.
- B. M. Reddy, P. Lakshmanan and A. Khan, J. Phys.
Chem. B, 2004, 108, 16855–16863 Search PubMed
.
- B. M. Reddy and A. Khan, Langmuir, 2003, 19, 3025–3030 CrossRef CAS
.
- B. M. Reddy, A. Khan, P. Lakshmanan, M. Aouine, S. Loridant and J. C. Volta, J. Phys. Chem. B, 2005, 109, 3355–3363 CrossRef CAS
.
- X. Gao, Y. Jiang, Y. Zhong, Z. Y. Luo and K. F. Cen, J. Hazard. Mater., 2010, 174, 734–739 Search PubMed
.
- Y. S. Shen, S. B. Ni and S. M. Zhu, Synergetic catalysis of titania and ceria for selective reduction of NO, J. Rare Earth., 2011 Search PubMed
, under review.
- D. S. Mao, G. Z. Lu and Q. L. Chen, Ind. Catal., 2005, 3, 1–6 Search PubMed
.
- B. Neppolian, Q. L. Wang, H. Yamashita and H. Choi, Appl. Catal. A–Gen., 2007, 33, 264–271 Search PubMed
.
- Y. Nagai, T. Yamamoto, T. Tanaka, S. Yoshida, T. Nonaka, T. Okamoto, A. Suda and M. Sugiera, Catal. Today, 2002, 74, 225–234 CrossRef CAS
.
- P. Fornasiero, R. Di Monte, G. Ranga Rao, J. Kašpar, S. Meriani, A. Trovarelli and M. Graziani, J. Catal., 1995, 151, 168–177 CrossRef CAS
.
- G. Ranga Rao, P. Fornasiero, R. Di Monte, J. Kašpar, G. Valic, G. Balducci, S. Meriani, G. Gubitosa, A. Cremona and M. Graziani, J. Catal., 1996, 162, 1–9 CrossRef
.
- J. Kaspar, P. Fornasiero and M. Graziani, Catal. Today, 1999, 50, 285–298 CrossRef CAS
.
- A. Trovarelli, M. Boaro, E. Rocchini, C. Leitenburg and G. Dolcetti, J. Alloys Compd., 2001, 323–324, 584–591 CrossRef CAS
.
- N. Hickey, P. Fornasiero, J. Kašpar, M. Graziani, G. Martra, S. Coluccia, S. Biella, L. Prati and M. Rossi, J. Catal., 2002, 209, 271–274 CrossRef
.
- S. Suarez, S. M. Jung, P. Avila, P. Grange and J. Blanco, Catal. Today, 2002, 75, 331–338 Search PubMed
.
- S. M. Jung and P. Grange, Appl. Catal. B–Environ., 2000, 27, L11–L16 CrossRef CAS
.
- M. Adamowska, A. Krzton, M. Najbar, P. Da Costa and G. Djega-Mariadassou, Catal. Today, 2008, 137, 288–291 CrossRef CAS
.
- A. Trovarelli, C. de Leitenburg and G. Dolcetti, Chem. Tech., 1997, 27, 32–37 CAS
.
-
P. W. Lu, The Scientific Basics of Inorgnic Materials, Wuhan University of Science and Technology Publishing House, Wuhan, 2nd edn, 2003 Search PubMed
.
- Z. G. Liu, R. X. Zhou and X. M. Zheng, Catal. Commun., 2008, 9, 2183–2186 Search PubMed
.
- W. P. Dow and T. J. Huang, J. Catal., 1996, 160, 171–182 CrossRef CAS
.
- A. L. Kustov, M. Yu. Kustova, R. Fehrmann and P. Simonsen, Appl. Catal., B, 2005, 58, 97–104 CrossRef CAS
.
- G. H. Jing, J. H. Li, D. Yang and J. M. Hao, Appl. Catal. B–Environ., 2009, 91, 123–134 Search PubMed
.
- J. A. Lercher, C. Grundling and G. EderMirth, Catal. Today, 1996, 27, 353–376 CrossRef CAS
.
- K. Tanabe, T. Sumiyoshi, K. Shibata, T. Kiyoura and J. Kitagawa, Bull. Chem. Soc. Jpn., 1974, 47, 1064–1066 CAS
.
- Y. Q. Hou, Z. G. Huang and S. J. Guo, Catal. Commun., 2009, 10, 1538–1541 Search PubMed
.
-
K. Nakamoto, Infrared and Raman Spectra of Inorganic and Coordination Compounds, Wiley, New York, 4th edn, 1986 Search PubMed
.
- L. Chmielarz, R. Dziembaj, T. Łojewski, A. Wegrzyn, T. Grzybek, J. Klinik and D. Olszewska, Solid State Ionics, 2001, 141–142, 715–719 Search PubMed
.
- Z. G. Huang, Z. Y. Liu, X. L. Zhang and Q. Y. Liu, Appl. Catal. B–Environ., 2006, 63, 260–265 Search PubMed
.
- W. S. Kijlstra, J. C. M. L. Daamen, J. M. van de Graaf, B. van der Linden, E. K. Poels and A. Bliek, Appl. Catal., B, 1996, 7, 337–357 Search PubMed
.
- M. Koebel and M. Elsener, Chem. Eng. Sci., 1998, 53, 657–669 CrossRef CAS
.
- A. Buzanowskim and R. T. Yang, Ind. Eng. Chem. Res., 1990, 29, 2074–2078 Search PubMed
.
- W. S. Kijlstra, M. Biervliet, E. K. Poels and A. Bliek, Appl. Catal. B–Environ., 1998, 16, 327–337 CrossRef
.
- A. Datta, R. G. Cavell, R. W. Tower and Z. M. George, J. Phys. Chem., 1985, 89, 443–449 CrossRef CAS
.
- T. Yamaguchi, Appl. Catal., 1990, 61, 1–25 Search PubMed
.
- J. R. Sohn and H. J. Jang, J. Catal., 1992, 136, 267–270 Search PubMed
.
| This journal is © The Royal Society of Chemistry 2012 |

