Ni2+-doped ZnxCd1−xS photocatalysts from single-source precursors for efficient solar hydrogen production under visible light irradiation†
Received
8th August 2011
, Accepted 28th November 2011
First published on 21st December 2011
Abstract
Ni2+-doped photocatalysts Ni(y)-ZnxCd1−xS (where 0 ≤ x ≤ 0.80, 0% ≤ y ≤ 8%) were prepared by a two-step route, which consisted of a first precipitation of single-source precursors and a subsequent solvothermal treatment of the precursors in ethylenediamine. Structural, morphological and optical properties of the as-prepared samples were characterized by XRD, UV-vis DRS, FESEM, TEM, N2 physisorption, ICP-AES and XPS techniques. The photocatalytic activity was evaluated for hydrogen evolution from the aqueous solution containing sodium sulfide and sodium sulfite under visible light irradiation. All Ni2+-doped samples exhibit enhanced photocatalytic activity compared with the non-doped sample. Sample Ni(4%)-Zn0.4Cd0.6S gives the highest hydrogen evolution rate of 941 μmol h−1 under the optimized reaction conditions without any co-catalysts, with a corresponding quantum efficiency of 22.8% at 420 nm which is much higher compared to those of previously reported Ni2+-doped metal sulfide photocatalysts. It is suggested that good crystallinity, suitable band structure and the accommodation sites introduced by Ni2+ doping for charge carrier separation together contribute to the high activity of such photocatalysts for hydrogen evolution.
Introduction
Hydrogen production from photo-induced water splitting has received increasing attention because of its potential in simultaneously solving energy and environmental problems. In order to utilize the abundant solar energy, the development of visible-light active photocatalysts is of great importance. To date, many semiconductor photocatalyst systems have been reported to be active under visible light. Besides those semiconductors with intrinsic narrow band gaps like CdS1–6 and C3N4,7 visible light response has been often achieved by forming solid solutions,8–14 foreign element doping,15–20 or adopting both strategies.21–26 Compared to the O 2p orbital of metal oxides, the S 3p orbital of metal sulfides is located at a higher valence band maximum level, which is beneficial for band gap narrowing and hence visible light response.20 On the other hand, the conduction band minimum levels of metal sulfides especially of ZnS and CdS are more negative than those of metal oxides. As a result, the commonly used expensive noble metal co-catalysts required for metal oxide photocatalysts for enhanced charge separation are not always necessary for metal sulfide photocatalysts. Efficient photocatalyst systems for hydrogen evolution have been obtained using some sulfide photocatalysts without co-catalysts or using earth abundant elements as co-catalysts, such as NiS/CdS,4 MoS2/CdS,5 ZnS–In2S3–Ag2S.14
Among the metal sulfides investigated, CdS has excellent visible light absorption ability and ZnS has a high conduction band minimum position. The solid solutions of CdS and ZnS as photocatalysts for water splitting have been studied intensively by many research groups including ours.9–11,22–24,26–32 The Cd1−xZnxS solid solutions have been demonstrated as efficient photocatalysts even without co-catalysts for reduction of water to hydrogen in the presence of sacrificial electron donors. It was found that doping of foreign elements such as Cu2+ and Ni2+ can further enhance the photocatalytic activities by forming the dopant impurity levels for better charge separation.21–26,33 For example, in our previous study, Cu2+-doped (Zn0.95Cu0.05)xCd1−xS solid solutions were prepared by a coprecipitation method.22 Much higher activity was obtained compared with those from CdS, ZnS or Cd1−xZnxS counterparts. Guo and co-workers reported the synthesis of Ni2+-doped Cd1−xZnxS photocatalysts by a hydrothermal method and better activities were obtained after doping with Ni2+.25,26
Based on previous studies, it is clearly noted that the properties and photocatalytic activities of Cd1−xZnxS are highly dependent on their synthesis methods and preparation conditions. So far, several synthetic routes have been used to produce Cd1−xZnxS photocatalysts, such as coprecipitation,22 solvothermal synthesis,10 H2S gas thermal treatment,29 precipitation-hydrothermal synthesis,32etc. It is not a simple task to achieve optimized photocatalytic activities especially when doped solid solutions were investigated. Many contributing factors, such as homogeneity of the solid solutions, the doping level and dopant position, the morphological feature, surface geometry, etc., can be simultaneously influenced by the synthesis routes and conditions. In this study, we adopted a single-source precursor route to synthesize Ni2+-doped ZnxCd1−xS photocatalysts by first precipitating all the three metal cations into a single precursor by diethyldithiocarbamate (DDTC). Although the fabrication of Cd1−xZnxS (x = 0–0.3) by this method was reported earlier, no photocatalytic activities of the resulting products have been studied.34 Furthermore, the synthesis of Ni2+-doped ZnxCd1−xS photocatalysts by this method is for the first time reported here. It is demonstrated that Ni2+ doping can greatly enhance the photocatalytic activity and the photocatalysts prepared by this simple method are highly efficient for hydrogen evolution from water under visible light.
Experimental
Synthesis of Ni2+-doped ZnxCd1−xS samples
All the chemicals used were of analytical grade and were used without further purification. The synthesis procedure was according to that reported previously34 with slight modification. Firstly, the single-source precursor was prepared by dropwise addition of 150 mL of a sodium diethyldithiocarbamate (NaS2CNEt2, Alfa Aesar, 99%) aqueous solution (0.2 M) to 75 mL of an aqueous solution containing nickel acetate (Ni(Ac)2, 99.9%, Alfa Aesar), zinc acetate (Zn(Ac)2·2H2O, >99.0%, Alfa Aesar) and cadmium acetate (Cd(Ac)2·2H2O, >99.0%, Kanto Chemical) with a certain molar ratio of metal ions and a total metal concentration of 0.2 M. After stirring for 24 h at room temperature, the resulting light green precipitate was collected by filtration, washed with deionized water for a few times and dried in an oven at 60 °C overnight. Subsequently, 2.0 g of the as-prepared single-source precursor was added into a 45 mL PTFE-lined stainless steel autoclave containing 30 mL of ethylenediamine (EDA, >99.5%, Alfa Aesar). The autoclave was kept in an oven at 180 °C for 24 h. After cooling to room temperature naturally, the obtained precipitate was centrifuged, washed with ethanol and deionized water for several times and then dried at 60 °C overnight. The resultant samples were named as Ni(y)-ZnxCd1−xS. Samples without Ni2+ were also prepared by the same procedure. The metal ratios in the precursor solutions for all the samples prepared can be found in Table 1. A control sample with a composition of Ni(1.56%)-Zn0.36Cd0.64S was prepared by a co-precipitation method according to our previously reported procedure.22 Nickel nitrate (Ni(NO3)2·6H2O, >99.0%, Acros Organics), zinc nitrate (Zn(NO3)2·6H2O, >99.0%, Acros Organics), cadmium nitrate (Cd(NO3)2·4H2O, >99.0%, Acros Organics) and sodium sulfide (Na2S·9H2O, extra pure, Acros Organics) were used as metal precursors and sulfur source, respectively.
Table 1 Summary of the composition, properties and photocatalytic activities of Ni(y)-ZnxCd1−xS photocatalysts prepared by the single-source precursor method
| Sample |
Atomic ratio of Ni2+![[thin space (1/6-em)]](https://www.rsc.org/images/entities/char_2009.gif) : :![[thin space (1/6-em)]](https://www.rsc.org/images/entities/char_2009.gif) Zn2+ Zn2+![[thin space (1/6-em)]](https://www.rsc.org/images/entities/char_2009.gif) : :![[thin space (1/6-em)]](https://www.rsc.org/images/entities/char_2009.gif) Cd2+ Cd2+ |
Band gapb/eV |
Surface area/m2 g−1 |
H2 evolution ratec/μmol h−1 |
| Precursor |
Photocatalysta |
|
Calculated from ICP-AES results.
The band gap values were calculated based on the onset of the absorbance from UV-vis DRS.
Reactions were conducted using a 300 W Xenon lamp with a cut-off filter (λ ≥ 420 nm); 50 mg of the catalyst was dispersed in a 100 mL aqueous solution containing 0.1 M Na2SO3 and 0.1 M Na2S, the average H2 production rate was calculated based on the data from the 2nd to 4th hour.
|
| CdS |
— |
— |
2.39 |
29.8 |
3 |
| Zn0.3Cd0.7S |
0![[thin space (1/6-em)]](https://www.rsc.org/images/entities/char_2009.gif) : :![[thin space (1/6-em)]](https://www.rsc.org/images/entities/char_2009.gif) 30 30![[thin space (1/6-em)]](https://www.rsc.org/images/entities/char_2009.gif) : :![[thin space (1/6-em)]](https://www.rsc.org/images/entities/char_2009.gif) 70 70 |
0![[thin space (1/6-em)]](https://www.rsc.org/images/entities/char_2009.gif) : :![[thin space (1/6-em)]](https://www.rsc.org/images/entities/char_2009.gif) 23.4 23.4![[thin space (1/6-em)]](https://www.rsc.org/images/entities/char_2009.gif) : :![[thin space (1/6-em)]](https://www.rsc.org/images/entities/char_2009.gif) 76.6 76.6 |
2.40 |
34.2 |
105 |
| Zn0.4Cd0.6S |
0![[thin space (1/6-em)]](https://www.rsc.org/images/entities/char_2009.gif) : :![[thin space (1/6-em)]](https://www.rsc.org/images/entities/char_2009.gif) 40 40![[thin space (1/6-em)]](https://www.rsc.org/images/entities/char_2009.gif) : :![[thin space (1/6-em)]](https://www.rsc.org/images/entities/char_2009.gif) 60 60 |
0![[thin space (1/6-em)]](https://www.rsc.org/images/entities/char_2009.gif) : :![[thin space (1/6-em)]](https://www.rsc.org/images/entities/char_2009.gif) 31.4 31.4![[thin space (1/6-em)]](https://www.rsc.org/images/entities/char_2009.gif) : :![[thin space (1/6-em)]](https://www.rsc.org/images/entities/char_2009.gif) 68.6 68.6 |
2.43 |
35.7 |
402 |
| Zn0.5Cd0.5S |
0![[thin space (1/6-em)]](https://www.rsc.org/images/entities/char_2009.gif) : :![[thin space (1/6-em)]](https://www.rsc.org/images/entities/char_2009.gif) 50 50![[thin space (1/6-em)]](https://www.rsc.org/images/entities/char_2009.gif) : :![[thin space (1/6-em)]](https://www.rsc.org/images/entities/char_2009.gif) 50 50 |
0![[thin space (1/6-em)]](https://www.rsc.org/images/entities/char_2009.gif) : :![[thin space (1/6-em)]](https://www.rsc.org/images/entities/char_2009.gif) 44.8 44.8![[thin space (1/6-em)]](https://www.rsc.org/images/entities/char_2009.gif) : :![[thin space (1/6-em)]](https://www.rsc.org/images/entities/char_2009.gif) 55.2 55.2 |
2.45 |
35.7 |
245 |
| Zn0.6Cd0.4S |
0![[thin space (1/6-em)]](https://www.rsc.org/images/entities/char_2009.gif) : :![[thin space (1/6-em)]](https://www.rsc.org/images/entities/char_2009.gif) 60 60![[thin space (1/6-em)]](https://www.rsc.org/images/entities/char_2009.gif) : :![[thin space (1/6-em)]](https://www.rsc.org/images/entities/char_2009.gif) 40 40 |
0![[thin space (1/6-em)]](https://www.rsc.org/images/entities/char_2009.gif) : :![[thin space (1/6-em)]](https://www.rsc.org/images/entities/char_2009.gif) 57.3 57.3![[thin space (1/6-em)]](https://www.rsc.org/images/entities/char_2009.gif) : :![[thin space (1/6-em)]](https://www.rsc.org/images/entities/char_2009.gif) 42.7 42.7 |
2.47 |
37.3 |
202 |
| Zn0.8Cd0.2S |
0![[thin space (1/6-em)]](https://www.rsc.org/images/entities/char_2009.gif) : :![[thin space (1/6-em)]](https://www.rsc.org/images/entities/char_2009.gif) 80 80![[thin space (1/6-em)]](https://www.rsc.org/images/entities/char_2009.gif) : :![[thin space (1/6-em)]](https://www.rsc.org/images/entities/char_2009.gif) 20 20 |
0![[thin space (1/6-em)]](https://www.rsc.org/images/entities/char_2009.gif) : :![[thin space (1/6-em)]](https://www.rsc.org/images/entities/char_2009.gif) 79.6 79.6![[thin space (1/6-em)]](https://www.rsc.org/images/entities/char_2009.gif) : :![[thin space (1/6-em)]](https://www.rsc.org/images/entities/char_2009.gif) 20.4 20.4 |
2.49 |
11.9 |
145 |
| Ni(0.5%)-Zn0.4Cd0.6S |
0.5![[thin space (1/6-em)]](https://www.rsc.org/images/entities/char_2009.gif) : :![[thin space (1/6-em)]](https://www.rsc.org/images/entities/char_2009.gif) 40 40![[thin space (1/6-em)]](https://www.rsc.org/images/entities/char_2009.gif) : :![[thin space (1/6-em)]](https://www.rsc.org/images/entities/char_2009.gif) 60 60 |
0.005![[thin space (1/6-em)]](https://www.rsc.org/images/entities/char_2009.gif) : :![[thin space (1/6-em)]](https://www.rsc.org/images/entities/char_2009.gif) 33.0 33.0![[thin space (1/6-em)]](https://www.rsc.org/images/entities/char_2009.gif) : :![[thin space (1/6-em)]](https://www.rsc.org/images/entities/char_2009.gif) 67.0 67.0 |
2.44 |
34.3 |
543 |
| Ni(2%)-Zn0.4Cd0.6S |
2![[thin space (1/6-em)]](https://www.rsc.org/images/entities/char_2009.gif) : :![[thin space (1/6-em)]](https://www.rsc.org/images/entities/char_2009.gif) 40 40![[thin space (1/6-em)]](https://www.rsc.org/images/entities/char_2009.gif) : :![[thin space (1/6-em)]](https://www.rsc.org/images/entities/char_2009.gif) 60 60 |
0.59![[thin space (1/6-em)]](https://www.rsc.org/images/entities/char_2009.gif) : :![[thin space (1/6-em)]](https://www.rsc.org/images/entities/char_2009.gif) 36.5 36.5![[thin space (1/6-em)]](https://www.rsc.org/images/entities/char_2009.gif) : :![[thin space (1/6-em)]](https://www.rsc.org/images/entities/char_2009.gif) 63.5 63.5 |
2.45 |
32.1 |
551 |
| Ni(3%)-Zn0.4Cd0.6S |
3![[thin space (1/6-em)]](https://www.rsc.org/images/entities/char_2009.gif) : :![[thin space (1/6-em)]](https://www.rsc.org/images/entities/char_2009.gif) 40 40![[thin space (1/6-em)]](https://www.rsc.org/images/entities/char_2009.gif) : :![[thin space (1/6-em)]](https://www.rsc.org/images/entities/char_2009.gif) 60 60 |
1.26![[thin space (1/6-em)]](https://www.rsc.org/images/entities/char_2009.gif) : :![[thin space (1/6-em)]](https://www.rsc.org/images/entities/char_2009.gif) 35.6 35.6![[thin space (1/6-em)]](https://www.rsc.org/images/entities/char_2009.gif) : :![[thin space (1/6-em)]](https://www.rsc.org/images/entities/char_2009.gif) 64.4 64.4 |
2.44 |
33.6 |
579 |
| Ni(4%)-Zn0.4Cd0.6S |
4![[thin space (1/6-em)]](https://www.rsc.org/images/entities/char_2009.gif) : :![[thin space (1/6-em)]](https://www.rsc.org/images/entities/char_2009.gif) 40 40![[thin space (1/6-em)]](https://www.rsc.org/images/entities/char_2009.gif) : :![[thin space (1/6-em)]](https://www.rsc.org/images/entities/char_2009.gif) 60 60 |
1.56![[thin space (1/6-em)]](https://www.rsc.org/images/entities/char_2009.gif) : :![[thin space (1/6-em)]](https://www.rsc.org/images/entities/char_2009.gif) 36.0 36.0![[thin space (1/6-em)]](https://www.rsc.org/images/entities/char_2009.gif) : :![[thin space (1/6-em)]](https://www.rsc.org/images/entities/char_2009.gif) 64.0 64.0 |
2.44 |
29.5 |
746 |
| Ni(5%)-Zn0.4Cd0.6S |
5![[thin space (1/6-em)]](https://www.rsc.org/images/entities/char_2009.gif) : :![[thin space (1/6-em)]](https://www.rsc.org/images/entities/char_2009.gif) 40 40![[thin space (1/6-em)]](https://www.rsc.org/images/entities/char_2009.gif) : :![[thin space (1/6-em)]](https://www.rsc.org/images/entities/char_2009.gif) 60 60 |
2.14![[thin space (1/6-em)]](https://www.rsc.org/images/entities/char_2009.gif) : :![[thin space (1/6-em)]](https://www.rsc.org/images/entities/char_2009.gif) 36.7 36.7![[thin space (1/6-em)]](https://www.rsc.org/images/entities/char_2009.gif) : :![[thin space (1/6-em)]](https://www.rsc.org/images/entities/char_2009.gif) 63.3 63.3 |
2.45 |
30.7 |
680 |
| Ni(6%)-Zn0.4Cd0.6S |
6![[thin space (1/6-em)]](https://www.rsc.org/images/entities/char_2009.gif) : :![[thin space (1/6-em)]](https://www.rsc.org/images/entities/char_2009.gif) 40 40![[thin space (1/6-em)]](https://www.rsc.org/images/entities/char_2009.gif) : :![[thin space (1/6-em)]](https://www.rsc.org/images/entities/char_2009.gif) 60 60 |
2.25![[thin space (1/6-em)]](https://www.rsc.org/images/entities/char_2009.gif) : :![[thin space (1/6-em)]](https://www.rsc.org/images/entities/char_2009.gif) 35.9 35.9![[thin space (1/6-em)]](https://www.rsc.org/images/entities/char_2009.gif) : :![[thin space (1/6-em)]](https://www.rsc.org/images/entities/char_2009.gif) 64.1 64.1 |
2.45 |
34.2 |
685 |
| Ni(8%)-Zn0.4Cd0.6S |
8![[thin space (1/6-em)]](https://www.rsc.org/images/entities/char_2009.gif) : :![[thin space (1/6-em)]](https://www.rsc.org/images/entities/char_2009.gif) 40 40![[thin space (1/6-em)]](https://www.rsc.org/images/entities/char_2009.gif) : :![[thin space (1/6-em)]](https://www.rsc.org/images/entities/char_2009.gif) 60 60 |
2.34![[thin space (1/6-em)]](https://www.rsc.org/images/entities/char_2009.gif) : :![[thin space (1/6-em)]](https://www.rsc.org/images/entities/char_2009.gif) 36.0 36.0![[thin space (1/6-em)]](https://www.rsc.org/images/entities/char_2009.gif) : :![[thin space (1/6-em)]](https://www.rsc.org/images/entities/char_2009.gif) 64.0 64.0 |
2.45 |
33.6 |
678 |
Characterization
Powder X-ray diffraction (XRD) patterns were recorded on an X-ray diffractometer (Bruker AXS D8, Cu Kα, λ = 1.5406 Å, 40 kV and 20 mA) in the range of 15°–75°. The morphologies of the samples were observed on a field emission scanning electron microscope (FESEM, JEOL JSM 6700F) and transmission electron microscope (TEM, JEOL 3010). The ultraviolet-visible diffuse reflectance spectrum (UV-vis DRS) was obtained on a UV-visible spectrophotometer (UV-2450, Shimadzu). X-Ray photoelectron spectroscopy (XPS) analysis was conducted on an Axis Ultra spectrometer (Kratos Analytical) using a monochromated Al Kα X-ray source (1486.7 eV) operating at 15 kV. The metal compositions of the samples were determined by inductively coupled plasma atomic emission spectroscopy (ICP-AES) on a Perkin Elmer ICP Optima 2000DV machine. Nitrogen adsorption–desorption measurements were conducted at 77.35 K on a Quantachrome Autosorb-6B apparatus. The Brunauer–Emmett–Teller (BET) surface area was calculated using the adsorption data.
Evaluation of photocatalytic activity
The photocatalytic water splitting experiments were conducted in a top window Pyrex reaction cell connected with a closed gas circulation and evacuation system. In a typical run, 50 mg of the photocatalyst was dispersed well in a 100 mL aqueous solution containing 0.1 M sodium sulfide (Na2S·9H2O, extra pure, Acros Organics) and 0.1 M sodium sulfite (Na2SO3, 98%, Alfa Aesar) by constant stirring. Before light irradiation, the reaction system was evacuated and refilled with argon gas for several times to remove air inside and finally filled with argon gas at about 30 Torr. The reaction cell was kept at about 20 °C by a cooling water jacket. A 300 W Xe lamp equipped with a long-pass cut-off filter at 420 nm (Newport, GG420) was used to provide the incident visible light. The produced hydrogen gas was analyzed with an online gas chromatograph (Agilent 6890N, TCD detector, argon as carrier gas, 5 Å molecular sieve column). The apparent quantum efficiency (QE) was measured under the same reaction conditions and the lamp was equipped with a band pass interference filter (Newport, center wavelength 420 nm, band width 10 nm). The number of photons from the radiation source (2.06 × 10²⁰ photons h−1) was measured using a silicon photodiode (13 DAS 005, MELLES GRIOT) connected to a broadband power/energy meter (13 PEM 001, MELLES GRIOT). Eqn (1) was used for the calculation of QE.| |  | (1) |
Results and discussion
Properties and activities of ZnxCd1−xS photocatalysts
ZnxCd1−xS samples were synthesized by the single-source precursor method with x varied between 0 and 0.8 (Table 1). In the presence of diethyldithiocarbamate (DDTC), Zn2+ and Cd2+ cations co-precipitate to form the single-source molecular precursor, ZnxCd1−x(DDTC)2. The XRD patterns of these precursor samples (not shown) agree well with those reported by Zhang et al. according to the standard JCPDS card no. 43-1978.34 A dimer structure of ZnxCd1−x(DDTC)2 precursor similar to that of zinc dimethyldithiocarbamate (DMTC) reported earlier35 can be proposed as shown in Scheme 1. The molecular level mixing attained in the single-source precursor is believed to be important for the formation of ZnxCd1−xS solid solutions in the subsequent solvothermal step.
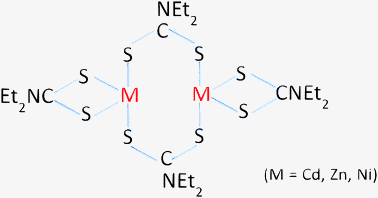 |
| | Scheme 1 The structure of the single-source molecular precursor of metal diethyldithiocarbamate. | |
The properties of ZnxCd1−xS samples were investigated by XRD, FESEM, UV-vis DRS and ICP-AES analyses. The XRD patterns displayed in Fig. 1 show that hexagonal phase CdS (JCPDS card no. 75-1545) of good crystallinity is formed. The three diffraction peaks at 24.9°, 26.6° and 28.3° can be assigned to (100), (002) and (101) planes, respectively. The relatively low intensity of the (002) peak is expected as CdS nanowires of high aspect ratios are formed (Fig. 2a) due to the preferential growth along the c-axis direction in EDA solvent.36,37 Their surface area was measured to be around 30 m2 g−1. The hexagonal phase is maintained in ZnxCd1−xS at smaller x values of 0.3 and 0.4 (Fig. 1). But several changes can be observed. Firstly, their morphology turns to nanoparticles from nanowires (Fig. 2b and c). The average particle size of these nanoparticles is around 50 nm and the surface area slightly increases to about 35 m2 g−1. Secondly, the samples become less crystalline as the XRD peaks broaden. Thirdly, the diffraction peaks shift to higher 2θ values as the Zn2+ content increases due to a smaller ionic radius of Zn2+ than that of Cd2+. The above observations indicate that hexagonal phase ZnxCd1−xS solid solutions are formed, while the blending of Zn2+ cations into the structure causes the change in both the growth orientation and the crystallinity. When the x value is increased to 0.5 and above (Fig. 2d and e), the resulted samples are no longer single-phase solid solutions. As it can be seen from Fig. 1, cubic phase ZnS (JCPDS card no. 05-0566) starts to appear when x is 0.5 and becomes dominant at x of 0.8. Correspondingly, sample Zn0.8Cd0.2S (Fig. 2f) presents the morphology of microspheres comprised of aggregated particles which is distinctively different from other samples. The surface area of this sample (∼12 m2 g−1) is also the lowest. In addition, Table 1 shows that the actual Zn2+![[thin space (1/6-em)]](https://www.rsc.org/images/entities/char_2009.gif) :
:![[thin space (1/6-em)]](https://www.rsc.org/images/entities/char_2009.gif) Cd2+ ratio in the solid is lower than that in the precursor especially when the x value is small. A similar phenomenon occurred in our previous study.38 It is possible that the formation energy of hexagonal phase ZnxCd1−xS solid solution with a large portion of Zn2+ is high as shown in our recent calculations.39 On the other hand, CdS is easier to precipitate owing to its smaller solubility product constant than that of ZnS.40 Under such circumstances, less Zn2+ ions are incorporated in the hexagonal phase and the thermodynamically stable zinc blend (ZnS) phase preferentially precipitates out when the percentage of Zn2+ ions in the precursor is high.
Cd2+ ratio in the solid is lower than that in the precursor especially when the x value is small. A similar phenomenon occurred in our previous study.38 It is possible that the formation energy of hexagonal phase ZnxCd1−xS solid solution with a large portion of Zn2+ is high as shown in our recent calculations.39 On the other hand, CdS is easier to precipitate owing to its smaller solubility product constant than that of ZnS.40 Under such circumstances, less Zn2+ ions are incorporated in the hexagonal phase and the thermodynamically stable zinc blend (ZnS) phase preferentially precipitates out when the percentage of Zn2+ ions in the precursor is high.
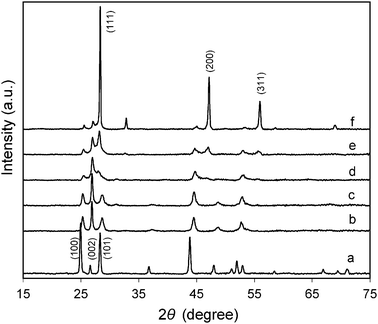 |
| | Fig. 1 XRD patterns of as-prepared ZnxCd1−xS samples (x = 0–0.8) from the single-source precursors. The values of x: (a) 0, (b) 0.3, (c) 0.4, (d) 0.5, (e) 0.6, and (f) 0.8. | |
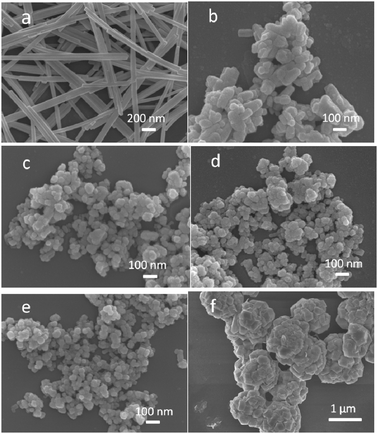 |
| | Fig. 2 FESEM images of ZnxCd1−xS samples. The values of x: (a) 0, (b) 0.3, (c) 0.4, (d) 0.5, (e) 0.6, and (f) 0.8. | |
The UV-vis DRS spectra of as-prepared ZnxCd1−xS samples are displayed in Fig. 3. Intense absorption bands with steep absorption edges are observed for all the spectra, indicating that the visible light absorption is contributed by the intrinsic band gap transition rather than the transition from impurity levels.11 The band gap energy of CdS (Fig. 3a) is 2.39 eV which is consistent with the value reported in the literature.2,36 To rule out the possibility of the overlap effect of the UV-vis DRS spectra, the physical mixture of ZnS and CdS with a molar ratio of 0.31![[thin space (1/6-em)]](https://www.rsc.org/images/entities/char_2009.gif) :
:![[thin space (1/6-em)]](https://www.rsc.org/images/entities/char_2009.gif) 0.69, which is the same as that in the solid solution sample of Zn0.4Cd0.6S (Table 1), was analyzed. As shown in Fig. S1 (ESI†), the physical mixture sample exhibits two distinctive absorption edges. The edge at 519 nm is the same as that of CdS. The other edge in the UV region is almost the same as that of ZnS. When comparing the physical mixture sample and solid solution sample, an obvious absorption edge shift can be observed, and only one absorption edge was observed in the solid solution sample. Thus, it is confirmed that UV-vis DRS spectra of solid solution samples are not from the overlap of spectra of ZnS and CdS. The band gap energy of ZnxCd1−xS samples increases slightly and successively to 2.40–2.49 eV as the x value is increased from 0.3 to 0.8. It is to be noted that although samples ZnxCd1−xS (x ≥ 0.5) have an apparent narrow band gap for visible light absorption, they consist of both ZnxCd1−xS solid solution and ZnS phase of a wide band gap as shown by the XRD results.
0.69, which is the same as that in the solid solution sample of Zn0.4Cd0.6S (Table 1), was analyzed. As shown in Fig. S1 (ESI†), the physical mixture sample exhibits two distinctive absorption edges. The edge at 519 nm is the same as that of CdS. The other edge in the UV region is almost the same as that of ZnS. When comparing the physical mixture sample and solid solution sample, an obvious absorption edge shift can be observed, and only one absorption edge was observed in the solid solution sample. Thus, it is confirmed that UV-vis DRS spectra of solid solution samples are not from the overlap of spectra of ZnS and CdS. The band gap energy of ZnxCd1−xS samples increases slightly and successively to 2.40–2.49 eV as the x value is increased from 0.3 to 0.8. It is to be noted that although samples ZnxCd1−xS (x ≥ 0.5) have an apparent narrow band gap for visible light absorption, they consist of both ZnxCd1−xS solid solution and ZnS phase of a wide band gap as shown by the XRD results.
Fig. 4 displays the time course of hydrogen evolution over ZnxCd1−xS samples in the absence of co-catalysts under visible light irradiation (λ ≥ 420 nm). Despite its strong visible light absorption ability, CdS gives a very low hydrogen evolution rate of 3 μmol h−1, which is due to its relatively low conduction band position and the lack of hydrogen evolution sites on the surface. After the incorporation of Zn2+ ions, the activity of sample Zn0.3Cd0.7S (actual composition: Zn0.23Cd0.77S) remarkably increases to 105 μmol h−1. The highest activity of 402 μmol h−1 is achieved over sample Zn0.4Cd0.6S (actual: Zn0.31Cd0.69S) as shown in Fig. 4c. Considering the high conduction band position of ZnS, the incorporation of Zn2+ ions into CdS tunes the conduction band position to a more negative level as shown by the Mott–Schottky plots from electrochemical impedance measurements carried out by Li et al.9 Such a more negative level is favorable for water reduction to hydrogen. Further increasing of the Zn2+ content (x ≥ 0.5) leads to the gradual decrease of the activity (Fig. 4). Such results are well correlated with the earlier findings that these samples also contain ZnS which retards the visible light absorption and may cause unfavorable charge carrier transportation due to the presence of phase boundary.
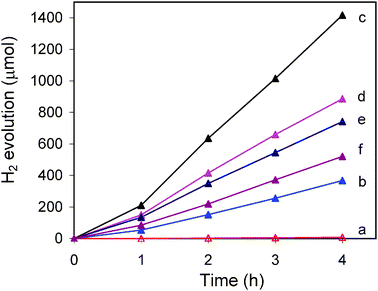 |
| | Fig. 4 Photocatalytic hydrogen evolution over ZnxCd1−xS samples. The values of x: (a) 0, (b) 0.3, (c) 0.4, (d) 0.5, (e) 0.6, and (f) 0.8. Reaction conditions: 50 mg of catalyst in 100 mL of aqueous solution containing 0.1 M Na2S and 0.1 M Na2SO3, 300 W Xe lamp with a 420 nm cutoff filter. | |
Properties of Ni2+-doped ZnxCd1−xS photocatalysts
To further improve the photocatalytic activity of ZnxCd1−xS samples for hydrogen evolution, foreign element doping by Mn2+, Co2+, Ni2+, Cu2+ or Sr2+ was attempted in this work. The foreign metal ions were all introduced at the beginning to form the single-source precursors (as shown in Scheme 1). Among the metal ions, only Ni2+ enhances the activity. The base ZnxCd1−xS sample used for investigation of the effect of Ni2+ ion doping is Zn0.4Cd0.6S since it gives the highest hydrogen evolution rate in the series. As shown earlier, this sample has a hexagonal structure (Fig. 1) and the actual ratio of Zn2+![[thin space (1/6-em)]](https://www.rsc.org/images/entities/char_2009.gif) :
:![[thin space (1/6-em)]](https://www.rsc.org/images/entities/char_2009.gif) Cd2+ is 0.31
Cd2+ is 0.31![[thin space (1/6-em)]](https://www.rsc.org/images/entities/char_2009.gif) :
:![[thin space (1/6-em)]](https://www.rsc.org/images/entities/char_2009.gif) 0.69.
0.69.
Fig. 5 displays the XRD patterns of Ni(y)-Zn0.4Cd0.6S samples with y ranging from 0.5% to 4%. The XRD patterns of Zn0.4Cd0.6S (Fig. 1) without Ni2+ and the control sample with a composition of Ni(1.56%)-Zn0.36Cd0.64S obtained by the co-precipitation method are also shown for comparison. Our previous study indicates that co-precipitation under the atmospheric conditions results in solid solutions of Cu-doped ZnxCd1−xS with a cubic phase.22 The Ni(1.56%)-Zn0.36Cd0.64S control sample prepared in this work using the same method is expected to be a solid solution and its XRD pattern confirms that it has a cubic structure as shown in Fig. 5f. It is interesting to find that doping of Ni2+ in samples prepared by the current single-source precursor method induces the change of the crystal structure from the hexagonal to cubic phase. As shown in Fig. 5a, the base sample Zn0.4Cd0.6S has a hexagonal structure. After doping with Ni2+ ions, both the (100) and (101) peaks at 25.3° and 28.7°, respectively, become much weaker. Comparing these diffraction patterns with those of the standard hexagonal and cubic CdS as well as the control sample shown in Fig. 5, it is no doubt that the dominant phase in Ni(y)-Zn0.4Cd0.6S samples is the cubic phase. Further increasing of y to 8% does not cause changes anymore in the XRD patterns (not shown). In fact, Table 1 shows that the actual percentage of Ni2+ doped is smaller than that in the precursor solution for all the samples. For example, when y is 4%, the actual Ni% is only 1.56%. Even when y is increased to 8%, the actual Ni% only increases to 2.34%. This can be explained by the fact that the solubility product of NiS is much larger than those of CdS and ZnS.40 Hence, Ni2+ is relatively more difficult to be doped in ZnxCd1−xS solid solution compared to Cu2+.22 On the other hand, the ionic radius of Ni2+ in tetrahedral coordination is 0.63 Å which is smaller than that of Zn2+ (0.74 Å) and much smaller than that of Cd2+ (0.92 Å).41 The large disparity in ionic sizes could be the reason that the resultant doped sample favors the thermodynamically more stable cubic phase. In addition, it is found that in the presence of Ni2+, the actual Zn2+![[thin space (1/6-em)]](https://www.rsc.org/images/entities/char_2009.gif) :
:![[thin space (1/6-em)]](https://www.rsc.org/images/entities/char_2009.gif) Cd2+ ratio increases to 0.36
Cd2+ ratio increases to 0.36![[thin space (1/6-em)]](https://www.rsc.org/images/entities/char_2009.gif) :
:![[thin space (1/6-em)]](https://www.rsc.org/images/entities/char_2009.gif) 0.64 from 0.31
0.64 from 0.31![[thin space (1/6-em)]](https://www.rsc.org/images/entities/char_2009.gif) :
:![[thin space (1/6-em)]](https://www.rsc.org/images/entities/char_2009.gif) 0.69 (without Ni2+). Such a shift is in well accordance with the structural change from hexagonal towards cubic phase as Zn2+ ions prefer to precipitate in the cubic phase as discussed earlier.
0.69 (without Ni2+). Such a shift is in well accordance with the structural change from hexagonal towards cubic phase as Zn2+ ions prefer to precipitate in the cubic phase as discussed earlier.
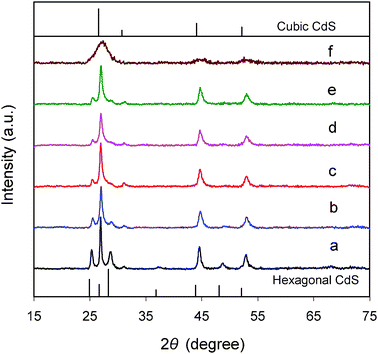 |
| | Fig. 5 XRD patterns of Ni2+-doped samples, Ni(y)-Zn0.4Cd0.6S, prepared from the single-source precursors (the values of y: (a) 0, (b) 0.5%, (c) 2%, (d) 3%, and (e) 4%) and the control sample (f) prepared by a co-precipitation method with a composition of Ni(1.56%)-Zn0.36Cd0.64S. | |
The UV-vis DRS spectra of Ni(y)-Zn0.4Cd0.6S samples shown in Fig. 6 indicate that Ni2+ doping does not cause any obvious shift in the absorption edge compared to the non-doped sample. Our previous calculations and experimental results from other groups have shown that Ni2+-doping can induce band-gap narrowing of CdS42 and Cd0.1Zn0.9S,25 respectively. However, the present study indicates that the band-gap narrowing of ZnxCd1−xS solid solution by Ni2+ doping is not very obvious. The exact reason is not yet clear and will be investigated in our future work. On the other hand, there is a tail-up phenomenon and systematic enhancement in absorption at the wavelength longer than 500 nm as actual Ni% is increased from 0.005% to 2.34% (Table 1). Bulk NiS has a rather small band gap of around 0.1–0.3 eV which corresponds to absorption at the long wavelength region.43 Hence, it is possible that a small portion of NiS is present on the surface of our samples and the percentage increases with nickel loading. XPS analysis of samples Ni(4%)-Zn0.4Cd0.6S and Ni(8%)-Zn0.4Cd0.6S was conducted and the results are shown in Fig. S2 (ESI†). The actual Ni% (metal basis) in these two samples was measured to be 1.6% and 2.3% (Table 1). As shown in Fig. S2 (ESI†), no peaks can be found in the spectrum of Ni 2p of sample Ni(4%)-Zn0.4Cd0.6S. At higher Ni loading in the sample Ni(8%)-Zn0.4Cd0.6S, the Ni 2p signal is still very weak. Nevertheless, the main peak located at 854.8 eV (the peak at 860.2 eV belongs to the satellite peak) can be assigned to NiS.44 In our previously reported NiS/CdS photocatalyst system, a remarkable absorption level enhancement at the long wavelength region was found due to surface coating of CdS by NiS.4 In contrast, the absorption level enhancement in Ni(y)-Zn0.4Cd0.6S samples compared with that of NiS/CdS is much weaker (as shown in Fig. S3, ESI†). Combining the above XPS and UV-vis DRS results, it is suggested that the majority of Ni2+ ions are doped in the bulk structure although a small percentage could be deposited as the NiS phase on the surface.
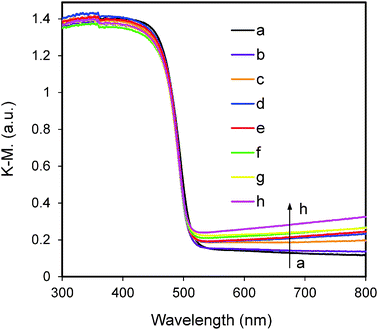 |
| | Fig. 6 UV-visible diffuse reflectance spectra of Ni(y)-Zn0.4Cd0.6S. The values of y: (a) 0, (b) 0.5%, (c) 2%, (d) 3%, (e) 4%, (f) 5%, (g) 6% and (h) 8% along the direction of the arrow. | |
The morphologies of Ni(y)-Zn0.4Cd0.6S samples are similar to that of Zn0.4Cd0.6S shown in Fig. 2c. Fig. 7 shows the representative TEM and HRTEM images of sample Ni(4%)-Zn0.4Cd0.6S. The particle size is in the range of 30–50 nm. Long range lattice fringes can be observed clearly from the HRTEM image, indicating a good crystallinity. The lattice distance measured from the HRTEM image is 3.29 Å, which agrees well with the interplanar distance d002 obtained from the XRD result (3.30 Å).
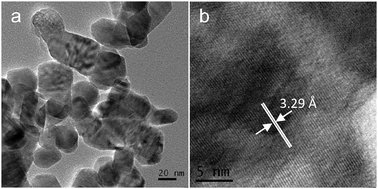 |
| | Fig. 7 (a) TEM and (b) HRTEM images of sample Ni(4%)-Zn0.4Cd0.6S. | |
Photocatalytic activity of Ni2+-doped Zn0.4Cd0.6S
The effect of Ni2+ doping on the performance of photocatalytic hydrogen evolution was evaluated and shown in Fig. 8. Compared with the non-doped sample, all Ni2+-doped Zn0.4Cd0.6S samples exhibit remarkable enhancement for hydrogen evolution. Even trace Ni2+ doping (0.5% in the precursor and 0.005% actual) could lead to about 35% of activity increase. As shown in Fig. 8, a higher Ni2+ doping percentage gives rise to continuous increase in hydrogen evolution. In particular, sample Ni(4%)-Zn0.4Cd0.6S presents the highest activity of 746 μmol h−1, which is 86% higher than that obtained over the non-doped sample. Further increase of Ni2+ doping percentage leads to a slight decrease in hydrogen evolution. Foreign element doping may play two roles in photocatalysis. The doping sites could serve as the trapping pool for charge carriers, which is favorable for charge separation and photocatalytic activity enhancement.22,45,46 They could also exist as crystal defects which function as recombination centers for photo-generated electrons and holes.46,47 In our Ni(y)-Zn0.4Cd0.6S photocatalyst system, it is assumed that when the doping content is relatively low, most of the doped ions serve as the accommodation sites to trap charge carriers while higher doping contents could lead to the formation of more defects. Thus, the optimum hydrogen evolution activity was obtained at a moderate doping level of 1.56% (4% in the precursor).
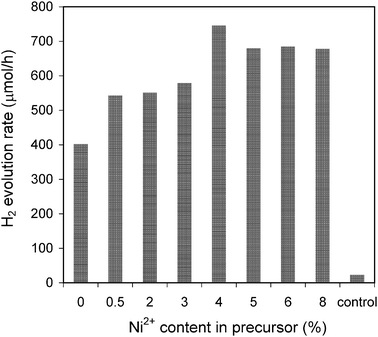 |
| | Fig. 8 Influence of the Ni2+ doping content on the photocatalytic activity. Reaction conditions were kept the same as those in Fig. 4. | |
To demonstrate the advantage of the present single-source precursor method, the control sample with the same composition as that of the optimum sample (Ni(1.56%)-Zn0.36Cd0.64S) was prepared by the co-precipitation method22 and evaluated under the same reaction conditions. Despite its smaller particle size (8–10 nm based on TEM analysis) and large surface area (87 m2 g−1), the hydrogen evolution rate obtained over the control sample is only 23 μmol h−1. The low crystallinity of the control sample (Fig. 5) could be the major reason leading to the much lower activity. Ni2+-doped ZnxCd1−xS photocatalysts were also prepared by other research groups using a one-pot hydrothermal method and the highest QE reported was 14.4% (at 420 nm) with a corresponding initial hydrogen production rate of 80.75 μmol h−1 (λ > 420 nm).25,26
To achieve optimized photocatalytic activity, the concentrations of the sacrificial reagents were varied. Fig. 9 displays the dependence of hydrogen evolution rate on the concentrations of the sacrificial reagents. The mechanism of using Na2S and Na2SO3 as sacrificial reagents in the aqueous solution to produce hydrogen gas from photocatalytic water splitting can be expressed by eqn (2)–(6).3 The occurrence of reactions (4)–(6) was verified by the detection of SO2−4 and S2O2−3 species in the reaction mixture after photoreaction (Fig. S4 and S5, ESI† and related discussions).
| |  | (2) |
| | | SO2−3 + 2OH− + 2h+ → SO2−4 + 2H+ | (4) |
| | | S2−2 + SO2−3 → S2O2−3 + S2− | (6) |
When the concentration of Na
2SO
3 was fixed at 0.1 M,
Fig. 9a shows that in the absence of Na
2S, the hydrogen evolution rate is only less than 100 μmol h
−1. The presence of Na
2S in the current reaction system is crucial for activity enhancement because Na
2S can act as a hole scavenger and stabilize the surface of metal
sulfide to suppress the formation of the surface defect. With the increase of Na
2S concentration to 0.7 M, the highest hydrogen evolution rate of 941 μmol h
−1 is obtained. Further increase of Na
2S concentration led to a slight decrease of the hydrogen evolution rate. It is known that a higher concentration of Na
2S leads to a higher pH value, which can influence the flat-band potential of the metal
sulfide semiconductor photocatalyst as well as the redox potential of H
+/H
2. With the increase of pH value, the flat band potential of metal
sulfide becomes less negative leading to the decrease of photocatalytic activity.
48 At the same time, a high pH value is thermodynamically unfavorable for the reaction described by
eqn (3).
11 Thus, an appropriate Na
2S concentration is required to achieve the optimum hydrogen evolution rate.
Fig. 9b shows the influence of Na
2SO
3 concentration on the photocatalytic activity by keeping Na
2S concentration at 0.7 M. It is found that in the absence of Na
2SO
3, the activity is relatively low with the hydrogen evolution rate of 800 μmol h
−1. According to
eqn (5), S
2−2 ions are produced and they could act as the optical filter to hinder the light absorption if not being consumed.
22 As shown in
eqn (6), the reaction between S
2−2 and SO
2−3 produces S
2O
2−3 which is colorless and does not compete for the light absorption. Thus, after the addition of 0.1 M Na
2SO
3, the hydrogen evolution rate can be increased to 941 μmol h
−1. Further increase of Na
2SO
3 concentration does not give obvious enhancement of the photocatalytic activity. Under the optimized reaction conditions, the QE was measured to be 22.8% at 420 nm in the absence of any co-catalysts. Such a value is much higher than those of other Ni
2+-doped ZnS or Ni
2+-Zn
xCd
1−xS photocatalysts ever reported.
19,25,26,49 The atomic ratio of metal ions (Ni
2+![[thin space (1/6-em)]](https://www.rsc.org/images/entities/char_2009.gif)
:
![[thin space (1/6-em)]](https://www.rsc.org/images/entities/char_2009.gif)
Zn
2+![[thin space (1/6-em)]](https://www.rsc.org/images/entities/char_2009.gif)
:
![[thin space (1/6-em)]](https://www.rsc.org/images/entities/char_2009.gif)
Cd
2+) of Ni(4%)-Zn
0.4Cd
0.6S after photoreaction was measured to be 1.56
![[thin space (1/6-em)]](https://www.rsc.org/images/entities/char_2009.gif)
:
![[thin space (1/6-em)]](https://www.rsc.org/images/entities/char_2009.gif)
37
![[thin space (1/6-em)]](https://www.rsc.org/images/entities/char_2009.gif)
:
![[thin space (1/6-em)]](https://www.rsc.org/images/entities/char_2009.gif)
63, which is almost the same as that before the reaction (1.56
![[thin space (1/6-em)]](https://www.rsc.org/images/entities/char_2009.gif)
:
![[thin space (1/6-em)]](https://www.rsc.org/images/entities/char_2009.gif)
36
![[thin space (1/6-em)]](https://www.rsc.org/images/entities/char_2009.gif)
:
![[thin space (1/6-em)]](https://www.rsc.org/images/entities/char_2009.gif)
64). Thus it is indicated that our samples are stable.
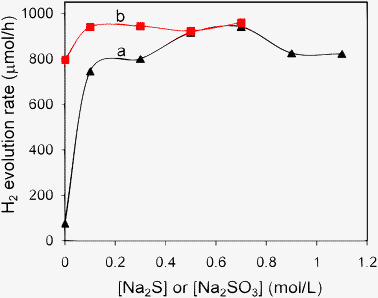 |
| | Fig. 9 Influence of the concentrations of the sacrificial reagents on the photocatalytic activity of Ni(4%)-Zn0.4Cd0.6S. (a) 0.1 M Na2SO3 and varied concentration of Na2S, (b) 0.7 M Na2S and varied concentration of Na2SO3. The other reaction conditions were kept the same as those in Fig. 4. | |
Finally, Fig. 10 shows the dependence of hydrogen evolution rate over Ni(4%)-Zn0.4Cd0.6S on the wavelength of the cut-off filter. The onset of the action spectrum of hydrogen evolution is consistent with the diffuse reflectance spectrum, indicating that the visible light response of the photocatalyst comes from the band gap transition between the conduction band and valence band.13 The hydrogen evolution rate obtained with 450 nm and 475 nm cut-off filters is still as high as 680 and 270 μmol h−1, respectively.
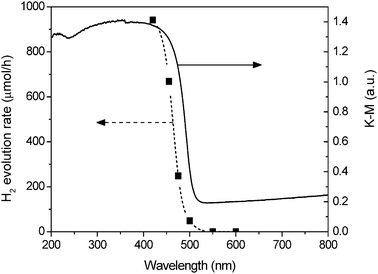 |
| | Fig. 10 Dependence of the hydrogen evolution rate on the wavelength of the cutoff filter. Reaction conditions: 50 mg of Ni(4%)-Zn0.4Cd0.6S in 100 mL aqueous solution containing 0.7 M Na2S and 0.1 M Na2SO3, 300 W Xe lamp with different cutoff filters. | |
Conclusions
Ni2+-doped ZnxCd1−xS photocatalysts have been successfully prepared by solvothermal treatment of the single-source precursors formed between the metal cations and diethyldithiocarbamate. Compared to the non-doped sample, Ni2+ doping can give rise to 86% increase in the hydrogen evolution rate. The effects of the composition of the photocatalysts and the photoreaction conditions were investigated systematically. The optimum hydrogen evolution rate achieved is 941 μmol h−1 with a corresponding QE of 22.8% at 420 nm over Ni(4%)-Zn0.4Cd0.6S. It is proposed that Ni2+ doping sites could serve as the accommodation centers for photo-generated charge carriers, which enhance the charge separation and the photocatalytic activity.
Acknowledgements
The authors greatly acknowledge the research funding support from Ministry of Education, Singapore, Project no.: ARC25/08 (T208B1215) and RG117/06, and Wang Y.B. acknowledges the research scholarship from Nanyang Technological University.
Notes and references
- J. R. Darwent, J. Chem. Soc., Faraday Trans. 2, 1981, 77, 1703–1709 RSC.
- D. Jing and L. Guo, J. Phys. Chem. B, 2006, 110, 11139–11145 CrossRef CAS.
- N. Bao, L. Shen, T. Takata and K. Domen, Chem. Mater., 2008, 20, 110–117 CrossRef CAS.
- W. Zhang, Y. Wang, Z. Wang, Z. Zhong and R. Xu, Chem. Commun., 2010, 46, 7631–7633 RSC.
- X. Zong, H. Yan, G. Wu, G. Ma, F. Wen, L. Wang and C. Li, J. Am. Chem. Soc., 2008, 130, 7176–7177 CrossRef CAS.
- H. Yan, J. Yang, G. Ma, G. Wu, X. Zong, Z. Lei, J. Shi and C. Li, J. Catal., 2009, 266, 165–168 CrossRef CAS.
- X. Wang, K. Maeda, A. Thomas, K. Takanabe, G. Xin, J. M. Carlsson, K. Domen and M. Antonietti, Nat. Mater., 2009, 8, 76–80 CrossRef CAS.
- K. Maeda, K. Teramura, D. L. Lu, T. Takata, N. Saito, Y. Inoue and K. Domen, Nature, 2006, 440, 295 CrossRef CAS.
- M. T. Li, J. G. Jiang and L. Guo, Int. J. Hydrogen Energy, 2010, 35, 7036–7042 CrossRef CAS.
- X. Wang, G. Liu, Z. G. Chen, F. Li, G. Q. Lu and H. M. Cheng, Electrochem. Commun., 2009, 11, 1174–1178 CrossRef CAS.
- L. Wang, W. Wang, M. Shang, W. Yin, S. Sun and L. Zhang, Int. J. Hydrogen Energy, 2010, 35, 19–25 CrossRef CAS.
- I. Tsuji, H. Kato, H. Kobayashi and A. Kudo, J. Am. Chem. Soc., 2004, 126, 13406–13413 CrossRef CAS.
- I. Tsuji, H. Kato and A. Kudo, Chem. Mater., 2006, 18, 1969–1975 CrossRef CAS.
- Y. Li, G. Chen, C. Zhou and J. Sun, Chem. Commun., 2009, 2020–2022 RSC.
- Z. G. Zou, J. H. Ye, K. Sayama and H. Arakawa, Nature, 2001, 414, 625–627 CrossRef CAS.
- G. Liu, G. Y. Hua, X. Wang, L. Cheng, J. Pan, Q. L. Gao and H. M. Cheng, J. Am. Chem. Soc., 2009, 131, 12868–12869 CrossRef CAS.
- T. Sreethawong, S. Laehsalee and S. Chauadej, Int. J. Hydrogen Energy, 2008, 33, 5947–5957 CrossRef CAS.
- H. Kato and A. Kudo, J. Phys. Chem. B, 2002, 106, 5029–5034 CrossRef CAS.
- A. Kudo and M. Sekizawa, Chem. Commun., 2000, 1371–1372 RSC.
- K. Ikcue, S. Shiiba and M. Machida, Chem. Mater., 2010, 22, 743–745 CrossRef.
- G. Liu, L. Zhao, L. Ma and L. Guo, Catal. Commun., 2008, 9, 126–130 CrossRef CAS.
- W. Zhang, Z. Zhong, Y. Wang and R. Xu, J. Phys. Chem. C, 2008, 112, 17635–17642 CAS.
- W. Zhang and R. Xu, Int. J. Hydrogen Energy, 2009, 34, 8495–8503 CrossRef CAS.
- Y. Wang, Y. Wang and R. Xu, Int. J. Hydrogen Energy, 2010, 35, 5245–5253 CrossRef CAS.
- X. Zhang, D. Jing, M. Liu and L. Guo, Catal. Commun., 2008, 9, 1720–1724 CrossRef CAS.
- X. Zhang, D. Jing and L. Guo, Int. J. Hydrogen Energy, 2010, 35, 7051–7057 CrossRef CAS.
- A. Deshpande, P. Shah, R. S. Gholap and N. M. Gupta, J. Colloid Interface Sci., 2009, 333, 263–268 CrossRef CAS.
- F. del Valle, A. Ishikawa, K. Domen, J. A. Villoria de la Mano, M. C. Sánchez-Sánchez, I. D. González, S. Herreras, N. Mota, M. E. Rivas, M. C. Álvarez Galván, J. L. G. Fierro and R. M. Navarro, Catal. Today, 2009, 143, 51–56 CrossRef CAS.
- K. Zhang, D. Jing, C. Xing and L. Guo, Int. J. Hydrogen Energy, 2007, 32, 4685–4691 CrossRef CAS.
- A. M. Roy and G. C. De, J. Photochem. Photobiol., A, 2003, 157, 87–92 CrossRef CAS.
- A. Ueno, N. Kakuta, K. H. Park, M. F. Finlayson, A. J. Bard, A. Campion, M. A. Fox, S. E. Webber and J. M. White, J. Phys. Chem., 1985, 89, 3828–3833 CrossRef CAS.
- M. C. Liu, L. Z. Wang, G. Q. Lu, X. D. Yao and L. J. Guo, Energy Environ. Sci., 2011, 4, 1372–1378 CAS.
- K. Zhang, D. Jing, Q. Chen and L. Guo, Int. J. Hydrogen Energy, 2010, 35, 2048–2057 CrossRef CAS.
- Y. C. Zhang, W. W. Chen and X. Y. Hu, Cryst. Growth Des., 2007, 7, 580–586 CAS.
- K. Hagen, C. J. Holwill and D. A. Rice, Inorg. Chem., 1989, 28, 3239–3242 CrossRef CAS.
- J. S. Jang, U. A. Joshi and J. S. Lee, J. Phys. Chem. C, 2007, 111, 13280–13287 CAS.
- J. Yang, J. H. Zeng, S. H. Yu, L. Yang, G. E. Zhou and Y. T. Qian, Chem. Mater., 2000, 12, 3259–3263 CrossRef CAS.
- Y. Wang, J. Wu, J. Zheng and R. Xu, Catal. Sci. Technol., 2011, 1, 940–947 CAS.
- J. C. Wu, J. Zheng, C. L. Zacherl, P. Wu, Z. K. Liu and R. Xu, J. Phys. Chem. C, 2011, 115, 19741–19748 CAS.
- J. R. Goates, M. B. Gordon and N. D. Faux, J. Am. Chem. Soc., 1952, 74, 835–836 CrossRef CAS.
-
F. A. Cotton, Advanced Inorganic Chemistry, Wiley, New York, 1999 Search PubMed.
- J. C. Wu, J. Zheng, P. Wu and R. Xu, J. Phys. Chem. C, 2011, 115, 5675–5682 CAS.
- P. Yang, M. Lü, C. F. Song, G. Zhou, D. Xu and D. R. Yuan, J. Phys. Chem. Solids, 2002, 63, 2047–2051 CrossRef CAS.
-
J. F. Moulder, W. F. Stickle, P. E. Sobol and K. D. Bomben, Handbook of X-ray Photoelectron Spectroscopy, Perkin Elmer, Eden Prairie, 1992 Search PubMed.
- C. M. Janet, S. Navaladian, B. Viswanathan, T. K. Varadarajan and R. P. Viswanath, J. Phys. Chem. C, 2010, 114, 2622–2632 CAS.
- J. Shi, H. n. Cui, Z. Liang, X. Lu, Y. Tong, C. Su and H. Liu, Energy Environ. Sci., 2011, 4, 466–470 CAS.
- L. Yuliati, J.-H. Yang, X. Wang, K. Maeda, T. Takata, M. Antonietti and K. Domen, J. Mater. Chem., 2010, 20, 4295–4298 RSC.
- N. Bühler, K. Meier and J. F. Reber, J. Phys. Chem., 1984, 88, 3261–3268 CrossRef.
- J. H. Bang, R. J. Helmich and K. S. Suslick, Adv. Mater., 2008, 20, 2599–2603 CrossRef CAS.
Footnote |
| † Electronic supplementary information (ESI) available: UV-vis and XPS results, and details about verification of the photoreaction mechanism. See DOI: 10.1039/c2cy00310d |
|
| This journal is © The Royal Society of Chemistry 2012 |
Click here to see how this site uses Cookies. View our privacy policy here. ![[thin space (1/6-em)]](https://www.rsc.org/images/entities/char_2009.gif) :
:![[thin space (1/6-em)]](https://www.rsc.org/images/entities/char_2009.gif) Zn2+
Zn2+![[thin space (1/6-em)]](https://www.rsc.org/images/entities/char_2009.gif) :
:![[thin space (1/6-em)]](https://www.rsc.org/images/entities/char_2009.gif) Cd2+
Cd2+![[thin space (1/6-em)]](https://www.rsc.org/images/entities/char_2009.gif) :
:![[thin space (1/6-em)]](https://www.rsc.org/images/entities/char_2009.gif) 30
30![[thin space (1/6-em)]](https://www.rsc.org/images/entities/char_2009.gif) :
:![[thin space (1/6-em)]](https://www.rsc.org/images/entities/char_2009.gif) 70
70![[thin space (1/6-em)]](https://www.rsc.org/images/entities/char_2009.gif) :
:![[thin space (1/6-em)]](https://www.rsc.org/images/entities/char_2009.gif) 23.4
23.4![[thin space (1/6-em)]](https://www.rsc.org/images/entities/char_2009.gif) :
:![[thin space (1/6-em)]](https://www.rsc.org/images/entities/char_2009.gif) 76.6
76.6![[thin space (1/6-em)]](https://www.rsc.org/images/entities/char_2009.gif) :
:![[thin space (1/6-em)]](https://www.rsc.org/images/entities/char_2009.gif) 40
40![[thin space (1/6-em)]](https://www.rsc.org/images/entities/char_2009.gif) :
:![[thin space (1/6-em)]](https://www.rsc.org/images/entities/char_2009.gif) 60
60![[thin space (1/6-em)]](https://www.rsc.org/images/entities/char_2009.gif) :
:![[thin space (1/6-em)]](https://www.rsc.org/images/entities/char_2009.gif) 31.4
31.4![[thin space (1/6-em)]](https://www.rsc.org/images/entities/char_2009.gif) :
:![[thin space (1/6-em)]](https://www.rsc.org/images/entities/char_2009.gif) 68.6
68.6![[thin space (1/6-em)]](https://www.rsc.org/images/entities/char_2009.gif) :
:![[thin space (1/6-em)]](https://www.rsc.org/images/entities/char_2009.gif) 50
50![[thin space (1/6-em)]](https://www.rsc.org/images/entities/char_2009.gif) :
:![[thin space (1/6-em)]](https://www.rsc.org/images/entities/char_2009.gif) 50
50![[thin space (1/6-em)]](https://www.rsc.org/images/entities/char_2009.gif) :
:![[thin space (1/6-em)]](https://www.rsc.org/images/entities/char_2009.gif) 44.8
44.8![[thin space (1/6-em)]](https://www.rsc.org/images/entities/char_2009.gif) :
:![[thin space (1/6-em)]](https://www.rsc.org/images/entities/char_2009.gif) 55.2
55.2![[thin space (1/6-em)]](https://www.rsc.org/images/entities/char_2009.gif) :
:![[thin space (1/6-em)]](https://www.rsc.org/images/entities/char_2009.gif) 60
60![[thin space (1/6-em)]](https://www.rsc.org/images/entities/char_2009.gif) :
:![[thin space (1/6-em)]](https://www.rsc.org/images/entities/char_2009.gif) 40
40![[thin space (1/6-em)]](https://www.rsc.org/images/entities/char_2009.gif) :
:![[thin space (1/6-em)]](https://www.rsc.org/images/entities/char_2009.gif) 57.3
57.3![[thin space (1/6-em)]](https://www.rsc.org/images/entities/char_2009.gif) :
:![[thin space (1/6-em)]](https://www.rsc.org/images/entities/char_2009.gif) 42.7
42.7![[thin space (1/6-em)]](https://www.rsc.org/images/entities/char_2009.gif) :
:![[thin space (1/6-em)]](https://www.rsc.org/images/entities/char_2009.gif) 80
80![[thin space (1/6-em)]](https://www.rsc.org/images/entities/char_2009.gif) :
:![[thin space (1/6-em)]](https://www.rsc.org/images/entities/char_2009.gif) 20
20![[thin space (1/6-em)]](https://www.rsc.org/images/entities/char_2009.gif) :
:![[thin space (1/6-em)]](https://www.rsc.org/images/entities/char_2009.gif) 79.6
79.6![[thin space (1/6-em)]](https://www.rsc.org/images/entities/char_2009.gif) :
:![[thin space (1/6-em)]](https://www.rsc.org/images/entities/char_2009.gif) 20.4
20.4![[thin space (1/6-em)]](https://www.rsc.org/images/entities/char_2009.gif) :
:![[thin space (1/6-em)]](https://www.rsc.org/images/entities/char_2009.gif) 40
40![[thin space (1/6-em)]](https://www.rsc.org/images/entities/char_2009.gif) :
:![[thin space (1/6-em)]](https://www.rsc.org/images/entities/char_2009.gif) 60
60![[thin space (1/6-em)]](https://www.rsc.org/images/entities/char_2009.gif) :
:![[thin space (1/6-em)]](https://www.rsc.org/images/entities/char_2009.gif) 33.0
33.0![[thin space (1/6-em)]](https://www.rsc.org/images/entities/char_2009.gif) :
:![[thin space (1/6-em)]](https://www.rsc.org/images/entities/char_2009.gif) 67.0
67.0![[thin space (1/6-em)]](https://www.rsc.org/images/entities/char_2009.gif) :
:![[thin space (1/6-em)]](https://www.rsc.org/images/entities/char_2009.gif) 40
40![[thin space (1/6-em)]](https://www.rsc.org/images/entities/char_2009.gif) :
:![[thin space (1/6-em)]](https://www.rsc.org/images/entities/char_2009.gif) 60
60![[thin space (1/6-em)]](https://www.rsc.org/images/entities/char_2009.gif) :
:![[thin space (1/6-em)]](https://www.rsc.org/images/entities/char_2009.gif) 36.5
36.5![[thin space (1/6-em)]](https://www.rsc.org/images/entities/char_2009.gif) :
:![[thin space (1/6-em)]](https://www.rsc.org/images/entities/char_2009.gif) 63.5
63.5![[thin space (1/6-em)]](https://www.rsc.org/images/entities/char_2009.gif) :
:![[thin space (1/6-em)]](https://www.rsc.org/images/entities/char_2009.gif) 40
40![[thin space (1/6-em)]](https://www.rsc.org/images/entities/char_2009.gif) :
:![[thin space (1/6-em)]](https://www.rsc.org/images/entities/char_2009.gif) 60
60![[thin space (1/6-em)]](https://www.rsc.org/images/entities/char_2009.gif) :
:![[thin space (1/6-em)]](https://www.rsc.org/images/entities/char_2009.gif) 35.6
35.6![[thin space (1/6-em)]](https://www.rsc.org/images/entities/char_2009.gif) :
:![[thin space (1/6-em)]](https://www.rsc.org/images/entities/char_2009.gif) 64.4
64.4![[thin space (1/6-em)]](https://www.rsc.org/images/entities/char_2009.gif) :
:![[thin space (1/6-em)]](https://www.rsc.org/images/entities/char_2009.gif) 40
40![[thin space (1/6-em)]](https://www.rsc.org/images/entities/char_2009.gif) :
:![[thin space (1/6-em)]](https://www.rsc.org/images/entities/char_2009.gif) 60
60![[thin space (1/6-em)]](https://www.rsc.org/images/entities/char_2009.gif) :
:![[thin space (1/6-em)]](https://www.rsc.org/images/entities/char_2009.gif) 36.0
36.0![[thin space (1/6-em)]](https://www.rsc.org/images/entities/char_2009.gif) :
:![[thin space (1/6-em)]](https://www.rsc.org/images/entities/char_2009.gif) 64.0
64.0![[thin space (1/6-em)]](https://www.rsc.org/images/entities/char_2009.gif) :
:![[thin space (1/6-em)]](https://www.rsc.org/images/entities/char_2009.gif) 40
40![[thin space (1/6-em)]](https://www.rsc.org/images/entities/char_2009.gif) :
:![[thin space (1/6-em)]](https://www.rsc.org/images/entities/char_2009.gif) 60
60![[thin space (1/6-em)]](https://www.rsc.org/images/entities/char_2009.gif) :
:![[thin space (1/6-em)]](https://www.rsc.org/images/entities/char_2009.gif) 36.7
36.7![[thin space (1/6-em)]](https://www.rsc.org/images/entities/char_2009.gif) :
:![[thin space (1/6-em)]](https://www.rsc.org/images/entities/char_2009.gif) 63.3
63.3![[thin space (1/6-em)]](https://www.rsc.org/images/entities/char_2009.gif) :
:![[thin space (1/6-em)]](https://www.rsc.org/images/entities/char_2009.gif) 40
40![[thin space (1/6-em)]](https://www.rsc.org/images/entities/char_2009.gif) :
:![[thin space (1/6-em)]](https://www.rsc.org/images/entities/char_2009.gif) 60
60![[thin space (1/6-em)]](https://www.rsc.org/images/entities/char_2009.gif) :
:![[thin space (1/6-em)]](https://www.rsc.org/images/entities/char_2009.gif) 35.9
35.9![[thin space (1/6-em)]](https://www.rsc.org/images/entities/char_2009.gif) :
:![[thin space (1/6-em)]](https://www.rsc.org/images/entities/char_2009.gif) 64.1
64.1![[thin space (1/6-em)]](https://www.rsc.org/images/entities/char_2009.gif) :
:![[thin space (1/6-em)]](https://www.rsc.org/images/entities/char_2009.gif) 40
40![[thin space (1/6-em)]](https://www.rsc.org/images/entities/char_2009.gif) :
:![[thin space (1/6-em)]](https://www.rsc.org/images/entities/char_2009.gif) 60
60![[thin space (1/6-em)]](https://www.rsc.org/images/entities/char_2009.gif) :
:![[thin space (1/6-em)]](https://www.rsc.org/images/entities/char_2009.gif) 36.0
36.0![[thin space (1/6-em)]](https://www.rsc.org/images/entities/char_2009.gif) :
:![[thin space (1/6-em)]](https://www.rsc.org/images/entities/char_2009.gif) 64.0
64.0

![[thin space (1/6-em)]](https://www.rsc.org/images/entities/char_2009.gif) :
:![[thin space (1/6-em)]](https://www.rsc.org/images/entities/char_2009.gif) Cd2+ ratio in the solid is lower than that in the precursor especially when the x value is small. A similar phenomenon occurred in our previous study.38 It is possible that the formation energy of hexagonal phase ZnxCd1−xS solid solution with a large portion of Zn2+ is high as shown in our recent calculations.39 On the other hand, CdS is easier to precipitate owing to its smaller solubility product constant than that of ZnS.40 Under such circumstances, less Zn2+ ions are incorporated in the hexagonal phase and the thermodynamically stable zinc blend (ZnS) phase preferentially precipitates out when the percentage of Zn2+ ions in the precursor is high.
Cd2+ ratio in the solid is lower than that in the precursor especially when the x value is small. A similar phenomenon occurred in our previous study.38 It is possible that the formation energy of hexagonal phase ZnxCd1−xS solid solution with a large portion of Zn2+ is high as shown in our recent calculations.39 On the other hand, CdS is easier to precipitate owing to its smaller solubility product constant than that of ZnS.40 Under such circumstances, less Zn2+ ions are incorporated in the hexagonal phase and the thermodynamically stable zinc blend (ZnS) phase preferentially precipitates out when the percentage of Zn2+ ions in the precursor is high.

![[thin space (1/6-em)]](https://www.rsc.org/images/entities/char_2009.gif) :
:![[thin space (1/6-em)]](https://www.rsc.org/images/entities/char_2009.gif) 0.69, which is the same as that in the solid solution sample of Zn0.4Cd0.6S (Table 1), was analyzed. As shown in Fig. S1 (ESI†), the physical mixture sample exhibits two distinctive absorption edges. The edge at 519 nm is the same as that of CdS. The other edge in the UV region is almost the same as that of ZnS. When comparing the physical mixture sample and solid solution sample, an obvious absorption edge shift can be observed, and only one absorption edge was observed in the solid solution sample. Thus, it is confirmed that UV-vis DRS spectra of solid solution samples are not from the overlap of spectra of ZnS and CdS. The band gap energy of ZnxCd1−xS samples increases slightly and successively to 2.40–2.49 eV as the x value is increased from 0.3 to 0.8. It is to be noted that although samples ZnxCd1−xS (x ≥ 0.5) have an apparent narrow band gap for visible light absorption, they consist of both ZnxCd1−xS solid solution and ZnS phase of a wide band gap as shown by the XRD results.
0.69, which is the same as that in the solid solution sample of Zn0.4Cd0.6S (Table 1), was analyzed. As shown in Fig. S1 (ESI†), the physical mixture sample exhibits two distinctive absorption edges. The edge at 519 nm is the same as that of CdS. The other edge in the UV region is almost the same as that of ZnS. When comparing the physical mixture sample and solid solution sample, an obvious absorption edge shift can be observed, and only one absorption edge was observed in the solid solution sample. Thus, it is confirmed that UV-vis DRS spectra of solid solution samples are not from the overlap of spectra of ZnS and CdS. The band gap energy of ZnxCd1−xS samples increases slightly and successively to 2.40–2.49 eV as the x value is increased from 0.3 to 0.8. It is to be noted that although samples ZnxCd1−xS (x ≥ 0.5) have an apparent narrow band gap for visible light absorption, they consist of both ZnxCd1−xS solid solution and ZnS phase of a wide band gap as shown by the XRD results.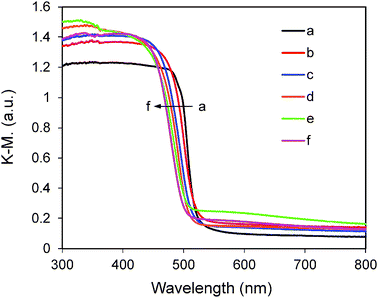

![[thin space (1/6-em)]](https://www.rsc.org/images/entities/char_2009.gif) :
:![[thin space (1/6-em)]](https://www.rsc.org/images/entities/char_2009.gif) Cd2+ is 0.31
Cd2+ is 0.31![[thin space (1/6-em)]](https://www.rsc.org/images/entities/char_2009.gif) :
:![[thin space (1/6-em)]](https://www.rsc.org/images/entities/char_2009.gif) 0.69.
0.69.
![[thin space (1/6-em)]](https://www.rsc.org/images/entities/char_2009.gif) :
:![[thin space (1/6-em)]](https://www.rsc.org/images/entities/char_2009.gif) Cd2+ ratio increases to 0.36
Cd2+ ratio increases to 0.36![[thin space (1/6-em)]](https://www.rsc.org/images/entities/char_2009.gif) :
:![[thin space (1/6-em)]](https://www.rsc.org/images/entities/char_2009.gif) 0.64 from 0.31
0.64 from 0.31![[thin space (1/6-em)]](https://www.rsc.org/images/entities/char_2009.gif) :
:![[thin space (1/6-em)]](https://www.rsc.org/images/entities/char_2009.gif) 0.69 (without Ni2+). Such a shift is in well accordance with the structural change from hexagonal towards cubic phase as Zn2+ ions prefer to precipitate in the cubic phase as discussed earlier.
0.69 (without Ni2+). Such a shift is in well accordance with the structural change from hexagonal towards cubic phase as Zn2+ ions prefer to precipitate in the cubic phase as discussed earlier.


![[thin space (1/6-em)]](https://www.rsc.org/images/entities/char_2009.gif) :
:![[thin space (1/6-em)]](https://www.rsc.org/images/entities/char_2009.gif) Zn2+
Zn2+![[thin space (1/6-em)]](https://www.rsc.org/images/entities/char_2009.gif) :
:![[thin space (1/6-em)]](https://www.rsc.org/images/entities/char_2009.gif) Cd2+) of Ni(4%)-Zn0.4Cd0.6S after photoreaction was measured to be 1.56
Cd2+) of Ni(4%)-Zn0.4Cd0.6S after photoreaction was measured to be 1.56![[thin space (1/6-em)]](https://www.rsc.org/images/entities/char_2009.gif) :
:![[thin space (1/6-em)]](https://www.rsc.org/images/entities/char_2009.gif) 37
37![[thin space (1/6-em)]](https://www.rsc.org/images/entities/char_2009.gif) :
:![[thin space (1/6-em)]](https://www.rsc.org/images/entities/char_2009.gif) 63, which is almost the same as that before the reaction (1.56
63, which is almost the same as that before the reaction (1.56![[thin space (1/6-em)]](https://www.rsc.org/images/entities/char_2009.gif) :
:![[thin space (1/6-em)]](https://www.rsc.org/images/entities/char_2009.gif) 36
36![[thin space (1/6-em)]](https://www.rsc.org/images/entities/char_2009.gif) :
:![[thin space (1/6-em)]](https://www.rsc.org/images/entities/char_2009.gif) 64). Thus it is indicated that our samples are stable.
64). Thus it is indicated that our samples are stable.


