A new way to enhance the porosity and Y-faujasite percentage of in situ crystallized FCC catalyst†
Yongming
Zhang
ab and
Chunrong
Xiong
*a
aKey Laboratory of Ministry of Education for Application Technology of Chemical Materials in Hainan Superior Resources, Hainan University, Haikou 570228, P. R. China. E-mail: bearcr_82@hotmail.com; Fax: 86-898-66271762; Tel: 86-898-66279226
bKey Laboratory of Petrochemical Detecting Techniques of Hainan Province, Hainan 570228, P. R. China
First published on 23rd December 2011
Abstract
An in situ crystallized FCC catalyst with high porosity and high Y-faujasite percentage was successfully synthesized via adding a lab made porosity enlarging agent (PEA) to kaolin clay. The in situ crystallized microspheres (CMS) had a pore volume of 0.462 mL g−1, a specific surface area of 406 m2 g−1, and a Y-faujasite content of over 60%. Densely packed Y-faujasite crystals and abundant macropores can be observed on the surface of the in situ crystallized microspheres. After ion exchange with NH4NO3 solution and rare earth lanthanum, the crystallized microspheres had an attrition index of 2.2% h−1, meeting the commercial requirements of FCC catalysts. The ratio of Brønsted sites to Lewis sites was 2.8, and the ratio of weak, medium and strong acid sites was 1.83![[thin space (1/6-em)]](https://www.rsc.org/images/entities/char_2009.gif) :
:![[thin space (1/6-em)]](https://www.rsc.org/images/entities/char_2009.gif) 1.33
1.33![[thin space (1/6-em)]](https://www.rsc.org/images/entities/char_2009.gif) :
:![[thin space (1/6-em)]](https://www.rsc.org/images/entities/char_2009.gif) 1. The resulting catalyst had a good hydrothermal stability. Its catalytic performance in cracking mixing oil displayed high selectivities to gasoline and light oil, and low selectivities to dry gas and coke.
1. The resulting catalyst had a good hydrothermal stability. Its catalytic performance in cracking mixing oil displayed high selectivities to gasoline and light oil, and low selectivities to dry gas and coke.
1. Introduction
Kaolin is a natural clay, chiefly comprised of hydrated aluminum silicates. It has been used to synthesize FCC catalyst due to its reasonable price and availability.1–3 Metakaolin and spinel kaolin are chemically reactive, and obtained by calcining the raw kaolin at 700–850 °C and 950–1050 °C, respectively.4 A significant portion of commercial FCC catalysts have been synthesized by in situ crystallization of the calcined kaolin microspheres. Such catalyst contains both an active Y-faujasite component and a non-zeolitic component. The non-zeolitic component is referred to as a matrix, performing a number of important functions related to the catalytic and physical properties of the catalyst.5 Importantly, the attrition resistance of the microspheres prepared by the method is superior to the conventional FCC catalysts in which the crystallized zeolite component was physically embedded in the non-zeolitic matrix.6The low porosity of the in situ crystallized microspheres has not been considered a problem before since there has been no diffusion limitation under the previous FCC processing units. In general, the in situ crystallized microspheres have a total porosity of ∼0.30 cc g−1 and a specific surface area of ∼250 m2 g−1.7 Recently, a FCC reactor has been developed and this dramatically reduced the contact time between the catalyst and the feedstock for the purpose of minimizing coke and dry gas selectivities. To compensate for the reduction of conversion brought by the shorter contact time in the FCC processing, it is highly desirable to improve the total surface area and the porosity of the microsphere catalyst and eliminate the active site occlusion and diffusion restriction. Recently, some research groups have achieved much progress in attempts to assemble primary nano zeolite crystals into mesoporous structures. For examples, Pinnavaia's group prepared aluminosilicate MSUs from the seed solutions of zeolites Y, β, and ZSM-5,8,9 Xiao's group prepared mesoporous aluminosilicates from preformed zeolite precursors in both alkaline and acidic media,10–12 and Bao's group prepared a Y-faujasite nanocluster assembled mesoporous shell on a kaolin core using cetyltrimethylammonium bromide as template.13 In addition, zeolite constructed capsules or hollow fibers were also reported.14–20
Cracking over zeolite component tends to be gasoline selective.7,21 As zeolite content is increased, both activity and selectivity tend to increase.4,22,23 Therefore, high zeolite content in microspheres is highly desirable as well. Although in situ microspheres with a Y-faujasite content higher than 60% have been sporadically reported in patents, 21,24 the current commercial catalysts have a Y-faujasite content of 30–40%, presumably because those catalysts with a higher Y-faujasite content did not meet other industrially acceptable characteristics.
In order to be commercially successful, the FCC catalyst must have commercially acceptable activity, selectivity, hydrothermal stability, attrition resistance, size distribution, anti-contamination ability from heavy metals and so on. Generally, an improvement in one of these characteristics is frequently accompanied by adverse consequences to one or more of the other characteristics.7 A practical effect of this phenomenon is that compromises must be made regarding conflicting catalytic and physical characteristics of the catalyst. Therefore, it is important for the in situ crystallized FCC microspheres to meet all of the other requirements as the porosity and Y-faujasite percentage are enlarged.
Polymer-like organics have been widely used as templates to form mesopores in a matrix of silica and/or alumina, where organics were burned and removed.25–28 Liu et al. reported that polyvinyl pyrrolidone or polyvinyl alcohol was used as a template to create pores in the in situ FCC microspheres.29 In this paper, a new method was developed to enlarge porosity and Y-faujasite percentage of the in situ crystallized FCC microspheres by introducing to the kaolin clay a lab made porosity enlarging agent (PEA), a chemically and physically pretreated coconut shell filled with NaHCO3. Coconut shell behaves as a template to produce pores during subsequent calcination. Moreover, the total porosity could be enlarged by the evolved carbon dioxide due to decomposition of sodium bicarbonate loaded into pores of coconut shell as illustrated in Scheme 1. In this strategy, the in situ crystallized microspheres have a Y-faujasite content of over 60% and a specific surface area of over 400 m2 g−1 compared to a Y-faujasite content of ∼35% and a specific surface area of 200–300 m2 g−1 for presently commercial catalysts.
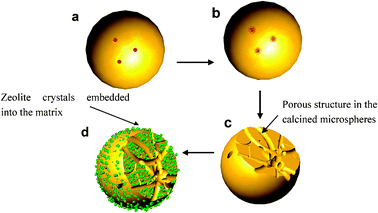 | ||
| Scheme 1 Formation process of pores and Y-faujasite crystals in a microsphere. (a) a spray drying microsphere containing porosity enlarging agent (PEA), (b) the PEA evolved CO2 upon calcination at a high temperature, (c) the evolved CO2 enlarged the total porosity of the calcined microsphere, (d) Y faujasite crystals generated in the walls of the in situ crystallized microsphere. | ||
2. Experimental
2.1. Materials
The kaolin clay was purchased from the China Kaolin Corporation, and its properties and chemical composition are listed in Table S1 (ESI†). NH4NO3, NaHCO3, NaOH and Al(OH)3 powder were C.P. grade, purchased from Shanghai Chemical Reagent Co. China. Na2SiO3 solution (27.57 wt% of SiO2, 9.61 wt% of Na2O) was bought from Shanghai Xinda Chem. Co. China, La(NO3)3·6H2O (98.5 wt%) was from Gansu Rare Earth New Material Co. China.2.2. Preparation of the sodium aluminate solution
The NaAlO2 solution was prepared by gently adding 29.5 g of aluminum hydroxide powder to 363.5 g of 30.0 wt% sodium hydroxide aqueous solution under stirring, then heating to 105 °C and refluxing for 2 h. The resulting solution was clear in appearance with a composition of 3.17 wt% Al2O3 and 21.12 wt% Na2O.2.3. Preparation of porosity enlarging agent (PEA)
The dried Hainan coconut shells were mechanically grinded to 3–4 mm, then completely wetted by 1 wt% sodium hydroxide solution and dried at 50 °C in an oven, subsequently annealed under a nitrogen atmosphere at 580 °C for 1 h in a tubular furnace. The resulting porous and brittle solid was milled into powder. The powder was then impregnated with 3 M sodium bicarbonate and dried at 50 °C for 5 h, which was repeated three times. The product is used as a porosity enlarging agent (PEA).2.4. Preparation of NaY initiator (crystal seeds)
Two kinds of NaY initiators, a clear solution and a cloudy solution, were separately prepared. The clear initiator solution was prepared as follows: 155.5 g of sodium silicate solution, 16.3 g. of H2O and 4.6 g of 28 wt% sodium hydroxide solution were mixed to make a sodium metasilicate solution, to which 122.3 g of sodium aluminate solution was slowly added under stirring. The mixture was stirred for 15 min., and aged for about 16 h at 32 °C. The resulting solution was clear in appearance with a molar composition of 17.72Na2O·17.43SiO2·Al2O3·313.6H2O. The cloudy initiator was prepared by a similar method. The sodium metasilicate solution was prepared by mixing 136.0 g of sodium silicate solution and 40.0 g of H2O, to which 124.0 g of sodium aluminate solution was slowly added under stirring. The mixture was stirred for 20 min. and aged for about 16 h at 32 °C. The aged mixture was cloudy in appearance with a molar composition of 16.4Na2O·15.0SiO2·Al2O3·320H2O.2.5. Preparation of in situ FCC catalysts
Fig. S1 (ESI†) schematically depicts a typical preparation procedure for in situ FCC catalyst. Firstly, a slurry was prepared with a recipe of 1170 g of raw kaolin clay, 72.5 g of sodium silicate solution, 80 g of clear initiator solution, 42.3 g of 28 wt% sodium hydroxide solution, 30 g of PEA, and ∼1600 g of deionized water. It was spray dried to make microspheres. The spray drying microspheres were annealed at 850 °C for 2 h to convert to metakaolin microspheres (MMS), and at 960 °C for 2 h to get a spinel form (SMS).To in situ synthesize Y-faujasite containing microspheres, a mixture with an optimum recipe of 400 g of MMS, 600 g of SMS, 1700 g of sodium silicate solution (27.57 wt% of SiO2), 150 g of 24 wt% sodium hydroxide solution and 500 g of cloudy initiator solution, was hydrothermally crystallized at 95 °C for 24 h. The product, i.e. in situ crystallized microspheres (CMS), was vacuum filtered and washed with deionized water. The CMS was subsequently ion exchanged one time with 1.5 M of NH4NO3 solution and two times with rare earth lanthanum metal ions at a pH of 3.5. Upon each ion exchange with rare earth ions, the CMS was treated with 100% water vapor at 800 °C for 2 h. Finally, the samples were treated again with 1.5 M of NH4NO3 solution.
2.6. Characterization
The crystallinity of all samples was determined by powder X-ray diffraction (Bruker-AXS) employing Ni-filtered Cu-Kα radiation. Y-faujasite content in the CMS was determined by relative zeolite diffraction intensities, equivalent to the ASTM standard test method (Designation D3906-80). The BET surface area was measured using N2 adsorption–desorption (Bechman-Coulter SA-3100) and the pore sizes were calculated using the branch of desorption curves based on the Barrett-Joyner-Halenda (BJH) model. The morphology of microspheres was evaluated by scanning electron microscopy (Hitachi-3000N) from Au/Pd coated samples. Size distribution of the microspheres was determined by laser particle size analyzer (Winner 2000, Jinan Winner Particle Technology Co., China). The attrition index (AI) was determined using a tube attrition tester (Shenyang Analysis Instrument Co., China). Pyridine adsorption experiments were conducted on NexsusTM (Nicolet). 18 mg of pure samples were pressed into self-supported pallet with a diameter of 16 mm. Samples were dehydrated at 400 °C for 2 h under a vacuum of 10−4 Torr, followed by adsorption of purified pyridine vapor at room temperature for 20 min. Physically adsorbed pyridine was removed by an Ar flow at the same temperature. The samples were successively outgased for 1.5 h at 200, 300 and 400 °C. After each treatment, the IR spectra were recorded. NH3-TPD experiments were carried out through the following process: 0.3000 g of sample was heated at 500 °C for 2 h under a vacuum of 10−4 Torr. Ammonia was adsorpted at room temperature for 30 min, and then the temperature was raised at a rate of 25 °C min−1 to 700 °C in 40 ml min−1 of helium flow. The desorbed NH3 was analyzed by GC using the external standard method to calculate the amount of acid sites on the samples.2.7. Assessment of catalytic cracking activity
All catalysts were evaluated in a small laboratory fixed fluidized bed (FFB) device as shown in Fig. S2 (ESI†). The catalysts were treated by 100% water vapor at 800 °C for 10 h before assessment. The oil feedstock was a mixture of 70 wt% of vacuum gas oil (VGO) and 30 wt% of vacuum tower bottom (VTB). The composition and physical properties of the feedstock are shown in Table S2 (ESI†). The catalytic cracking was carried out at 520 °C with a catalyst loading of 180 g. The catalyst to oil ratio was 6, and the space velocity of the air flow was 19 h−1. The cracking products were analyzed with an Agilent gas chromatograph equipped with a flame ionization detector. Coke was assessed by a programmed temperature oxidation method, in which carbonaceous materials are burnt off, and the subsequently generated carbon oxides are converted over sponge Ni catalyst to methane that quantified by a FID detector of chromatography. The reaction products were defined as following: dry gas (C1–C2), LPG (C3–C4), gasoline (C5-210 °C), LCO (210–330 °C), bottoms (over 330 °C) and coke.3. Results and discussion
3.1. Porosity enlarging agent (PEA)
The physically and chemically treated coconut shell has an average size of 500 nm as observed in Fig. S3 (ESI†). The distribution of pore volume with respect to pore size is displayed in Fig. S4 (ESI†), which shows that a large fraction of pores have a size in the range of 15 to 75 nm. The N2 absorption test revealed that the pretreated coconut shell has a pore volume of 0.404 cm3 g−1 and a BET specific surface area of 773.2 m2 g−1. The porous coconut shell, impregnated with a 3 M sodium bicarbonate solution three times, has a mass ratio of 0.33 to sodium bicarbonate. Such a sodium bicarbonate loading coconut shell was used as porosity enlarging agent (PEA) to be added to the slurry for preparation of the spray drying microspheres.3.2. Calcined microspheres
Kaolinite is a clay mineral with a chemical composition of Al2Si2O5(OH)4.30 It has a layered structure, with one sheet of tetrahedral silica linked through oxygen atoms to one sheet of octahedral alumina. Raw kaolinite is chemically inert under the in situ crystallization conditions. Kaolin-type clays undergo a series of phase transformations upon thermal treatment in air at atmospheric pressure. The X-ray diffraction (XRD) patterns shown in Fig. 1 reveal a change in the crystalline phase of the kaolin with the annealing temperature. Endothermic dehydroxylation begins at ∼600 °C to produce disordered metakaolin, Al2Si2O7, but continuous loss of hydroxyl groups up to 850 °C leads to gradual oxolation of the metakaolin. Metakaolin is not a simple mixture of amorphous silica (SiO2) and alumina (Al2O3), but rather a complex amorphous structure that retains some long-range order due to stacking of its hexagonal layers (Al2Si2O7).31 Metakaolin provides active tetrahedral Al as the “nutrient” to synthesize zeolite. Further heating to 950 °C converts metakaolin to a defect aluminium–silicon spinel, Si3Al4O12. The spinel kaolin contains amorphous SiO2, chemically reactive in the in situ crystallization.32 Upon calcination to ∼1050 °C, the spinel phase (Si3Al4O12) nucleates and transforms to inert components, mullite (3Al2O3·2SiO2) and highly crystalline cristobalite (SiO2).33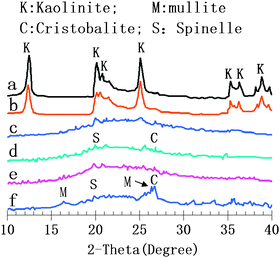 | ||
| Fig. 1 The XRD patterns of (a) the spray drying microspheres, (b)–(f) the calcined microspheres annealed for 2 h at 650, 750, 850, 950 and 1050 °C, respectively. | ||
It is to be noted that the metakaolin and spinel kaolin are Al2O3 and SiO2 active, respectively, and provide “nutrients” to grow zeolite. The inert components of the calcined microspheres compose the matrix of the microspheres. The active SiO2 and Al2O3 contents in the calcined kaolin can be expressed by alkali solubility and acid solubility, respectively, which were measured according to the procedure described in literatures.24,34 The association between the amounts of active SiO2 or Al2O3 and the calcination temperature was investigated in the range of 550–1000 °C. Fig. 2 shows that the active Al2O3 content increased first and reached a peak value of 28% at 850 °C, then decreased with the annealing temperature. Whereas, the active SiO2 content increased slowly when the annealing temperature was lower than 850 °C, and significantly increased in the range of 850–960 °C. When the annealing temperature was 960 °C, the active SiO2 content reached a maximum of 32%. High contents of the active SiO2 and Al2O3 are beneficial to improve the zeolite percentage in the crystallized microspheres Al2O3 active microspheres (MMS) and SiO2 active microspheres (SMS) were prepared by annealing the spray drying microspheres at 850 °C and 960 °C, respectively. Table 1 summarises the surface area and pore volume data of MMS and SMS. Samples MMS-1 and SMS-1, prepared using 3 wt% of PEA, markedly have a bigger micropore volume, total pore volume and BET surface area than the corresponding samples MMS-0 and SMS-0 prepared without PEA, because the evolved CO2 by calcining the PEA promoted the development of pores, as well as its template effect. It can be found that SMS had a slightly lower surface area and pore volume than the corresponding MMS, probably due to the crystalline transformation at 960 °C.
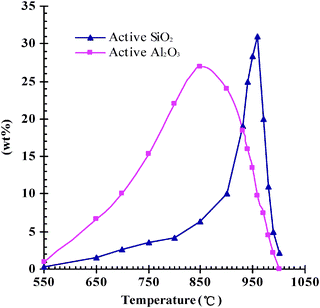 | ||
| Fig. 2 The contents of the active SiO2 and Al2O3 in the microspheres annealed at different temperatures. | ||
| Samples | PEA (wt%) | Annealing T/°C | BET Surface area (m2 g−1) | P.V. (mL g−1) | |
|---|---|---|---|---|---|
| Microporea (<2.5 nm) | Totalb | ||||
| a Measured by N2 adsorption–desorption method. b Measured by CCl4 adsorption method. | |||||
| MMS-0 | 0 | 850 | 10.2 | 0.009 | 0.134 |
| MMS-1 | 3 | 850 | 14.5 | 0.021 | 0.226 |
| SMS-0 | 0 | 960 | 9.0 | 0.006 | 0.127 |
| SMS-1 | 3 | 960 | 11.6 | 0.018 | 0.219 |
3.3. In situ crystallized microspheres (CMS)
Active Al2O3 in MMS and active SiO2 in SMS would be dissolved in the alkali solution and behave as reactants in the in situ hydrothermal synthesis. The Si/Al ratio in the calcined kaolin microsphere is too low to synthesize Y-faujasite, so sodium silicate was introduced as a reinforcing silicon source prior to hydrothermal synthesis. In the present work, sample CMS-1 was prepared using MMS-1 and SMS-1 as the reactants. Similarly, sample CMS-0 was prepared using MMS-0 and SMS-0.XRD patterns shown in Fig. 3 confirm that Y-faujasite crystal phase formed in the in situ synthesized samples CMS-1 and CMS-0. The Y-faujasite content in CMS is determined by the technique described in the ASTM standard test method (Designation D3906-80) using relative diffraction intensities. The intensity of the strongest peak at 2θ = 23.8° was used to evaluate the relative crystallinity of the Y-faujasite.35 It can be seen in Table 2 that the samples CMS-1 had a Y-faujasite content of 60.3 wt%, much higher than 32.5 wt% for the sample CMS-0. A significant reason for it is that more porous structures of MMS-1 and SMS-1 provided more accessible sites to react with sodium hydroxide, leading to dissolution of greater amounts of soluble silica and alumina from the pore wall of the calcined microspheres. Therefore, the in situ crystallization process also resulted in the formation of more pores in the inert alumina–silica residue, i.e., matrix. Table 2 shows that the sample CMS-1 had a specific surface area of 406 m2 g−1, and total pore volume of 0.462 mL g−1, much bigger than those for the sample CMS-0. Comparatively, the in situ microspheres templated with pyrrolidone or polyvinyl alcohol had a specific surface area of 363.7 m2 g−1, and total pore volume of 0.39 mL g−1.29 It is known that these meso- and macropores are very important, and provide more accessible active sites for resid cracking.6 Furthermore, this architecture effectively shortens the secondary diffusion of the cracked primary products to the Y-faujasite crystals, leading to more effective utilization of zeolite, a higher bottoms conversion to desired products and less over cracking to coke and gas.
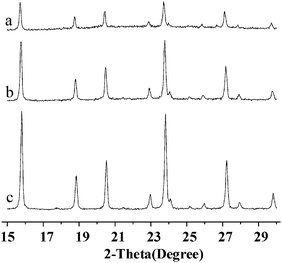 | ||
| Fig. 3 XRD Patterns of (a) CMS-0, (b) CMS-1 and (c) NaY reference samples. | ||
Fig. 4 displays the SEM images of CSM-1 and CSM-0. The high-magnification SEM images shown in Fig. 4b and d display the Y-faujasite crystals that densely packed on the surface of the microspheres. Interestingly, it can be clearly observed that many macropores exist on the surface of the spheres. Compared to the image of CSM-0 in Fig. 4d, the image of CSM-1 in Fig. 4b displays more dense macropores. It is likely that more amounts of active silica and alumina in MMS-1 and SMS-1 were dissolved and transformed to zeolite in the in situ crystallization process, which is consistent with the results analyzed by N2 adsorption-desorption and XRD patterns.
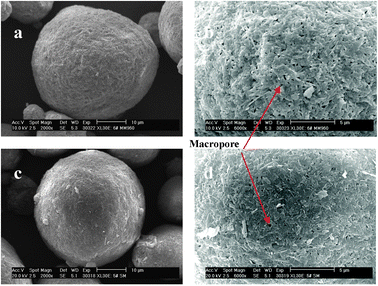 | ||
| Fig. 4 SEM images of (a) and (b) for the sample CMS-1, (c) and (d) for the sample CMS-0. | ||
3.4. FCC catalysts
To determine the catalytic properties, the in situ crystallized microspheres (CMS) were subjected to ion exchanges with NH4NO3 solution and rare earth lanthanum metal ions. Two catalysts were investigated in this report. The catalyst CAT-1 and CAT-0 were prepared on the basis of CSM-1 and CSM-0, respectively. Their chemical compositions and physical characteristics are listed in Table S3 (ESI†). The two catalysts have a very close chemical composition. They have a wide and continuous particle size distribution, which is important to improve the chemical conversion efficiency in the fluidization process.36,37 Usually, high zeolite content would decrease its attrition resistance.4,6 However, CAT-1 with a higher Y-faujasite content has an attrition index of 2.2% h−1, close to that of CAT-0. Attrition index is a very important characteristic for a catalyst to be applied in industry. The commercial FCC catalysts have an attrition index less than 3.5% h−1. Its measurement was illustrated in the supporting information as seen in Fig. S5 (ESI†).The acidities on the CAT-0 and CAT-1 surface were measured by FT-IR spectroscopy of adsorbed pyridine. Fig. 5 shows the IR spectra of pyridine adsorbed at 200 °C in the wavenumber region of 1600–1400 cm−1. The band at 1540 cm−1 corresponds to Brønsted acid sites in the zeolite, and the band at 1450 cm−1 to Lewis sites. The band at 1490 cm−1 has been known as a combination of the two kinds of acidic sites.38–40 The acid strength distributions of both catalysts were quantitatively calculated from the results of IR spectra at 200, 300 and 400 °C, corresponding to weak, medium, and strong acid sites, respectively. The results were listed in Table 3. It can be seen that the weak acid amount, strong acid amount, total acid amount and B/L ratio for CAT-1 were higher than those for CAT-0. The more amount of Brønsted acid is favorable to resid cracking.4Fig. 6 shows the NH3-TPD curves of both catalysts. The samples had been ion exchanged before measurement. Apparently, both catalysts have three desorption peaks at ∼190, 300 and 430 °C, corresponding to weak, medium and strong acid sites, respectively.4,13
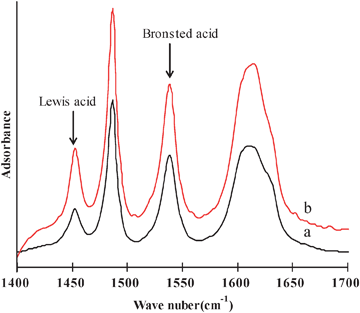 | ||
| Fig. 5 FT-IR spectra of pyridine adsorbed catalysts at 200 °C, (a) CAT-0, (b) CAT-1. | ||
| Samples | Acidity (A cm2 g−1) | |||||||||
|---|---|---|---|---|---|---|---|---|---|---|
| Brønsted | Lewis | Total | B/L | |||||||
| 200 °C | 300 °C | 400 °C | 200 °C | 300 °C | 400 °C | 200 °C | 300 °C | 400 °C | ||
| CAT-0 | 19.10 | 16.96 | 13.65 | 12.02 | 6.20 | 4.67 | 31.12 | 23.16 | 18.32 | 2.17 |
| CAT-1 | 22.48 | 19.40 | 15.50 | 11.76 | 5.58 | 3.22 | 34.24 | 24.98 | 18.72 | 2.80 |
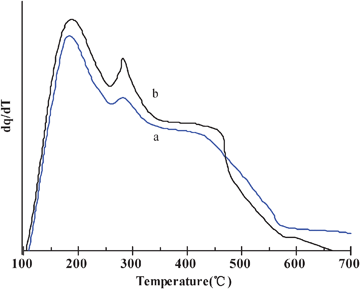 | ||
| Fig. 6 NH3-TPD curves of catalysts, (a) CAT-0, (b) CAT-1. | ||
Hydrothermal stability of the catalysts was assessed by activities of catalysts after hydrothermal treatment. Fig. 7 shows the catalyst activities with different hydrothermal treating time. Apparently, CAT-1 displayed a higher activity than CAT-0 for the same treatment time, although the activities of the catalysts decreased with the treatment time. Besides in situ crystallization, another general technique has been used to prepare fluid catalytic cracking catalysts as well. The zeolitic component is crystallized first and then incorporated into microspheres in a separate step. To compare with such a catalyst, a commercial catalyst CC-15 was used as a reference sample. The catalyst CC-15, produced in Changling, China, has a zeolite content of 35%, specific surface area of 250 m2 g−1 and pore volume of 0.35 mL g−1. It has a B/L ratio of 2.05, and its pyridine adsorbed IR spectra is shown in Fig. S6 (ESI†). Under the same measurement conditions, CAT-1 also presented a better activity than CC-15. A higher zeolite content and a higher pore volume of CAT-1 might contribute to the higher activity.
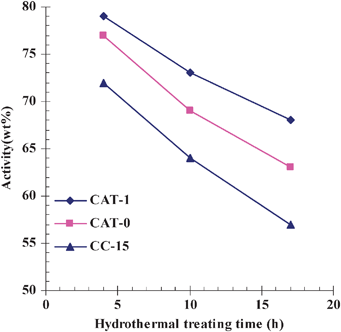 | ||
| Fig. 7 Effect of hydrothermal treating time on activities of the catalyst CAT-0, CAT-1 and the commercial catalyst CC-15. Activity determination of catalysts was carried out at 460 °C with a catalyst loading of 5.0 g. The standard oil for activity determination was light diesel with a distillation range of 235–337 °C. Activity% = (Gasoline with a distillation temperature lower than 216 °C + coke + gas)/the total feedstock × 100%. | ||
3.5. Catalytic cracking tests in a fixed fluidized bed (FFB)
The catalytic cracking tests were performed over CAT-0 and CAT-1. The catalysts were treated with 100% water vapor at 800 °C for 10 h before assessment. The results are listed in Table 4. CAT-1, prepared using PEA, showed a better catalytic activity with a conversion of 77.32 wt%, compared with 67.47 wt% over CAT-0 that was prepared without using PEA. The higher activity could be attributed to the higher zeolite content, more porosity and the higher specific surface area. A high catalytic activity would be of benefit to a recently developed FCC reactor which reduced the contact time between the catalyst and the feedstock for the purpose of minimizing coke and dry gas selectivities. For a given feedstock, the composition of products also reflects properties of a catalyst. Generally speaking, cracking activity and gasoline selectivity do not improve simultaneously.6 If the high activity results in a high level of conversion to coke and dry gas at the expense of gasoline, the catalyst will have a limited utility. However, in this case, it is evident that CAT-1 had higher selectivities to gasoline and light oil than CAT-0, and only a very slight increase was observed in the selectivities to dry gas and coke over the more active CAT-1. It has been thought that the dry gas and coke are yielded in the secondary reaction,41–43 because of the diffusion restriction of the product molecules. Therefore, the more porous CAT-1 accelerated the diffusion of the product molecules, and thus decreased the massive formation of dry gas and coke.| Catalysts | CAT-0 | CAT-1 |
|---|---|---|
| a The catalytic cracking temperature was 520 °C, the ratio of catalyst to oil was 6, catalyst loading was 180 g, and an air speed was 19 h−1. The feedstock consisted of 70 wt% VGO and 30 wt% VTB. | ||
| Conversion, wt (%) | 67.47 | 77.32 |
| Selectivities, wt (%) | ||
| LPG (C3 + C4) | 12.46 | 14.41 |
| Gasoline (C5–210 °C) | 45.90 | 53.48 |
| LCO (210–330 °C) | 21.87 | 16.52 |
| Bottoms (>330 °C) | 9.79 | 5.20 |
| Liquid yield (LPG, gasoline and LCO) | 80.23 | 84.41 |
| Light oil (gasoline and LCO) | 67.77 | 70.00 |
| Dry gas | 2.15 | 2.24 |
| Coke | 6.96 | 7.19 |
| Loss | 0.87 | 0.96 |
4. Conclusions
A porosity enlarging agent (PEA) can effectively enhance the porosity of the calcined microspheres via the evolved carbon dioxide upon heating. Hence, more reactive SiO2 and Al2O3 were accessible to sodium hydroxide in the process of the in situ crystallization. Dissolution of greater amounts of silica and alumina generated more Y-faujasite crystals and also promoted development of porous structure. Moreover, the resulting FCC catalyst was demonstrated to exhibit similar and/or enhanced commercially acceptable activity, selectivity, hydrothermal stability, attrition resistant, size distribution and so on. Therefore, it is a prospective catalyst for cracking petroleum feedstocks, particularly under a short residence time of less than 3 s for the newer riser reactor, because high porosity and high Y-faujasite percentage may enhance the catalytic activity by eliminating diffusion restriction and providing more active sites. The method should have further applications in the preparation of other in situ crystallized zeolites.Acknowledgements
The authors would like to acknowledge the National Natural Science Foundation of China (Grant No. 21063006), the Natural Science Foundation of Hainan (Grant No.210012), the Scientific Research Foundation for the Returned Overseas Chinese Scholars, and Hainan University for financing this work.References
- M. Xu, M. Cheng, X. Liu, D. Tan and X. Bao, J. Mater. Chem., 1999, 9, 2965 RSC.
- M. Xu, M. Cheng and X. Bao, Chem. Commun., 2000, 1873 RSC.
- P. Gelin and C. Gueguen, Appl. Catal., 1988, 38, 225–233 CrossRef CAS.
- H. Liu, J. Ma and X. Gao, Catal. Lett., 2006, 110, 229 CrossRef CAS.
- A. G. Oblad, Oil Gas J., 1972, 70, 84 CAS.
- M. Xu, M. Stockwell, WO Pat., 103558, 2004 Search PubMed.
- S. M. Brown, V. A. Durante, W. J. Reagan and B. K. Speronello, US pat., 4493902, 1985 Search PubMed.
- Y. Liu, W. Zhang and T. J. Pinnavaia, J. Am. Chem. Soc., 2000, 122, 8791 CrossRef CAS.
- Y. Liu, W. Zhang and T. J. Pinnavaia, Angew. Chem., Int. Ed., 2001, 40, 1255 CrossRef CAS.
- Y. Han, S. Wu, Y. Sun, D. Li, F. Xiao, J. Liu and X. Zhang, Chem. Mater., 2002, 14, 1144 CrossRef CAS.
- Z. Zhang, Y. Han, F. Xiao, S. Qiu, L. Zhu, R. Wang, Y. Yu, Z. Zhang, S. Zou, Y. Wang, H. Sun, D. Zhao and Y. Wei, J. Am. Chem. Soc., 2001, 123, 5014 CrossRef CAS.
- Z. Zhang, Y. Han, L. Zhu, R. Wang, Y. Yu, S. Qiu, D. Zhao and F. Xiao, Angew. Chem., Int. Ed., 2001, 40, 1258 CrossRef CAS.
- Q. Tan, X. Bao, T. Song, Y. Fan, G. Shi, B. Shen, C. Liu and X. Gao, J. Catal., 2007, 251, 69 CrossRef CAS.
- V. Valtchev, B. J. Schoeman, J. Hedlund, S. Mintova and J. Sterte, Zeolites, 1996, 17, 408 CrossRef CAS.
- Y. J. Wang, Y. Tang, X. D. Wang, W. L. Yang and Z. Gao, Chem. Lett., 2000, 29, 1344 CrossRef.
- W. Song, R. Kanthasamy, V. H. Grassian and S. C. Larsen, Chem. Commun., 2004, 1920–1921 RSC.
- C. Xiong, D. Coutinho and K. J. Balkus, Jr., Microporous Mesoporous Mater., 2005, 86, 14 CrossRef CAS.
- A. Dong, Y. Wang, D. Wang, W. Yang, Y. Zhang, N. Ren, Z. Gao and Y. Tang, Microporous Mesoporous Mater., 2003, 64, 69 CrossRef CAS.
- R. Kanthasamy, K. Barquist and S. C. Larsen, Microporous Mesoporous Mater., 2008, 113, 554 CrossRef CAS.
- L. B. Dight, D. C. Bogert, M. A. Leskowicz, US Pat., 5023220, 1991 Search PubMed.
- S. M. Brown, V. A. Durante, W. J. Reagan and B. K. Speronello, US Pat., 4493902, 1985 Search PubMed.
- C. V. McDaniel, R. W. Baker and C. A. Rundell, US Pat., 3595611, 1971 Search PubMed.
- H. W. Beck, J. D. Carruthers, E. B. Cornelius, R. A. Kmecak, S. M. Kovach and W. P. Hettinger Jr., US Pat., 4480047, 1984 Search PubMed.
- L. B. Dight, M. A. Leskowicz and D. C. Bogert, EU Pat., 0369629, 1990 Search PubMed.
- D. Zhao, J. Sun, Q. Li and G. D. Stucky, Chem. Mater., 2000, 12, 275 CrossRef CAS.
- J. S. Lettow, Y. Han, P. Schmidt-Winkel, P. Yang, D. Zhao, G. D. Stucky and J. Y. Ying, Langmuir, 2000, 16, 8291 CrossRef CAS.
- C. Xiong, A. E. Aliev, B. Gnade and K. J. Balkus, Jr., ACS Nano, 2008, 2, 283 CrossRef.
- C. Xiong, M. Kim and J. K. J. Balkus, Jr., Small, 2006, 2, 52 CrossRef CAS.
- H. Liu, Y. Wang, L. Yan, M. He, CN Pat., 102019196A, 2011 Search PubMed.
- S. Zheng, S. Sun, Z. Zhang, X. Gao, X. Xu and Bull, Catal. Soc. Indian, 2005, 4, 12 Search PubMed.
- H. Wang, C. Li, Z. Peng and S. Zhang, J. Therm. Anal. Calorim., 2011, 105, 157 CrossRef CAS.
- A. Madani, A. Aznar, J. Sanz and J. M. Serratosa, J. Phys. Chem., 1990, 94, 760 CrossRef CAS.
- J. Rocha and J. Klinowski, Angew. Chem., 1990, 102, 539 CrossRef CAS.
- H. Feng, C. Li and H. Shan, Catal. Lett., 2009, 129, 71 CrossRef CAS.
- H. Liu, H. Zhao, X. Gao and J. Ma, Catal. Today, 2007, 125, 163 CrossRef CAS.
- G. Sun and J. R. Grace, Chem. Eng. Sci., 1990, 45, 2187 CrossRef CAS.
- J. R. Grace and G. Sun, Can. J. Chem. Eng., 1991, 69, 1126 CrossRef CAS.
- Y. Li, W. Xie and S. Yong, Appl. Catal., A, 1997, 150, 231 CrossRef CAS.
- N. Y. Topsoe, K. Pedersen and E. G. Derouane, J. Catal., 1981, 70, 41 CrossRef CAS.
- J. Datka, Z. Piwowarska, J. Rakoczy and B. Sulikowski, Zeolites, 1988, 8, 199 CrossRef CAS.
- A. Devard, G. Puente, F. Passamonti and U. Sedran, Appl. Catal., A, 2009, 353, 223 CrossRef CAS.
- E. Tangstad, T. Myrstad, A. I. Spjelkavik and M. Stöcker, Appl. Catal., A, 2006, 299, 243 CrossRef CAS.
- O. Bayraktar and E. L. Kugler, Appl. Catal., A, 2004, 260, 119 CrossRef CAS.
Footnote |
| † Electronic supplementary information (ESI) available. See DOI: 10.1039/c1cy00305d |
| This journal is © The Royal Society of Chemistry 2012 |
