Improvement of nano-particulate CexZr1−xO2 composite oxides supported cobalt oxide catalysts for CO preferential oxidation in H2-rich gases†
Zhongkui
Zhao
*a,
Xiaoli
Lin
a,
Ronghua
Jin
a,
Yitao
Dai
a and
Guiru
Wang
b
aState Key Laboratory of Fine Chemicals, Department of Fine Chemicals, School of Chemical Engineering, Dalian University of Technology, 2 Linggong Road, Dalian 116024, China. E-mail: zkzhao@dlut.edu.cn
bDepartment of Catalytic Chemistry and Engineering, School of Chemical Engineering, Dalian University of Technology, 2 Linggong Road, Dalian 116024, China
First published on 5th December 2011
Abstract
The Co3O4/CexZr1−xO2 is a potential catalyst for CO preferential oxidation (CO PROX) in excess hydrogen. This study is devoted to the optimization of the nano-particulate CeO2–ZrO2 supported cobalt oxide catalysts. The effects of Ce/(Ce + Zr) atomic ratio, Co3O4 loading, calcination temperature, as well as reaction conditions like addition of CO2 and H2O, gas hourly space velocity (GHSV) and O2 concentration on the catalytic properties were investigated. Moreover, the temperature programmed reduction (TPR) and the powder X-ray diffraction (XRD) techniques were used to reveal the relationship between catalyst nature and catalytic properties. Results demonstrate that the catalytic performance of Co3O4/CexZr1−xO2 catalysts is strongly dependent on the H2 uptake, reduction temperature and crystallite size affected by Ce/(Ce + Zr) atomic ratio, cobalt oxide loading and calcination temperature. It is also found that the developed catalyst possesses high catalytic stability, and no obvious decrease in either CO conversion or CO2 selectivity can be observed even with the existence of CO2 and H2O in the feed. 16 wt.%Co3O4/Ce0.85Zr0.15O2 calcined at 450 °C could be a promising catalyst for the CO PROX reaction to eliminate trace CO from H2-rich gas.
Introduction
The fuel cell is a new, efficient and environmentally friendly power generation apparatus using hydrogen as the fuel (the only product is water). It can be considered as the most attractive method for power generation in the 21st century.1 Proton exchange membrane fuel cells (PEMFCs) with a number of advantages of high energy density of work, long working life, fast response and low operating temperature have become widely accepted.2 Hydrogen is used as a fuel in the PEMFC system, whose production is mainly through coal gasification,3 natural gas reforming4 or partial oxidation5etc., and then it can be implemented by water-gas shift (WGS) to obtain pure H2.3 Nevertheless, restricted by the reaction thermodynamic and kinetic of WGS, the received H2 contains 40–75 vol.% H2, 10–25 vol.% CO2, 10–20 vol.% H2O, and 0–25 vol.% N2 and 0.5–1.0 vol.% CO. The anode of a PEMFC is very sensitive to CO content in the feed due to poisoning. Therefore, the CO content in the stream must be reduced to below 10 ppm for Pt anode and below 100 ppm for CO-tolerant alloy anodes before feeding.6 Several methods for CO elimination have been studied including purification with membrane, CO PROX reaction, and CO methanation. Among all of them, CO PROX reaction is one of the most direct, simple and effective methods to purify H2, thus having been a hot topic in the catalysis domain.7,8 A CO PROX reaction unit can be attached to a Fuel Cell (typically working at 80 °C) or to a WGS reactor (typically being operated at 200–250 °C), and it can be a medium unit between a Fuel Cell and a WGS reactor. As a satisfactory catalyst for CO PROX reaction, the high CO conversion and O2 selectivity to CO2 within a wide operation temperature window, besides high H2O and CO2 tolerance are required.9–11Nowadays, many reports in CO PROX reaction have focused on precious metals, such as Pt, Au, Ru, Pd and Rh and so on.12–14 Among these, both Pt and Au catalysts were most extensively and deeply investigated. Compared with Pt, the Au catalyst exhibited better catalytic performance, like a lower operating temperature and higher selectivity. Therefore many people have paid more attention to Au-based catalysts. Au catalysts showed good catalytic properties for the CO PROX reaction in excess hydrogen, but its d-orbital is fully filled with electrons and the outermost orbital half-filled. Thus, Au is a quite chemically inert metal. Only being highly dispersed in nano-scale (<5 nm), it may exhibit a good catalytic activity.15 However, the highly dispersed Au nanoparticles are easily agglomerated, which leads to its inactivity. In addition, the inherent factors, such as the lower reserves and the higher price, limit its application. Thus, replacing them by non-precious metals is mandatory. The Cu based materials have been widely studied.14,16–19 To date, the reports about Cu catalysts used for CO PROX reaction are an endless stream, and many fruitful results have been achieved. However, there are many issues such as the H2O/CO2 tolerance, CO selectivity (a large number of oxygen and H2 consumption) and operation temperature window, etc., that remain to be improved.20 Studies on other non-precious metals than copper are gaining increasing attention. It was found that Co3O4 based catalysts have shown better low-temperature activity, selectivity and H2O resistance than CuOx catalysts.11,21–25
The support effect plays significant roles in enhancing catalytic properties by improving the dispersion of the active component or via strong interaction with the active sites.26 The support effects for the CO PROX reaction were investigated through commercially available carrier supported cobalt catalysts. It showed that support type had significant influence on the catalytic activity, and Co3O4 was the active site for the CO PROX reaction.10 Cerium-containing composites now were used as supports for the Cu-based catalysts,16–20 and also for Co catalysts.20,27,28 The introduction of zirconium into the ceria lattice can improve its thermal stability, redox behavior, and the produced structural defects are responsible for boosting oxygen mobility. As a result, the catalytic properties were improved.29–31 Nowadays, ceria-zirconia composites are widely used as supports to prepare supported Au, Pd and Cu catalysts for CO low temperature oxidation,32–34 and also supported Pt35 and CuO36 for CO PROX reaction. From the references we can see that CeO2 is an excellent oxygen storage material, and the incorporation of the optimum amount of zirconium into the CeO2 matrix can improve the thermal stability of ceria and the mobility of oxygen, which benefits the improvement of the catalytic performance. However, the incorporation of ceria with zirconium didn't always enhance the catalytic performance for CO oxidation. Manzoli and Caputo found introducing zirconium into ceria had no positive effect for this reaction.36,37 It was proposed that the inconsistent conclusions for the CO PROX reaction (either positive or negative effect of doping ceria with zirconium) could originate from the different preparation methods19 and the doping amount of zirconium.31,35 In our previous reports, it was found that, among the nano-particulate Co3O4/NP–CeO2, Co3O4/NP-ZrO2 and Co3O4/NP–CeO2–ZrO2 prepared by a reverse microemulsion (RM)/incipient wetness impregnation (IWI) method, the Co3O4/NP–CeO2–ZrO2 had exhibited higher catalytic activity than that of the other two catalysts. The higher catalytic activity was attributed to the combination effect of the highly dispersed cobalt oxide, the improvement in CeO2 reducibility due to ZrO2 incorporation in CeO2 structures, and the strong cobalt oxide-support interaction.38
In the present paper, the Co3O4/NP–CeO2–ZrO2 catalysts were improved by varying the Ce/(Ce + Zr) atomic ratio, cobalt oxide loading and the calcination temperature. The effects of the addition of CO2 and H2O in the feed, GHSV and O2 concentration on CO PROX reaction were also investigated. The NP–CexZr1−xO2 supported cobalt oxide catalysts with optimum Ce/(Ce + Zr) atomic ratio and loading could be potential catalysts for the CO PROX reaction. Moreover, TPR and XRD techniques were used to reveal the relationship between catalyst nature and catalytic properties for the CO PROX reaction.
Experimental
Preparation of catalysts
A series of nano-particulate CexZr1−xO2 composite oxides (x = 0, 0.25, 0.50, 0.75, 0.80, 0.85, 0.95, 1) were prepared by the RM methods.38 Typically, the microemulsion A was constituted by using the corresponding nitrate salt precursors of cerium and zirconium as the aqueous phase, cyclohexane as the organic phase, NP-10 as the surfactant and 1-hexanol as the co-surfactant. The microemulsion B (which was similar to microemulsion A except for the aqueous phase being replaced by ammonia) was dropwise introduced into microemulsion A under vigorous stirring. The resulting mixture was stirred for 10 h, and then aged overnight. The resulting brown precipitate was filtered, washed with deionized water and following that with ethanol, dried overnight at 105 °C, and then calcined at 450 or 500 °C in air for 5 h.The IWI method was employed to support cobalt oxide over the nano-particulate CeO2–ZrO2 composite oxides prepared via RM method.38 The supported Co3O4 catalysts with different cobalt oxide loadings were prepared by using the cobalt nitrate aqueous solutions with different concentrations. Then they were dried overnight at 105 °C and subsequently calcined at 450 °C in a muffle furnace for 5 h. Moreover, the supported cobalt oxide samples were calcined at different temperatures (400, 450 and 500 °C) to investigate the effects of calcination temperature. The obtained catalysts were named as 16%Co3O4/CZ(Tsup − Tcat), in which, CZ is denoted as the composite oxide Ce0.85Zr0.15O2 prepared by RM method, and Tsup and Tcat were denoted as the calcination temperatures for the support (before cobalt impregnation) and catalyst (after cobalt impregnation), respectively.
Characterization of catalysts
The XRD technique was performed on a Rigaku Automatic X-ray Diffractometer (D/Max 2400) equipped with a Cu-Kα source (λ = 1.5406 Å). The XRD profiles were collected from 5 to 80° at a step of 0.02°. The crystallite parameters were estimated based the Scherrer Formula over multiple characteristic diffraction peaks by the MDI Jade5 software.The H2-TPR was performed in a quartz tube reactor, and a 100 mg sample was used in each measurement. The sample was pretreated in a 2.5% O2 flow (30 mL min−1) at its calcination temperature for 1 h with a heating rate of 10 °C min−1, followed by cooling in an Ar flow (30 mL min−1) to room temperature. After that, a flow of 10% H2/Ar flow (30 mL min−1) was switched into the system and the sample was heated up to 800 °C from 50 °C at a rate of 10 °C min−1. The H2 uptake was detected by a thermal conductivity detector (TCD). In order to quantitatively analyze the H2 uptake, we calibrate the reduction by the quantitative reduction of a given amount of CuO to the metallic copper.19
The CO conversion and the CO2 selectivity were calculated on the basis of the CO and O2 concentrations in the feed and the effluent [CO]in, [CO]out, [O2]in and [O2]out. CO conversion and CO2 selectivity (O2 selectivity to CO2) were calculated on the basis of the equations as follows:
Results and discussion
Effect of Ce/(Ce + Zr) atomic ratio
The redox behavior of ceria can be modified by incorporation of other metal elements, especially zirconium. However, doping the ceria with zirconium didn't always improve the catalytic activity for the CO PROX reaction, and the amount of dopant played a significant role in the catalytic properties. We have prepared a series of 1.8 wt.%Co3O4/CexZr1−xO2 (x = 0, 0.25, 0.50, 0.75, 0.80, 0.85, 0.95 and 1) by RM/IWI method, and studied their nature and catalytic properties for the CO PROX reaction. Fig. 1 presents the CO conversion and CO2 selectivity for the CO PROX reaction over Co3O4/CexZr1−xO2 catalysts with different Ce/(Ce + Zr) atomic ratios. Here we define T50 (the minimum temperature for CO conversion to reach 50%), T90 (the minimum temperature for CO conversion to reach 90%), T100 (the minimum temperature for CO full conversion) and Trange (temperature window for CO conversion being above 90%) for expedient elaboration. The activity rises in the following order: Co3O4/Ce0.25Zr0.75O2 < Co3O4/CeO2 < Co3O4/ZrO2 < Co3O4/Ce0.5Zr0.5O2 < Co3O4/Ce0.75Zr0.25O2 < Co3O4/Ce0.80Zr0.20O2 < Co3O4/Ce0.95Zr0.05O2 < Co3O4/Ce0.85Zr0.15O2. Except for Co3O4/Ce0.25Zr0.75O2, the zirconium-doped CeO2 supported cobalt catalysts are more active than the pure CeO2 and pure ZrO2 supported cobalt ones (Co3O4/CeO2 and Co3O4/ZrO2), when x is 0.85–0.95, especially 0.85. The Co3O4/Ce0.85Zr0.15O2 catalyst exhibits much higher catalytic activity than the others, and also similar CO2 selectivity (the slight lower selectivity over 1.8 wt.%Co3O4/Ce0.85Zr0.15O2 might be ascribed to the higher catalytic activity for both CO and H2 conversion). The T50, T90, T100 and Trange for the CO PROX reaction over Co3O4/Ce0.85Zr0.15O2 are 151 °C, 174 °C, 200 °C and 174–250 °C, respectively. The reaction results show that the optimum Ce/(Ce + Zr) is required for the good catalytic performance over the ceria-zirconia supported cobalt oxide catalysts. From the previous report,30 the specific surface area of ceria-zirconia was less than that of pure ZrO2, but higher than that of pure CeO2, and, as well, decreasing surface area was observed while the Ce content was increased. Therefore, the specific surface area is not the key issue for the best catalytic properties for CO PROX reaction of the Co3O4/CexZr1−xO2 (x = 0.85–0.95) catalysts. Then, the X-ray diffraction and H2-TPR experiments were performed to reveal the interaction between CeO2 and ZrO2 in nano-composite oxide supports, as well as the correlation between the crystalline phase structure, redox behavior and catalytic properties of these catalysts for the CO PROX reaction in excess hydrogen.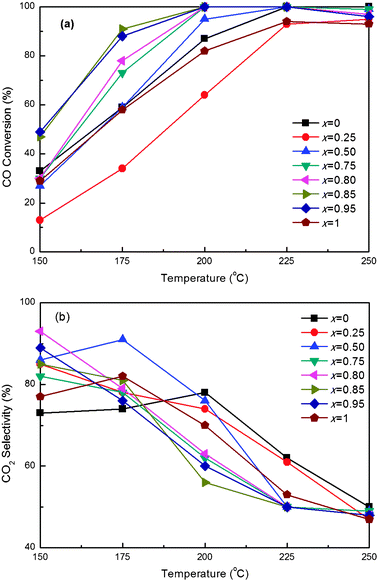 | ||
Fig. 1 Effect of Ce/(Ce + Zr) atomic ratio on (a) CO Conversion and (b) CO2 selectivity for CO PROX reactions over the 1.8 wt.%Co3O4/CexZr1−xO2 catalysts. Operation conditions: GHSV = 15![[thin space (1/6-em)]](https://www.rsc.org/images/entities/char_2009.gif) 000 mL h−1 g−1, 1.0 vol.% CO, 1.0 vol.% O2, 50 vol.% H2 and balance Ar. 000 mL h−1 g−1, 1.0 vol.% CO, 1.0 vol.% O2, 50 vol.% H2 and balance Ar. | ||
The crystalline phases present in pure CeO2, pure ZrO2, and supported cobalt catalysts Co3O4/CexZr1−xO2 (x = 0, 0.25, 0.50, 0.75, 0.80, 0.85, 0.95 and 1) have also been established by XRD patterns, and the results are shown in Fig. 2. The crystalline phases are identified by a comparison with corresponding JCPDS files and ref. 26, 32, 34, and 38.
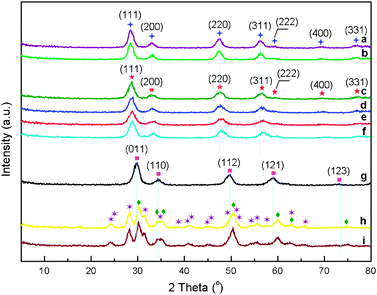 | ||
Fig. 2 X-Ray diffraction patterns of 1.8 wt.%Co3O4/CexZr1−xO2 catalysts with various Ce/(Ce + Zr) atomic ratios: (a) x = 1 (without Co3O4 loading); (b) x = 1.0; (c) x = 0.95; (d) x = 0.85; (e) x = 0.80; (f) x = 0.75; (g) x = 0.25; (h) x = 0; (i) x = 0 (without Co3O4 loading); ( ) fluorite-type cubic CeO2; ( ) fluorite-type cubic CeO2; ( ) fluorite-type cubic CexZr1−xO2 composite oxide; ( ) fluorite-type cubic CexZr1−xO2 composite oxide; ( ) tetragonal CexZr1−xO2 composite oxide; ( ) tetragonal CexZr1−xO2 composite oxide; ( ) monoclinic ZrO2; ( ) monoclinic ZrO2; ( ) tetragonal ZrO2. ) tetragonal ZrO2. | ||
From Fig. 2, no Co3O4 crystalline phase can be observed, and the reason has been provided as above. The XRD patterns of CeO2 and Co3O4/CeO2 correspond to a single cubic fluorite-type crystalline phase (JCPDS: 43-1002) and those of ZrO2 and Co3O4/ZrO2 correspond to both monoclinic (JCPDS: 037-1484) and tetragonal (JCPDS: 050-1089) phases. For ceria-zirconia oxides supported cobalt catalysts Co3O4/CexZr1−xO2 (x = 0.25, 0.50, 0.75, 0.80, 0.85 and 0.95), except for Co3O4/Ce0.25Zr0.75O2 with tetragonal type phase, the fluorite-type cubic phases for the other composite oxides supported cobalt catalysts are observed.32,38 We do not see segregation phenomena for the samples Co3O4/CexZr1−xO2 (x = 0.25, 0.50, 0.75, 0.80, 0.85 and 0.95) in a mixture containing ceria-rich phase and zirconia-rich one, which indicates that the zirconium is fully inserted into CeO2 crystalline matrix (high CeO2 concentration composites) or CeO2 being fully inserted into ZrO2 one (high ZrO2 concentration one) to form single-phase solid solutions. From Table S1 (see ESI†), as the zirconium concentration in Co3O4/CexZr1−xO2 catalysts increases, the lattice parameters of the composites become smaller and smaller, which can be ascribed to the substitution of the bigger Ce4+ (0.97 Å of cation radius) in the composites with the smaller Zr4+ (0.84 Å of cation radius). Moreover, broader diffraction peaks are seen for Co3O4/CexZr1−xO2 catalysts than those for Co3O4/CeO2, which can be due to the distortion of the cubic crystalline phase led by the incorporation of ZrO2, and therefore we can see the decrease in average crystallite size, and the minimum average crystallite size obtained for Co3O4/Ce0.8Zr0.2O2.32–34,36,38 However, the catalyst with minimum crystallite size hasn't exhibited the maximum catalytic activity for the CO PROX reaction.
Generally, the redox behavior is closely correlated to catalytic properties for oxidation reactions. Fig. 3 presents the H2-TPR profiles of Co3O4/CexZr1−xO2 catalysts with various Ce/(Ce + Zr) atomic ratios, and Table S2 gives the quantitative measurement results.† The peaks between 200–400 °C of the catalysts are assigned to the H2 consumption for the reduction of highly dispersed Co3O4 besides some surface reducible CeO2.35 The H2 consumption signal of dashed line 2 can be assigned to the reduction of the reducible CeO2 in bulk phase, and line 3 can be assigned to the reduction of low valent cerium. Compared with CeO2, the reduction of ZrO2 can be negligible, but the ZrO2 doping can promote the reduction of CeO2.35,38 In most cases, the increasing reduction temperature can be observed with the ZrO2-doping amount in the supports being increased, as well as the reducible CeO2 percentage monotonously growing with the increase of Ce/(Ce + Zr) atomic ratio (Table S2†). This indicates the formation of ceria-zirconia solid solution can strengthen the mobility of oxygen and improve the CeO2 reducibility. Although a large percentage of CeO2 can be reduced by the incorporation of zirconium cations into the CeO2 crystalline matrix, the pure support without cobalt can’t effectually catalyze the CO PROX reaction (see ESI, Fig. S3†). The Co3O4/CexZr1−xO2 catalyst with an optimum x value exhibits the best catalytic activity for the CO PROX reaction. Therefore, it is further confirmed that the Co3O4 is the main active species for the CO PROX reaction,10 but the reducible CeO2 also plays a significant role in enhancing this reaction. Co3O4/CexZr1−xO2 (x = 0.85–0.95) can be a promising catalyst for the CO PROX reaction. Typically, the Co3O4/Ce0.85Zr0.15O2 was employed to investigate the effects of cobalt oxide loading, calcination temperature, addition of H2O and CO2 and reaction conditions like O2 concentration, GHSV and time on stream on CO PROX reaction.
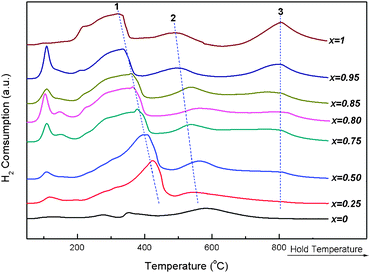 | ||
| Fig. 3 H2-TPR profiles of 1.8 wt.%Co3O4/CexZr1−xO2 catalysts with various Ce/(Ce + Zr) atomic ratios. | ||
Effect of the cobalt oxide loading
From above, the Co3O4/CexZr1−xO2 (x = 0.85–0.95) supported cobalt oxide catalyst with 1.8 wt.% low loading has exhibited promising catalytic properties for the CO PROX reaction in H2-rich gas. From Fig. S3,† the 100% CO conversion over the supported cobalt oxide with 1.8 wt.% of low loading can be obtained at 200 °C, but only 12% of CO conversion over bare ceria-zirconia at this temperature. The CO conversion reaches 38% only if the reaction temperature is increased to 250 °C, and Co3O4 is the main active species for the CO PROX reaction. Herein, the nano-particulate Ce0.85Zr0.15O2 was used to investigate the effect of cobalt oxide loading of Co3O4/Ce0.85Zr0.15O2 on the CO PROX reaction in H2-rich gas. The reaction results are presented in Fig. 4.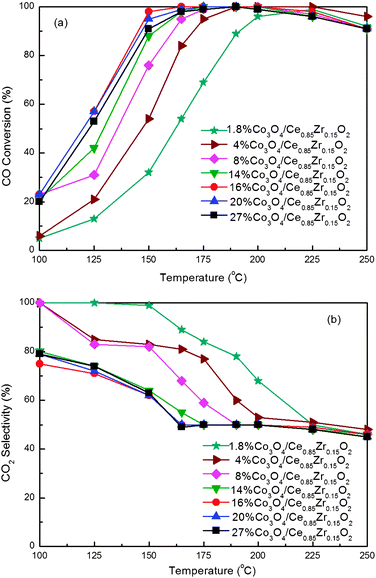 | ||
Fig. 4 CO conversion (a) and CO2 selectivity (b) for CO PROX reactions over the Co3O4/Ce0.85Zr0.15O2 catalysts with different loadings. Reaction conditions: 1.0% O2, 1.0% CO, 50% H2, and balance Ar; GHSV = 15![[thin space (1/6-em)]](https://www.rsc.org/images/entities/char_2009.gif) 000 mL g−1 h−1. 000 mL g−1 h−1. | ||
From Fig. 4, the Co3O4/Ce0.85Zr0.15O2 catalysts indicate excellent catalytic properties, which strongly depend on the cobalt oxide loading. The catalytic activities are obviously increased while the cobalt oxide loading is increased from 1.8 to 16 wt.%. No obvious change takes place as the loading is increased from 16 to 20 wt.%. However, the further increase in loading from 20 to 27 wt.% leads to a slight decrease in CO conversion. The temperature window for 100% CO conversion is in the range of 165–200 °C and similar CO2 selectivity is achieved over 16–20 wt.%Co3O4/Ce0.85Zr0.15O2 catalysts. From Fig. 4(a), as the reaction temperature is increased, the CO conversion increases up to the maximum, is retained for a while, and then decreases. The decrease in CO conversion might be supposed to the competitive oxidation between CO and H2 in the feed. Some oxygen was consumed to oxygenate hydrogen with the temperature increasing, leading to the residual O2 content insufficient for the total oxidation of CO.10,39 In addition, according to the temperature-programmed reaction experiment over the 10%CoOx/CeO2 catalyst performed by Woods et al.,9 below 175 °C the formation of H2O was not obvious, but upon 175 °C, the intensity of the water signal began to increase. Only if the temperature was higher than 275 °C, the signal of methane appeared. These are similar to our reaction results. From Fig. 4(b), the selectivity of these catalysts with different cobalt oxide loadings has the opposite order to their catalytic activity. Moreover, the selectivity decreases as the temperature is increased.
The variation of the XRD patterns for the support and Co3O4/Ce0.85Zr0.15O2 catalysts with different loadings is shown in Fig. 5, and the analysis results for the crystalline phases and the average crystallite size are presented in ESI, Table S3.†
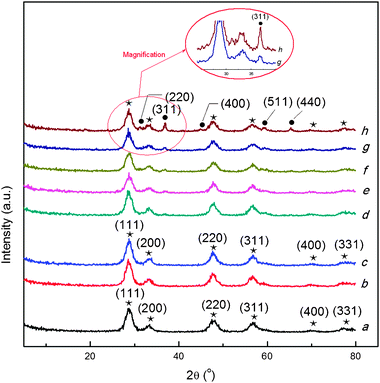 | ||
| Fig. 5 The X-ray diffraction patterns of Co3O4/Ce0.85Zr0.15O2 catalysts with different loadings. (a) Ce0.85Zr0.15O2, (b) 1.8%Co3O4/Ce0.85Zr0.15O2, (c) 4%Co3O4/Ce0.85Zr0.15O2, (d) 8%Co3O4/Ce0.85Zr0.15O2, (e) 14%Co3O4/Ce0.85Zr0.15O2, (f) 16%Co3O4/Ce0.85Zr0.15O2, (g) 20%Co3O4/Ce0.85Zr0.15O2, (h) 27%Co3O4/Ce0.85Zr0.15O2. (★) fluorite-type cubic CexZr1−xO2 composite oxide; (●) cubic Co3O4. | ||
From Fig. 5, the pure cubic phase of Ce0.85Zr0.15O2 according to (111), (200), (220) and (311) is identified on the basis of the previous reports26,40 and JCPDS file (28–0271) of the Ce0.75Zr0.15O2. We do not see the segregation phenomena for ceria-zirconia into a mixture containing ceria-rich phase and zirconia-rich one, indicating that the zirconium is fully inserted into CeO2 crystalline matrix (high CeO2 concentration composites) to form single-phase solid solutions.33,38,41 Moreover, from Table S3,† the addition of different loading of cobalt oxide on the support doesn't obviously change the crystallite size of the Ce0.85Zr0.15O2 support (5.4–6.1 nm). It is also found that no diffraction peaks of Co3O4 are observed if the cobalt oxide loading is not more than 4 wt.%, which can be due to the low cobalt oxide loading amount, the highly fine dispersion of cobalt oxide, besides the supported cobalt species incorporation into the ceria-zirconia lattices.38,42 The diffraction peaks of Co3O4 just appear when the loading is higher than 4 wt.%, and the sharpened diffraction peaks can be observed as the loading is increased, demonstrating the magnified crystallite size resulted from the agglomeration of cobalt oxide. The cubic phase Co3O4 with the Fd3m crystallite type is identified by comparing with the corresponding JCPDS file (43–1003). From Table S3,† the average crystallite size of Co3O4 varying from 13.1 to 16.4 nm can be observed while the loading is increased from 8 to 27 wt.%. As a result, by increasing the cobalt oxide loading from 1.8 to 27 wt.%, the catalytic activity increases up to the maximum, and then decreases.
The reducibility and strength of the metal–support interactions on the catalysts can be evaluated via H2 TPR experiment. Fig. 6 exhibits the H2-TPR profiles of the Co3O4/Ce0.85Zr0.15O2 catalysts with different cobalt oxide loadings, and the quantitative analysis results for the Co3O4/Ce0.85Zr0.15O2 catalysts with a loading range are presented in ESI, Table S4.†
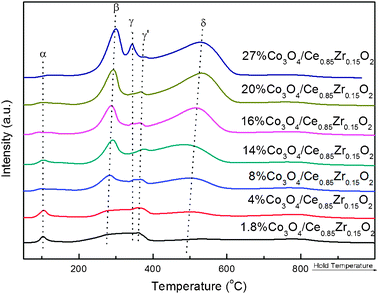 | ||
| Fig. 6 H2-TPR profiles of Co3O4/Ce0.85Zr0.15O2 catalysts with different loadings. | ||
The reduction peaks over bare ceria-zirconia support appear at about 500 and 750 °C (see ESI, Fig. S4†), which is consistent with the previous reports.40,42 From Fig. 6, the features of the reduction peaks obviously change if Co3O4 is introduced, even though the loading is as low as 1.8 wt.%. At about 100 °C, we also observe a peak named as α-peak (Table S4†). Based on the previous reports,16,43 we may refer the peak at about 100 °C to the reduction of the highly dispersed Co3O4 over the support. The α-peak intensity decreases with the cobalt oxide loading being increased. This is due to the Co3O4 agglomeration with the loading being increased.
It is well known that the reduction of Co3O4 can be divided into two procedures: Co3+ → Co2+ and Co2+ → Co0. From the previous reports, the reduction of Co3O4 mainly occurred before 400 °C.28,44 From Fig. 6, we can observe three or four peaks in the temperature range of 200–500 °C, which are denoted as β, γ, γ′ and δ, respectively. The β-peak can be ascribed to the reduction of Co3+ (converted into Co2+), and δ-peak to the reduction both of Co2+ and of Ce4+.44,45 Previous reports confirmed that the metal–support interaction had a strong influence on the reduction properties of Co3O4.10 As a result, the reduction profile becomes complicated, and the other two peaks (γ and γ′) between β and δ in the H2-TPR profiles can also be assigned to the reduction of cobalt oxide, led by the metal–support interaction. Furthermore, by the integration of the area of all the reduction peaks, the total hydrogen uptake far exceeded the required amount for the complete reduction of Co3O4 in each experiment, further indicating that the δ-peak contains the reduction of partial Ce4+, besides Co2+. From Table S4,† as expected, the total H2 uptake is steadily increased with the increase in the Co3O4 loading, which is favorable for the CO PROX reaction. Moreover, from Fig. 6 and Table S4,† as the cobalt oxide loading is increased, we can clearly see the reduction peaks β and δ shifted to the higher temperature. This can be attributed to the agglomeration of cobalt oxides, besides the possible metal-support interaction. The average crystallite size of Co3O4 (Table S3†) increases up to 16.4 nm with the increased loading, which further confirms the existence of agglomeration phenomena of cobalt oxide. Moreover, the increasing cobalt oxide loading can lead to the decrease in the specific surface area,46 resulting in the lower catalytic activity for the CO PROX reaction. As a result, the catalytic activity for the CO PROX reaction increases with the increase of loading up to 16 wt.%. However, the further increased loading leads to a decrease in CO conversion. The optimum cobalt oxide loading of the nano-particulate CeO2–ZrO2 supported Co3O4 catalyst for the CO PROX reaction in H2-rich gas is 16 wt.%.
Effect of calcination temperature
Generally, the calcination temperature of catalysts has a significant influence on the catalytic properties. Herein, based on the optimum Ce/(Ce + Zr) and cobalt oxide loading, we investigated the effect of Tsup and Tcat on the catalytic performance in the CO PROX reaction. Fig. 7 shows the variation of the results of the catalysts 16 wt.%Co3O4/Ce0.85Zr0.15O2 with different calcination temperatures.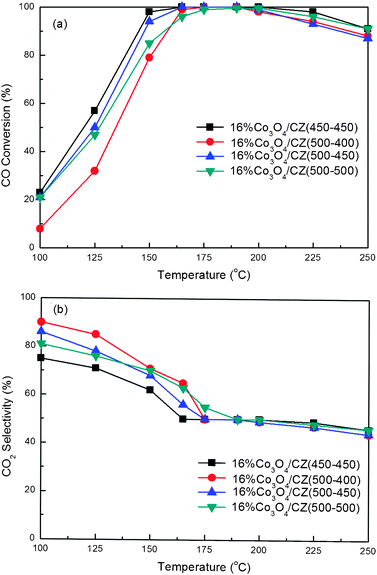 | ||
Fig. 7 CO conversion (a) and CO2 selectivity (b) for CO PROX reactions over the 16 wt.%Co3O4/Ce0.85Zr0.15O2 catalysts with different Tsup and Tcat. Reaction conditions: 1.0% O2, 1.0% CO, 50% H2, and balance Ar; GHSV = 15![[thin space (1/6-em)]](https://www.rsc.org/images/entities/char_2009.gif) 000 mL g−1 h−1. 000 mL g−1 h−1. | ||
From Fig. 7, both Tsup and Tcat influence the catalytic performance for the CO PROX reaction of the supported cobalt oxide catalysts. In comparison of the three supported cobalt oxide catalysts with the same Tsup (500 °C) but different Tcat (400, 450 and 500 °C), we find that the appropriate Tcat is required, and the catalyst 16%Co3O4/CZ(500–450) exhibits the best catalytic performance. The highest catalytic activity and the widest temperature window (165–200 °C) for 100% CO conversion over 16%Co3O4/CZ(500–450) can be observed. The poor catalytic activity of 16%Co3O4/CZ(500–400) might be due to the incomplete decomposition of cobalt nitrate at the low temperature of 400 °C.47,48 This also can be further confirmed by the XRD patterns of the 16%Co3O4/CZ(500–400) catalyst as following. Moreover, a slight decrease in catalytic activity can be observed as the Tcat is increased from 450 to 500 °C. Then, the effect of Tsup is investigated by comparing the catalytic properties of 16%Co3O4/CZ(500–450) and 16%Co3O4/CZ(450–450). From Fig. 7, it can be clearly seen that the catalytic activity of 16%Co3O4/CZ(450–450) is higher than that of 16%Co3O4/CZ(500–450), but with similar CO2 selectivity at the temperature range of 165–200 °C in which the CO is fully converted into CO2.
XRD experiments were performed to reveal the relationship between the nature and catalytic properties of the 16 wt.%Co3O4/Ce0.85Zr0.15O2 catalysts with various calcination temperatures, and the XRD patterns of the ceria-zirconia supported cobalt oxide catalysts with different Tsup and Tcat are presented in Fig. 8.
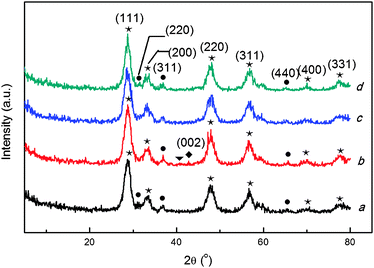 | ||
| Fig. 8 X-ray diffraction patterns of 16 wt.%Co3O4/Ce0.85Zr0.15O2 with different Tsup and Tcat. (a) 16%Co3O4/CZ(450–450), (b) 16%Co3O4/CZ(500–400), (c) 16%Co3O4/CZ(500–450), (d) 16%Co3O4/CZ(500–500). (★) fluorite-type cubic CexZr1−xO2 composite oxide; (●) cubic Co3O4; (▼) Co(NO3)2 phase; (◆) cubic CoO crystal phase. | ||
From the pattern of 16%Co3O4/CZ(500–400), the diffraction peak at 42.5° can be detected, whereas for the other three catalysts this diffraction peak doesn’t appear. Song et al. also detected this diffraction peak of CoO on the Co/CeO2 catalyst, and when the calcination temperature was higher than 400 °C, the CoO phase disappeared.49 The phenomenon implied that more CoO phase existed on the 16%Co3O4/CZ(500–400) catalyst. This peak appearing in the pattern of 16%Co3O4/CZ(500–400) can be ascribed to Co2+, according to the JCPDS file (65–5474). A previous report indicated that the higher valence state of cobalt contributed more to a higher activity of the CO PROX reaction.28 As a result, the 16%Co3O4/CZ(500–400) catalyst has lower activity. Furthermore, a diffraction peak at 40.4° only appears in the XRD pattern of the 16%Co3O4/CZ(500–400) catalyst, but not in those of the other two samples. In comparison of the JCPDS file (19–0356), this peak at 40.4° can be assigned to the crystalline phase of Co(NO3)2. The existence of the phase of Co(NO3)2 was also detected at a lower calcination temperature by Song et al.49 It suggests that the cobalt precursor Co(NO3)2 doesn't completely decompose at the low temperature of 400 °C, resulting in the worse catalytic activity. We also calculated the crystallite size of Co3O4 based on the Scherrer Formula over multiple characteristic diffraction peaks by the MDI Jade5 software. 16%Co3O4/CZ(500–400) catalyst has a smaller crystallite size (11.7 nm) than those of the others (14.8 and 15.2 nm for 16%Co3O4/CZ(500–450) and 16%Co3O4/CZ(500–450), respectively). From above, although the 16%Co3O4/CZ(500–400) catalyst has smaller crystallite size than the other two samples, it exhibits the worst catalytic activity, which is due to the less high valence cobalt, which originated from the existence of more low valence cobalt and the incompletely decomposed Co(NO3)2. Moreover, the 16%Co3O4/CZ(450–450) and 16%Co3O4/CZ(500–450) have a similar crystallite size of Co3O4 (14.8 and 14.9 nm for the former and the latter, respectively), but the former exhibits better catalytic activity than that of the latter. The reason would be further probed by H2-TPR.
Fig. 9 shows the H2-TPR profiles of the 16%Co3O4/CZ(450–450) and 16%Co3O4/CZ(500–450) catalysts. From Fig. 9, compared with 16%Co3O4/CZ(500–450), the 16%Co3O4/CZ(450–450) has a similar amount of H2 consumption and a little lower reduction temperature, which allows the better catalytic properties over the 16%Co3O4/CZ(450–450) than over the 16%Co3O4/CZ(500–450). Generally, the higher calcination temperature would lead to the lower specific surface area of catalyst,19 which could also be a reason for 16%Co3O4/CZ(450–450) catalyst exhibiting better catalytic performance in the CO PROX reaction than 16%Co3O4/CZ(500–450). Herein, the 16%Co3O4/CZ(450–450) was used to investigate the effects of adding CO2 and H2O, GHSV and time on stream on the catalytic performance for the CO PROX reaction in excess H2.
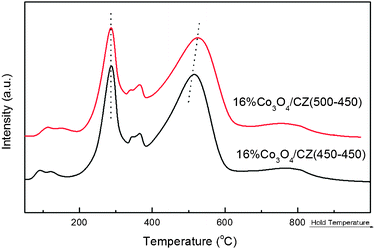 | ||
| Fig. 9 H2-TPR profiles of 16 wt.%Co3O4/Ce0.85Zr0.15O2 with different Tsup. | ||
Effect of adding CO2 and H2O
Actually, the hydrogen-rich stream for the PEMFC contains CO2 and H2O. Therefore, to study the catalytic properties of catalysts for the CO PROX reaction in the presence of CO2 and H2O is very important. We have investigated the effect of CO2 and H2O on the catalytic performance of the 16%Co3O4/CZ(450–450) catalyst for the CO PROX reaction in excess H2. Fig. 10 provides the reaction results.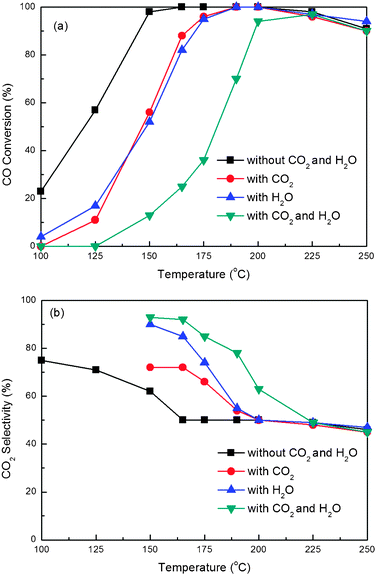 | ||
Fig. 10 CO conversion (a) and CO2 selectivity (b) for CO PROX reactions over the 16 wt.%Co3O4/Ce0.85Zr0.15O2 (Tsup = Tcat = 450 °C) catalyst in the presence of CO2 and H2O. Reaction conditions: 1.0% O2, 1.0% CO, 50% H2, 10% CO2 or/and 10% H2O and balance Ar; GHSV = 15![[thin space (1/6-em)]](https://www.rsc.org/images/entities/char_2009.gif) 000 mL g−1 h−1. 000 mL g−1 h−1. | ||
From Fig. 10(a) we can see that the existence of 10% CO2 or 10% H2O has a similar negative influence on the catalytic performance of the catalyst. The initial temperature for CO complete conversion shifts from 165 to 190 °C compared with that without CO2 and H2O, and, as well, the temperature window for 100% CO conversion becomes narrower. The selectivity of O2 for CO conversion is quite contrary to the activity, and the order is as follows: with (CO2 + H2O) > with H2O > with CO2 > without CO2 + H2O. Previous reports had ascribed the negative effect of H2O to the blockage of the active sites by the water adsorbed.11,16,19 It was also proposed that at low temperature the inhibiting effect of CO2 mainly was ascribed to two reasons: the competitive adsorption of CO2 with CO on the catalyst surface and the formation of the carbonates related to the interaction of CO2 and the surface of ceria, which were considered to block the oxygen mobility on the support.19
Moreover, the possible reverse water–gas shift (RWGS) reaction of CO2 with H2 would yield CO, which might be a reason for lowering the overall CO conversion by addition of CO2 into the H2-rich stream at higher reaction temperature.39 In order to prove this viewpoint, we performed the RWGS reaction in a 50 mL min−1 of gas containing 10% CO2, 50% H2 and Ar under the same experimental conditions with the PROX over 16%Co3O4/CZ(450–450). Up to 250 °C (the highest temperature in this paper for PROX), the RWGS reaction didn't occur. Therefore, the inhibiting effect of adding CO2 in the H2-rich stream for CO PROX reaction over our 16%Co3O4/CZ(450–450) catalyst at higher temperature can be still ascribed to the competitive adsorption of CO2 with CO on the catalyst surface and the formation of the carbonates.
Effect of GHSV and O2 concentration
We used the catalyst 16%Co3O4/CZ(450–450) to test the effect of GHSV and O2 concentration on the CO PROX reaction in the presence of CO2 and H2O. Fig. 11 illustrates the reaction results. As shown in Fig. 11(a), the CO conversion increases at the given temperatures with a decrease in the GHSV from 15![[thin space (1/6-em)]](https://www.rsc.org/images/entities/char_2009.gif) 000 to 7500 mL g−1 h−1. At 7500 mL g−1 h−1, the CO conversion reaches almost 100% at 225 °C, while at 15
000 to 7500 mL g−1 h−1. At 7500 mL g−1 h−1, the CO conversion reaches almost 100% at 225 °C, while at 15![[thin space (1/6-em)]](https://www.rsc.org/images/entities/char_2009.gif) 000 mL g−1 h−1 the CO conversion is about 97%. But Fig. 11(b)demonstrates the selectivity of O2 to CO oxidation for these two different GHSVs is similar. As a result, the CO conversion can be increased by extending the contact time of the catalyst with the feed. This conclusion has also been obtained by other researchers.9,19 As for the catalytic properties for the CO PROX reaction as the function of O2 concentration, the CO conversion increases with the increase of oxygen concentration in the feed. Using 1.0% O2 in the feed, the highest CO conversion can reach almost 100% at 225 °C. Further improving O2 concentration to 1.25%, CO can be fully converted at 200 and 225 °C even in the presence of 10% CO2 and 10% H2O, demonstrating our 16%Co3O4/CZ(450–450) catalyst prepared by RM-IWI method to be a promising catalyst for eliminating CO from an H2-rich stream to produce clean H2. The increase in O2 concentration (from 1.25% to 1.5%) can only increase the CO conversion at lower temperature, but cannot affect it at higher temperature (not less than 200 °C). Moreover, the higher O2 concentration can lead to the obvious decrease in selectivity. The 1.25% O2 concentration is appropriate for the CO PROX reaction over the 16%Co3O4/CZ(450–450) catalyst.
000 mL g−1 h−1 the CO conversion is about 97%. But Fig. 11(b)demonstrates the selectivity of O2 to CO oxidation for these two different GHSVs is similar. As a result, the CO conversion can be increased by extending the contact time of the catalyst with the feed. This conclusion has also been obtained by other researchers.9,19 As for the catalytic properties for the CO PROX reaction as the function of O2 concentration, the CO conversion increases with the increase of oxygen concentration in the feed. Using 1.0% O2 in the feed, the highest CO conversion can reach almost 100% at 225 °C. Further improving O2 concentration to 1.25%, CO can be fully converted at 200 and 225 °C even in the presence of 10% CO2 and 10% H2O, demonstrating our 16%Co3O4/CZ(450–450) catalyst prepared by RM-IWI method to be a promising catalyst for eliminating CO from an H2-rich stream to produce clean H2. The increase in O2 concentration (from 1.25% to 1.5%) can only increase the CO conversion at lower temperature, but cannot affect it at higher temperature (not less than 200 °C). Moreover, the higher O2 concentration can lead to the obvious decrease in selectivity. The 1.25% O2 concentration is appropriate for the CO PROX reaction over the 16%Co3O4/CZ(450–450) catalyst.
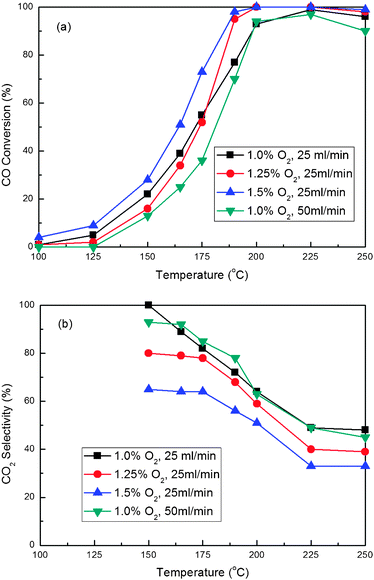 | ||
| Fig. 11 Effect of GHSV and O2 concentration on the CO conversion (a) and CO2 selectivity (b) for CO PROX reactions over the 16 wt.%Co3O4/Ce0.85Zr0.15O2 (Tsup = Tcat = 450 °C) catalyst. Reaction conditions: 1.0% CO, 50% H2, 10% CO2, 10% H2O and balance Ar. | ||
Effect of time on stream
The stability of the CO PROX reaction catalyst is very significant for its practical utilization. Previous work was performed to investigate the stability of cobalt-based catalysts, and the activity loss generally can be attributed to the reduction of cobalt oxide with high valence under the reduction atmosphere.50 We investigated the stability of our 16%Co3O4/CZ(450–450) catalyst by performing the CO PROX reaction experiment at 200 °C using a feed containing 1% CO, 1.25% O2, 50% H2, 10% H2O, 10% CO2, and Ar balance. Fig. 12 presents the CO conversion and CO2 selectivity as a function of time on stream.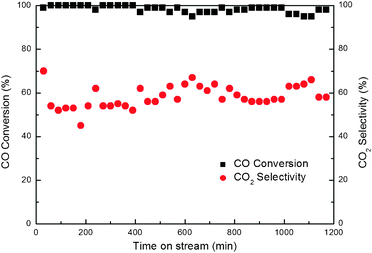 | ||
| Fig. 12 Effect of the time on stream on CO conversion and CO2 selectivity for CO PROX reactions over the 16 wt.%Co3O4/Ce0.85Zr0.15O2 (Tsup = Tcat = 450 °C) catalyst. Reaction conditions: 1.25% O2, 1.0% CO, 50% H2, 10% CO2, 10% H2O and balance Ar at 200 °C; GHSV = 7500 mL g−1 h−1. | ||
From Fig. 12, in the presence of CO2 and H2O, our 16%Co3O4/CZ(450–450) catalyst exhibits the good catalytic performance for the CO PROX reaction. Up to 1200 min, no obvious decrease in either CO conversion or CO2 selectivity can be observed. This implies that on the 16%Co3O4/CZ(450–450) catalyst prepared by RM-IWI method, the reduction of high valence cobalt may not take place even in the H2 atmosphere. As a result, the 16%Co3O4/CZ(450–450) catalyst exhibits excellent catalytic stability for the CO PROX reaction, and even in the presence of CO2 and H2O, which can be ascribed to the strong metal–support interaction to stabilize the high valence cobalt. Our developed 16%Co3O4/CZ(450–450) sample may be a promising catalyst to remove CO from H2-rich gas.
Conclusions
The nano-particulate CexZr1−xO2 supported Co3O4 prepared by RM-IWI method is a potential catalyst for the CO PROX reaction to eliminate trace CO from H2-rich gas. Lower agglomerate of support, better reducibility of supported cobalt catalyst and smaller crystal size allow the Co3O4/CexZr1−xO2 catalyst to exhibit better catalytic properties for the CO PROX reaction in H2-rich gas. We observed that the physicochemical properties and catalytic performance of the Co3O4/CexZr1−xO2 catalysts were highly dependent on the Ce/(Ce + Zr) atomic ratio in support, the cobalt oxide loading and the calcination temperature. It indicated that the doped CeO2 with an optimal amount of zirconium by RM method can form a single crystalline phase solid solution, which enhanced the reducibility of CeO2 and decreased the particle size, as well as improving the dispersion of Co3O4. It seemed that the strong interaction between CeO2 and ZrO2 in the nanocomposite oxide support appeared to be responsible for the high catalytic activity of the Co3O4/CexZr1−xO2 catalyst for the CO PROX reaction in excess hydrogen. It is concluded that the incorporation of zirconium into CeO2 is not always favourable for the catalytic performance of the supported cobalt oxide catalysts for the CO PROX reaction, and the optimum Ce/(Ce + Zr) atomic ratio is required. The nano-particulate ceria-zirconia composites with the 0.85–0.95 optimum Ce/(Ce + Zr) atomic ratio were promising as a support to prepare the supported cobalt based catalysts for the CO PROX reaction.The catalytic properties of the supported Co3O4 catalysts over nano-particulate CeO2–ZrO2 were further optimized by varying the cobalt oxide loadings and the calcination temperatures (both Tsup and Tcat). The optimum cobalt oxide loading (16 wt.%), Tsup (450 °C) and Tcat (450 °C) were achieved. The Co3O4/Ce0.85Zr0.15O2 catalysts indicate promising catalytic performance, which is dependent on the H2 uptake, reduction temperature of cobalt oxide and crystallite size, strongly affected by both cobalt oxide loading and calcination temperature.
The addition of 10% CO2 and 10% H2O has a negative influence on the catalytic performance of the catalyst. The negative effect of H2O can be ascribed to the blockage of the active sites by the water adsorbed and the inhibiting effect of adding CO2 in the H2-rich stream can be due to the competitive adsorption of CO2 with CO on the catalyst surface and the formation of the carbonates. Our developed 16%Co3O4/CZ(450–450) catalyst exhibits excellent catalytic performance for the CO PROX reaction, and 100% of CO conversion can be obtained in the presence of 10% CO2 and 10% H2O. The catalytic stability results suggest that on the 16%Co3O4/CZ(450–450) catalyst prepared by RM-IWI method, the reduction of high valence cobalt may not take place even in the H2 atmosphere, which can be ascribed to the inhibiting effect resulting from the strong metal–support interaction. As a result, the 16%Co3O4/CZ(450–450) catalyst exhibits excellent catalytic stability for the CO PROX reaction (100% CO conversion can be maintained, and no decrease up to 1200 min), and even in the presence of CO2 and H2O. The developed 16%Co3O4/CZ(450–450) sample can become a promising catalyst for the CO PROX reaction to remove trace CO from the H2-rich gas.
Acknowledgements
This work is financially supported by the National Natural Science Foundation of China (No. 20803006) and the Fundamental Research Funds for the Central Universities.Notes and references
- R. F. Service, Science, 1996, 258, 682–685 Search PubMed.
- A. Luengnaruemitchai, S. Osuwan and E. Gulari, Int. J. Hydrogen Energy, 2004, 29, 429–435 CrossRef CAS.
- Q. Fu, H. Saltsburg and M. Flytzani-Stephanopoulos, Science, 2003, 301, 935–938 CrossRef CAS.
- S. H. D. Lee, D. V. Applegate, S. Ahmeda, S. G. Calderone and T. L. Harvey, Int. J. Hydrogen Energy, 2005, 30, 829–843 CrossRef CAS.
- S. Y. Chin, Y. H. Chin and M. D. Amiridis, Appl. Catal., A, 2006, 300, 8–13 CrossRef CAS.
- G. Q. Yi, H. W. Yang, B. D. Li, H. Q. Lin, K.-I. Tanaka and Y. Z. Yuan, Catal. Today, 2010, 157, 83–88 CrossRef CAS.
- Y. Ishida, T. Ebashi, S.-i. Ito, T. Kubota, K. Kunimori and K. Tomishige, Chem. Commun., 2009, 5308–5310 RSC.
- E. D. Park, D. Lee and H. C. Lee, Catal. Today, 2009, 139, 280–290 CrossRef CAS.
- M. P. Woods, P. Gawade, B. Tan and U. S. Ozkan, Appl. Catal., B, 2010, 97, 28–35 CrossRef CAS.
- Z. K. Zhao, M. M. Yung and U. S. Ozkan, Catal. Commun., 2008, 9, 1465–1471 CrossRef CAS.
- Q. Zhang, X. Liu, W. Fan and Y. Wang, Appl. Catal., B, 2011, 102, 207–214 CrossRef CAS.
- Y. Ishida, T. Ebashi, S.-i. Ito, T. Kubota, K. Kunimori and K. Tomishige, Chem. Commun., 2009, 5308–5310 RSC.
- L. Ilieva, G. Pantaleo, I. Ivanov, A. Maximova, R. Zanella, Z. Kaszkur, A. M. Venezia and D. Andreeva, Catal. Today, 2010, 158, 44–55 CrossRef CAS.
- Z. K. Zhao, X. L. Lin, R. H. Jin, G. R. Wang and M. G. Qiu, Curr. Top. Catal., 2010, 9, 1–14 CAS.
- T. Sanchez, M. Rosa and U. Atsushi, J. Catal., 1997, 168, 125–127 CrossRef.
- A. Gómez-Cortés, Y. Márquez, J. Arenas-Alatorre and G. Díaz, Catal. Today, 2008, 133–135, 743–749 CrossRef.
- C. R. Jung, A. Kundu, S. W. Nam and H.-I. Lee, Appl. Catal., B, 2008, 84, 426–432 CrossRef CAS.
- A. Martínez-Arias, A. B. Hungría, G. Munuera and D. Gamarra, Appl. Catal., B, 2006, 65, 207–216 CrossRef.
- Z. Wu, H. Zhu, Z. Qin, H. Wang, L. Huang and J. Wang, Appl. Catal., B, 2010, 98, 204–212 CrossRef CAS.
- Q. Guo, M. L. Wu, Y. Liu and X. Bai, Chin. J. Catal., 2007, 28, 953–957 CrossRef CAS.
- M. Kang, M. W. Song and C. H. Lee, Appl. Catal., A, 2003, 251, 143–156 CrossRef CAS.
- S. Sun, Q. Gao, H. Wang, J. Zhu and H. Guo, Appl. Catal., B, 2010, 97, 284–291 CrossRef CAS.
- X. W. Xie, Y. Li, Z. Q. Liu, M. Haruta and W. J. Shen, Nature, 2009, 458, 746–749 CrossRef CAS.
- H. L. Li, X. H. Yu, S. T. Tu, J. Y. Yan and Z. D. Wang, Appl. Catal., A, 2010, 387, 215–223 CrossRef CAS.
- K. Omata, Y. Kobayashi and M. Yamada, Catal. Commun., 2007, 8, 1–5 CrossRef CAS.
- A. Martínez-Arias, A. B. Hungría, M. Fernández-García, J. C. Conesa and G. Munuera, J. Power Sources, 2005, 151, 32–42 CrossRef.
- Q. Guo and Y. Liu, React. Kinet. Catal. Lett., 2007, 92, 19–25 CrossRef CAS.
- Q. Guo and Y. Liu, Appl. Catal., B, 2008, 82, 19–26 CrossRef CAS.
- A. I. Kozlov, D. H. Kim, A. Yezerets, P. Andersen, H. H. Kung and M. C. Kung, J. Catal., 2002, 209, 417–426 CrossRef CAS.
- S. Damyanova, B. Pawelec, K. Arishtirova, M. V. M. Huerta and J. L. G. Fierro, Appl. Catal., A, 2008, 337, 86–96 CrossRef CAS.
- P. Ratnasamy, D. Srinivas, C. V. V. Satyanarayana, P. Manikandan, R. S. S. Kumaran, M. Sachin and V. N. Shetti, J. Catal., 2004, 221, 455–465 CrossRef CAS.
- I. Dobrosz-Gómez, I. Kocemba and J. M. Rynkowski, Appl. Catal., B, 2008, 83, 240–255 CrossRef.
- Z. Zou, M. Meng, Q. Li and Y. Zha, Mater. Chem. Phys., 2008, 109, 373–380 CrossRef CAS.
- J. Cao, Y. Wang, T. Zhang, S. Wu and Z. Yuan, Appl. Catal., B, 2008, 78, 120–128 CrossRef CAS.
- J. L. Ayastuy, M. P. González-Marcos, A. Gil-Rodríguez, J. R. González-Velasco and M. A. Gutiérrez-Ortiz, Catal. Today, 2006, 116, 391–399 CrossRef CAS.
- T. Caputo, R. Pirone and G. Russo, Kinet. Catal., 2006, 47, 756–764 CrossRef CAS.
- M. Manzoli, R. Di Monte, F. Boccuzzi, S. Coluccia and J. Kaspar, Appl. Catal., B, 2005, 61, 192–205 CrossRef CAS.
- Z. K. Zhao, X. L. Lin, R. H. Jin, Y. T. Dai and G. R. Wang, Catal. Commun., 2011, 12, 1448–1451 CrossRef CAS.
- F. Mariño, C. Descorme and D. Duprez, Appl. Catal., B, 2005, 58, 175–183 CrossRef.
- P. Biswas and D. Kunzru, Int. J. Hydrogen Energy, 2007, 32, 969–980 CrossRef CAS.
- L. Liu, Z. Yao, B. Liu and L. Dong, J. Catal., 2010, 275, 45–60 CrossRef CAS.
- S. Pengpanich, V. Meeyoo and T. Rirksomboon, Catal. Today, 2004, 93–95, 95–105 CrossRef CAS.
- J. L. Ayastuy, A. Gurbani, M. P. González-Marcos and M. A. Gutiérrez-Ortiz, Appl. Catal., A, 2010, 387, 119–128 CrossRef CAS.
- L. F. Liotta, G. Di Carlo, G. Pantaleo and G. Deganello, Catal. Commun., 2005, 6, 329–336 CrossRef CAS.
- H. Song, B. Mirkelamoglu and U. S. Ozkan, Appl. Catal., A, 2010, 382, 58–64 CrossRef CAS.
- T. Caputo, L. Lisi, R. Pirone and G. Russo, Appl. Catal., A, 2008, 348, 42–53 CrossRef CAS.
- J. Girardon, A. S. Lermontov, L. Gengembre and P. A. Chernavskii, J. Catal., 2005, 230, 339–352 CrossRef CAS.
- W. Chu, P. A. Chernavskii, L. Gengembre, G. A. Pankina, P. Fongarland and A. Y. Khodakov, J. Catal., 2007, 252, 215–230 CrossRef CAS.
- H. Song, L. Z. Zhang and U. S. Ozkan, Green Chem., 2007, 9, 686–694 RSC.
- Y. Teng, H. Sakurai, A. Ueda and T. Kobayashi, Int. J. Hydrogen Energy, 1999, 24, 355–358 CrossRef CAS.
Footnote |
| † Electronic supplementary information (ESI) available: Extra results for catalyst characterization and reaction. See DOI: 10.1039/c1cy00280e |
| This journal is © The Royal Society of Chemistry 2012 |


