Nucleation reaction dynamics of Pt nanoparticles observed by the heterodyne transient grating method
Naotaka
Maeda
a,
Takeshi
Eitoku
a,
Yasuhiro
Ikezoe
b and
Kenji
Katayama
*a
aDepartment of Applied Chemistry, Faculty of Science and Engineering, Chuo University, 1-13-27 Kasuga, Bunkyo, Tokyo 112-8551, Japan. E-mail: kkata@kc.chuo-u.ac.jp
bRIKEN, 2-1 Hirosawa, Wako, Saitama 351-0198, Japan
First published on 10th November 2011
Abstract
The nucleation reaction dynamics of platinum nanoparticles in the photoreduction process of H2Pt(IV)Cl6 solution were investigated by the heterodyne transient grating (HD-TG) method. The formation mechanism of platinum nanoparticles was considered, supported by information obtained from UV/VIS absorption spectroscopy during the reaction and SEM images of the generated nanoparticles. In particular, the roles of poly(N-vinyl-2-pyrrolidone) (PVP) as a protective polymer and ethanol as a solvent were studied. The chemical species involved in the reaction can be identified from the diffusion coefficients obtained from HD-TG measurements; the species observed by UV pulse irradiation were assigned to H2Pt(IV)Cl6 as a reactant species and H2Pt(II)Cl4 and Pt nuclei as product species. It was observed that the amounts of the reactant and product species increased, and many homogeneous nanoparticles were generated, by an increase in PVP concentration. The addition of ethanol to the solvent showed a larger effect on the enhancement of the reduction of H2Pt(IV)Cl6 than that of PVP; however, it did not lead to Pt nuclei formation in the order of seconds. Nevertheless, because nanoparticle formation was confirmed by UV/VIS absorption spectroscopy and SEM images, the formation of nanoparticles following nuclei formation must have proceeded via a slow reaction. Therefore, nucleation and nanoparticle formation are considered to occur on a longer time scale than 10 s in water/ethanol solvent.
1. Introduction
Platinum nanoparticles are well-known catalysts for the purification of emitted exhaust gas and for electrodes of fuel cell batteries.1,2 Because nanoparticles with a size of 1–10 nm exhibit characteristic physical and chemical properties and high interfacial ratios, they are expected to exhibit high catalytic activity.3–6 Because the nanoparticles are generated from the growth of nuclei, which is formed by a nucleation reaction, controlling the final size or shape of the nanoparticles should be well understood. However, it is difficult to follow the formation process because nanoparticles are typically generated inhomogeneously and the formation time depends on the size of each nanoparticle. In most Pt nanoparticle preparations, ethanol was added to the solvent for the reduction of the Pt species,6–8 and Teranishi et al. studied the effect of alcohol on the final size of Pt nanoparticles.9 As usual in nanoparticle syntheses, protecting agents were used to prevent particle aggregation.10,11 Although there are several reports of Pt nanoparticles being grown with controlled sizes, the nucleation process was not understood and not controlled.3,12 Although UV/VIS absorption spectroscopy was previously utilized to estimate the reaction mechanism, its confirmation is difficult because most of the intermediate species involved have absorption in the UV region and the absorption of several species overlaps.6For measuring the dynamics of photochemical reactions, especially for the reaction where the involved intermediate species are difficult to detect by absorption spectroscopy, the transient grating (TG) method is an effective technique in which the photochemical species can be traced through refractive index changes.13,14 The formation and growth processes of Pt nanoparticles were previously studied by Harada et al.7 In this paper, water/ethanol was used as the solvent, and it is proposed that the growth process of nanoparticles begins after most H2Pt(IV)Cl6 is reduced to H2Pt(II)Cl6. From extended X-ray absorption fine structure (EXAFS) measurements, it was determined that the stable intermediate species in this reaction are related to H2Pt(II)Cl4 and Pt nuclei, generated via the dissociation of the Pt–Cl bond.15 On the other hand, we studied the formation dynamics of gold nanoparticles in the photoreduction of chloroauric acid by using a heterodyne transient grating (HD-TG) method.16 We succeeded in observing the intermediate ion species involved in the reaction and the subsequent formation of particle nuclei. Furthermore, we reported that protective agents do not merely serve to prevent aggregation, but to accelerate the reduction of the reactant species by forming complex species with the reactants. We also found that the reaction did not proceed to nucleation if the ratio of the protective agent to the reactant species was not above a threshold value.
In this study, we examined the nucleation reaction dynamics of Pt nanoparticles using the HD-TG method, and considered the reaction mechanism with the aid of UV/VIS absorption spectra obtained during the reaction and SEM images of the generated nanoparticles. In particular, we studied the influence of the protective agent, PVP, and the effect of the addition of ethanol to the solvent.
2. Principle and theory
The principle of the HD-TG method has previously been reported in detail.17,18 This analysis was made based on a previous paper on the formation of gold nanoparticles.16 The HD-TG signal due to the thermal grating usually decays 2–3 orders faster than the species grating. The decay time of the species grating is expressed as | (1) |
3. Experimental procedure
The reactant was a hexachloroplatinic acid solution (H2PtCl6·6H2O, Wako Chemical), and the protecting polymer agent was poly(N-vinyl-2-pyrrolidone) (PVP K-30, Mw: 40![[thin space (1/6-em)]](https://www.rsc.org/images/entities/char_2009.gif) 000, Kishida Chemical) used without further purification. The solvents were prepared from ethanol (99.5%, Wako Chemical) and pure water (Milli-Q).
000, Kishida Chemical) used without further purification. The solvents were prepared from ethanol (99.5%, Wako Chemical) and pure water (Milli-Q).
The samples for SEM and UV/VIS absorption measurements were prepared by the following procedures: first, aqueous solutions of H2Pt(IV)Cl6 (2.0 mM) and PVP (0.2 mM) were prepared, and mixed to adjust the H2Pt(IV)Cl6 concentration to 1.0 mM. For comparison, H2Pt(IV)Cl6 (1.0 mM) aqueous solution without PVP was prepared. Similarly, we prepared samples in an ethanol/water solution with 50% volume fraction of ethanol. The samples were placed in a quartz cell (1 × 10 × 45 mm) with an optical path length of 1 mm, and a pulsed laser was used to irradiate the sample and induce the photoreduction reaction. An Nd:YAG laser was used (intensity: 3 mJ pulse−1, repetition rate: 20 Hz, pulse width: 5 ns) and the light was used to irradiate the sample after expanding its diameter to 10 mm with a lens. The sample was moved every 10 min to reduce inhomogeneity in the reaction. The samples were measured every 30 min using a UV/VIS spectrometer (HITACHI U-2900). After 120 min irradiation, the samples were observed by SEM.
For the HD-TG measurements, the photoreduction dynamics were observed using the same excitation laser used in the aforementioned reaction. The probe light was the CW second harmonic light of an Nd:YVO4 laser (532 nm). The concentrations of the samples were 10 mM for H2PtCl6 and 0, 0.2, 0.5, and 1.0 mM for PVP, and were placed in a 1 mm quartz cell. The reaction dynamics were measured after single-shot irradiation by the pump pulse, and the irradiation position was changed for each measurement. 10–50 responses were recorded and averaged. To check the grating spacing dependence, the grating spacing was varied in the range of 50–100 m. 1/τ vs. q2 was plotted according to eqn (1). To measure the dependence of the ethanol volume fraction, 10 mM H2PtCl6 solutions including 1.0 mM PVP were prepared in solvents composed of 0%, 10%, 30%, and 50% volume fractions of ethanol.
4. Results
4.1 SEM images
Fig. 1(a) and (b) are typical images in the absence and presence of PVP, respectively, in water as a solvent. In the absence of PVP, very few Pt nanoparticles were observed, and their size was non-uniform, ranging from 7–14 nm. In this case, the generated nanoparticles were supposed to aggregate because of the lack of the protective agent, PVP. On the other hand, in the presence of PVP, many nanoparticles were observed with a uniform size of ca. 2 nm, indicating that the protecting agent prevented aggregation of nanoparticles.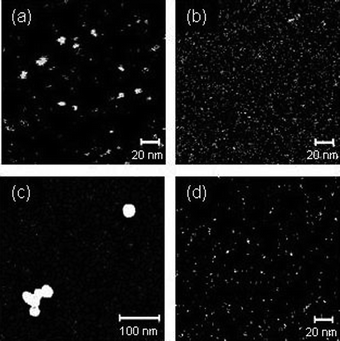 | ||
Fig. 1
SEM images of Pt nanoparticles after 120 min irradiation with a UV laser (a) in a water solvent without PVP, (b) in a water solvent including 0.1 mM PVP, (c) in an ethanol/water (1![[thin space (1/6-em)]](https://www.rsc.org/images/entities/char_2009.gif) : :![[thin space (1/6-em)]](https://www.rsc.org/images/entities/char_2009.gif) 1 volume ratio) solvent without PVP, and (d) in an ethanol/water (1 1 volume ratio) solvent without PVP, and (d) in an ethanol/water (1![[thin space (1/6-em)]](https://www.rsc.org/images/entities/char_2009.gif) : :![[thin space (1/6-em)]](https://www.rsc.org/images/entities/char_2009.gif) 1 volume ratio) solvent including 0.1 mM PVP. 1 volume ratio) solvent including 0.1 mM PVP. | ||
Fig. 1(c) and (d) are SEM images in the absence and presence of PVP, respectively, in ethanol/water solutions as a solvent. In the absence of PVP, fewer nanoparticles with a size of ca. 6 nm were observed along with nanoparticles having a non-uniform size of 30–50 nm. It appears that small nanoparticles aggregated excessively because of the absence of PVP. In the presence of PVP, many Pt nanoparticles with a uniform size of ca. 6 nm were observed and larger non-uniform nanoparticles were not observed.
4.2 UV/VIS absorption spectra
In a previous paper,6 it was reported that H2Pt(IV)Cl6 exhibits a sharp absorption maximum at 260 nm and Pt nanoparticles show broad absorbance extending to 600 nm,20 and this broad absorbance was used for the estimation of nanoparticle shape.Fig. 2(a) and (b) show the change in the absorption spectra during UV pulse irradiation in the absence and presence of PVP in water. In the absence of PVP, the absorption of H2Pt(IV)Cl6 at 260 nm decayed to approximately 40% within 30 min, after which the peak intensity remained the same. In the presence of PVP, the absorption at 260 nm decayed to approximately 50% after 30 min of UV irradiation, and the peak continued to decrease gradually. It was concluded that the photoreduction of H2Pt(IV)Cl6 was enhanced by the addition of PVP due to the reducing ability of PVP, as was reported for gold and silver nanoparticle formation.21
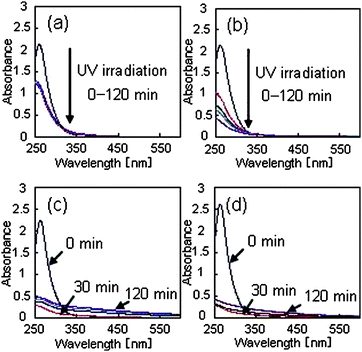 | ||
Fig. 2 The temporal changes in the UV/VIS spectra during UV light irradiation. The spectra for 0, 30, 60, 90, and 120 min irradiation are shown (a) in a water solvent without PVP, (b) in a water solvent including 0.1 mM PVP, (c) in an ethanol/water (1![[thin space (1/6-em)]](https://www.rsc.org/images/entities/char_2009.gif) : :![[thin space (1/6-em)]](https://www.rsc.org/images/entities/char_2009.gif) 1 volume ratio) solvent without PVP, and (d) in an ethanol/water (1 1 volume ratio) solvent without PVP, and (d) in an ethanol/water (1![[thin space (1/6-em)]](https://www.rsc.org/images/entities/char_2009.gif) : :![[thin space (1/6-em)]](https://www.rsc.org/images/entities/char_2009.gif) 1 volume ratio) solvent including 0.1 mM PVP. 1 volume ratio) solvent including 0.1 mM PVP. | ||
Fig. 2(c) and (d) show the change in the absorption spectra in the absence and presence of PVP, respectively, in an ethanol/water solution with a volume fraction of 50%. The absorption of H2Pt(IV)Cl6 at 260 nm almost completely decayed within 30 min of UV irradiation in both cases. It was concluded from these results that the photoreduction of H2Pt(IV)Cl6 was accelerated by the addition of ethanol to the solvent due to the reducing ability of ethanol. During 30–120 min irradiation, the absorption intensity increased in the region between 400 and 600 nm. With respect to the absence or presence of PVP, no clear difference was observed between these spectra.
4.3 HD-TG responses
Fig. 3 shows the dependence of the HD-TG responses on the grating spacing in the absence and presence of PVP. From the dependence on the grating spacing, the diffusion coefficients for each species were calculated and each component was assigned to a species. In each response, four components were included. The first component corresponds to thermal diffusion, judging from the observed time region. Because the decay time for the other three components depended on the grating spacing, they can be considered to be caused by the species grating.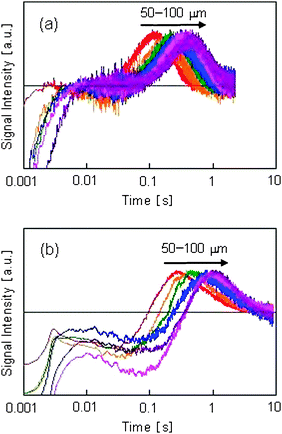 | ||
| Fig. 3 Dependence of HD-TG responses on grating spacing for (a) 0 mM PVP and (b) 1 mM PVP in a water solvent. The grating spacings used were 50, 60, 70, 80, 90, 100 μm and they are indicated in the figure. | ||
From the sign of the signals, the third component corresponded to a reactant species, and the second and fourth components to product species. When a H2Pt(IV)Cl6 solution is reduced to prepare Pt nanoparticles, it is known that the major intermediate species is H2Pt(II)Cl4.15 Therefore, it can be concluded that H2Pt(IV)Cl6, H2Pt(II)Cl4, and Pt nanoparticle nuclei correspond to the third, second, and fourth components, respectively.
The plots of 1/τ vs. q2 are shown in Fig. 4(a) and (b) in the absence and presence of the protective agent, respectively. The diffusion coefficient for each component was obtained, and is listed in Table 1. It was confirmed that all the components of the responses were dominated by diffusion processes because the lines intercept at the origin.
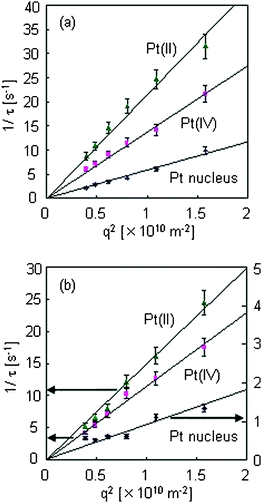 | ||
| Fig. 4 1/τ vs. q2 plots for H2Pt(II)Cl4, H2Pt(IV)Cl6, and Pt nucleus species analyzed from the data shown in Fig. 3, with (a) 0 mM PVP and (b) 1 mM PVP in a water solvent. | ||
The order of the diffusion coefficients for HAu(III)Cl4 and H2Pt(IV)Cl6 as reactant species was similar to those for H2Pt(II)Cl4 and HAu(I)Cl2 as product species.16 The decrease in the diffusion coefficients for H2Pt(IV)Cl6 and H2Pt(II)Cl4 in the presence of PVP was caused by the increase in the viscosity of the solution. From the Stokes–Einstein equation, the sizes of the nanoparticles were calculated from the diffusion coefficients as 0.83 and 2.50 nm in the absence and the presence of PVP, respectively. Because the calculated size includes the hydrated region, namely the surrounding PVP, the actual size of the particles formed in the presence of PVP would be smaller than that calculated. Because the particle size was calculated to be 0.83 nm in the absence of PVP, which corresponds to a cluster composed of dozens of Pt atoms (r = 1.35 Å), we concluded that the fourth component corresponds to Pt nuclei.
The dependence of the HD-TG response on the PVP concentration is shown in Fig. 5. The grating spacing was 60 m. Because the four components were observed at all concentrations of PVP, it can be concluded that Pt nuclei were generated under all conditions. However, as the intensities of all components increased with an increase in the PVP concentration, it is thought that the amount of reduced species and generated nuclei depended on the PVP concentration.
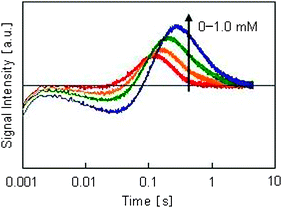 | ||
| Fig. 5 Dependence of HD-TG responses on PVP concentration. The PVP concentrations were 0, 0.2, 0.5, and 1.0 mM. The number in the figure indicates the PVP concentration. | ||
Next, the influence of ethanol in the solvent was investigated by changing the volume fraction of ethanol. On the basis of the assignments in this study, the reacted and generated amounts of H2Pt(IV)Cl6 and H2Pt(II)Cl4, respectively, were increased; however, the amount of generated Pt nuclei was reduced. Thus, it is supposed that as the ethanol ratio increases, the reduction of H2Pt(IV)Cl6 to H2Pt(II)Cl4 proceeds, but reduced H2Pt(II)Cl4 does not form Pt nuclei (Fig. 6).
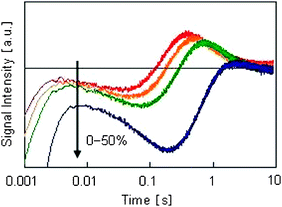 | ||
| Fig. 6 Dependence of HD-TG responses on the ethanol volume fraction. The ethanol volume fractions used were 0%, 10%, 30%, and 50% and the PVP concentration was 1.0 mM in all four samples. The number in the figure indicates the volume fraction of ethanol. | ||
5. Discussion
On the basis of the SEM images, the presence of PVP causes the formation of nanoparticles. Because the size of the Pt nanoparticles generated in the ethanol/water solution is larger than that in the absence of ethanol, more Pt nuclei aggregate to form larger particles by the addition of ethanol. Moreover, the results confirm that PVP serves to control particle size by preventing aggregation, as is well known.From the UV/VIS absorption spectra, PVP causes the photoreduction of H2Pt(IV)Cl6 in aqueous solutions. However, because the reduction ability of ethanol used in the solvent would be considerably higher, the PVP effect is scarcely observed in a water/ethanol solvent. Furthermore, the nanoparticles obtained as final products increase in number as the ethanol ratio increases.
From the SEM images, many Pt nanoparticles were observed in the presence of the protective polymer when water was used as the solvent. However, from the corresponding absorption spectrum, no absorption in the visible region was observed. The broad absorption corresponding to the Pt nanoparticle formation originated from the dielectric difference between the medium and the particle20 and the intensity is determined by Rayleigh scattering theory, namely it is proportional to the inverse of the sixth power of the diameter of the scattering particle. Thus, it is possible that nanoparticles with a smaller size do not show absorption in the visible region, and the presence of absorption in the visible region indicates the formation of larger Pt nanoparticles. Actually the s-values corresponding to broad absorption were reported for Pt nanoparticles larger than 2.5 nm.9,20,22 The addition of ethanol to the solvent affects the formation of these larger nanoparticles. Considering the results obtained from the UV/VIS absorption spectra, the reduction of H2Pt(IV)Cl6 was promoted and the number of nuclei was increased to form larger nanoparticles by the addition of ethanol.
Ethanol is used as a reducing agent as shown in the following chemical equation.9,22
| H2PtCl6 + 2C2H5OH → Pt + 2CH3CHO + 6HCl |
With water as the solvent, the reduction of H2Pt(IV)Cl6 to H2Pt(II)Cl4 and the generation of Pt nuclei were accelerated in the presence of PVP, as confirmed by the HD-TG responses. PVP serves to promote the reduction of the reactant and the subsequent formation of particles. There have been few reports on the formation of Pt nanoparticles in water, but Kimura et al. generated them in water under high pressure,22 and they proposed that the most probable candidate for reduction is PVP. Furthermore, Teranishi et al. studied IR spectra of the H2Pt(IV)Cl6 solution with PVP and concluded that the N and O sites of PVP coordinate Pt(IV) and have lower electron densities, and that the formation of this complex supports the idea that the PVP works to reduce the Pt species.9 Thus, the coordinated parts would donate electrons to reduce the Pt atoms.
Therefore, the formation reaction of Pt nanoparticles proceeds via continuous reduction reactions followed by nucleation in aqueous solutions, but the addition of ethanol changes the mechanism to a two-step reaction (rapid reduction from H2Pt(IV)Cl6 to H2Pt(II)Cl4, followed by slow nucleation).
6. Conclusion
We studied the nucleation reaction mechanism of Pt nanoparticles in the photoreduction of H2Pt(IV)Cl6 solution using dynamics measurements obtained by the HD-TG method. From the assignment of the species using the diffusion coefficient, the reduction of H2Pt(IV)Cl6 to H2Pt(II)Cl4 and the formation of Pt nuclei after UV pulse irradiation could be monitored. We showed that the amounts of reduced H2Pt(IV)Cl6 and generated Pt nuclei increased with the PVP concentration in a water solution. Furthermore, PVP serves to prevent aggregation of nanoparticles, as is well known, and the effect was also verified with the ethanol/water solvent. The addition of ethanol enhanced the reduction of H2Pt(IV)Cl6 but did not lead to swift formation of Pt nuclei, and nanoparticles were formed after the reduction of the reactant was complete. Thus we found that the reaction mechanism changed to a two-step reaction as the ethanol ratio was increased.Acknowledgements
This study was supported by the Grant for Young Researchers from the JGC-S Scholarship Foundation.References
- H. Imai, K. Izumi, M. Matsumoto, Y. Kubo, K. Kato and Y. Imai, J. Am. Chem. Soc., 2009, 131, 6293 CrossRef CAS.
- J. E. Mondloch, X. Yan and R. G. Finke, J. Am. Chem. Soc., 2009, 131, 6389 CrossRef CAS.
- M. M. Koebel, L. C. Jones and G. A. Somorjai, J. Nanopart. Res., 2008, 10, 1063 CrossRef CAS.
- P. Chen, W. Xu, X. Zhou, D. Panda and A. Kalininskiy, Chem. Phys. Lett., 2009, 470, 151 CrossRef CAS.
- H. Tsunoyama, H. Sakurai and T. Tsukuda, Chem. Phys. Lett., 2006, 429, 528 CrossRef CAS.
- C.-W. Chen and M. Akashi, Langmuir, 1997, 13, 6465 CrossRef CAS.
- M. Harada, K. Okamoto and M. Terazima, Langmuir, 2006, 22, 9142 CrossRef CAS.
- N. Toshima and T. Yonezawa, New J. Chem., 1998, 22, 1179 RSC.
- T. Teranishi, M. Hose, T. Tanaka and M. Miyake, J. Phys. Chem. B, 1999, 103, 3818 CrossRef CAS.
- H. Song, F. Kim, S. Connor, G. Somorjai and P. Yang, J. Phys. Chem. B, 2005, 109, 188 CrossRef CAS.
- C. S. Lin, M. R. Khan and S. D. Lin, J. Colloid Interface Sci., 2006, 299, 678 CrossRef CAS.
- J. M. Peteroski, Z. L. Wang, T. C. Green and M. A. El-Sayed, J. Phys. Chem. B, 1998, 102, 3316 CrossRef.
- M. Terazima, N. Hirota, S. E. Braslavsky, A. Mandelis, S. E. Bialkowski, G. J. Diebold, R. J. D. Miller, D. Fournier, R. A. Palmer and A. Tam, Pure Appl. Chem., 2004, 76, 1083 CrossRef CAS.
- M. Terazima, J. Photochem. Photobiol., C, 2002, 3, 81 CrossRef CAS.
- M. Harada and H. Einaga, Langmuir, 2006, 22, 2371 CrossRef CAS.
- Y. Nakazato, K. Taniguchi, S. Ono, T. Eitoku and K. Katayama, Phys. Chem. Chem. Phys., 2009, 11, 10064 RSC.
- M. Okuda and K. Katayama, Chem. Phys. Lett., 2007, 443, 158 CrossRef CAS.
- M. Okuda and K. Katayama, J. Phys. Chem. A, 2008, 112, 4545 CrossRef CAS.
- A. Ukai, N. Hirota and M. Terazima, Chem. Phys. Lett., 2000, 319, 427 CrossRef CAS.
- D. G. Duff, P. P. Edwards and B. F. G. Johnson, J. Phys. Chem., 1995, 99, 15934 CrossRef CAS.
- C. E. Hoppe, M. Lazzari, I. Pardinas-Blanco and M. A. Lopez-Quintela, Langmuir, 2006, 22, 7027 CrossRef CAS.
- Y. Kimura, D. Abe, T. Ohmori, M. Mizutani and M. Harada, Colloids Surf., A, 2003, 231, 131 CrossRef CAS.
| This journal is © the Owner Societies 2012 |
