Effects of localised and global convection on thermal explosion in a parallel-plate geometry
Received
17th August 2011
, Accepted 17th October 2011
First published on 9th November 2011
Abstract
During an exothermic reaction in a fluid, convection may ensue on a local scale and then develop to the scale of the entire vessel. In this work, we study the effects of both localised and global convection on thermal explosions occurring between parallel plates. Analytical relations are derived for the various transitions in regimes of convective and thermal behaviours. We show that these relations agree well with previous numerical work and with new simulations in the present investigation. We also determine analytically the time for onset of convection, as well as the temperature increase at that time, for stable and explosive systems. The effects of the Prandtl number of the fluid on the transitions between regimes are noted.
1 Introduction
Fluids involved in a spontaneous exothermic reaction in a vessel may undergo internal heating, which can result in explosion. This eventuality is determined by a loss of balance between the rate of heat generated within the reacting fluid and its transfer to the surroundings. The modes of heat transfer are conduction and convection. Frank-Kamenetskii1 was among the earliest researchers to investigate thermal explosion in a conductive system with exothermic, zeroth-order reaction and cooling at the boundaries. He defined the Frank-Kamenetskii number Fk = L2k0c0nqE/(κρ0CpRT02) as a ratio of the volumetric rate of heat production by the chemical reaction to that of heat removal by conduction (the notation is defined in Table 1). When Fk is greater than a critical value, Fkcr, the reaction is unstable and will proceed to explosion. When conduction is the sole mechanism for the transfer of heat, the highest temperature always occurs at the centre of a symmetrical domain; the value of Fkcr is a constant depending on the geometry. However, when the motion-inducing effect of buoyancy overcomes the inhibiting effects of viscosity and thermal conduction, the fluid cannot remain motionless and convection will start. The hot fluid moves away from the central zone of the domain towards the colder boundaries, and thus facilitates the removal of heat. In this case, the critical value of Fk for explosion is no longer a constant but becomes a function of the Rayleigh number Ra = βgL3ΔT/(κν).
Table 1 Nomenclature
|
c
0
|
Concentration of the reactant (assumed constant since consumption is ignored) |
|
C
p
|
Specific heat capacity at constant pressure |
|
D
|
Thickness of the thermal conduction layer |
|
E
|
Activation energy |
|
Fk
|
Frank-Kamenetskii's parameter for thermal explosions |
|
Fk
cr
|
Critical value of Fk |
|
g
|
Acceleration due to gravity |
|
g
|
Gravity vector |
|
k
|
Rate constant of chemical reaction |
|
k
0
|
Rate constant of chemical reaction at T0 |
|
l
|
Wavelength of instability at the onset of convection |
|
l
t
|
Thickness of the thermal boundary layer |
|
L
|
Characteristic length of the container |
|
L
c
|
Characteristic length of a hot region at the onset of localised convection |
|
L
y
|
The length of horizontal plates |
|
L
z
|
Separation between horizontal plates |
|
n
|
Order of reaction |
|
Nu
|
Nusselt number |
|
p
|
Pressure |
|
Pr
|
Prandtl number |
|
q
|
Heat of reaction |
|
Q
v
|
Volumetric rate of heat generation |
|
r
|
Characteristic size of the hot region |
|
R
|
Universal gas constant |
|
Ra
|
Rayleigh number |
|
Ra
H
|
Rayleigh number appropriate for convection due to a constant internal heating |
|
Ra
H,oc
|
Value of RaH at the onset of convection |
|
S
|
Strength of heating |
|
t
|
Time |
|
t
C
|
Time scale for natural convection |
|
t
D
|
Time scale for conduction |
|
t
ex
|
Time to explosion |
|
t
oc
|
Time to the onset of convection |
|
T
0
|
Initial temperature |
|
u
|
Velocity vector |
|
u
ave
|
Average speed of flows in the simulated domain |
|
u
y
|
Horizontal component of velocity vector |
|
u
z
|
Vertical component of velocity vector |
|
U
|
Velocity scale |
|
Z
|
Pre-exponential factor |
|
β
|
Coefficient for thermal expansion |
| ΔT |
Temperature rise |
| ΔToc |
Temperature rise at the onset of localised convection |
| ΔTs |
Characteristic temperature rise for an explosion |
|
γ
|
Ratio of specific heat |
|
κ
|
Thermal diffusivity |
|
ν
|
Kinematic viscosity |
|
η
|
Dimensionless activation energy |
|
θ
|
Dimensionless temperature |
|
ρ
|
Fluid density |
|
ρ
0
|
Fluid density at T0 |
|
υ
|
Dimensionless velocity vector |
|
τ
|
Dimensionless time |
| Π |
Dimensionless pressure |
|
ξ
|
Dimensionless position vector |
Much work has been done on the effect of natural convection on thermal explosion and a selection of earlier publications has been listed elsewhere.2 Merzhanov, Shtessel and co-workers3,4 have carried out important investigations, both numerical and experimental, on this subject. They mainly focused on a layer of reactive liquid between two rigid plates, and determined a parametric space of Ra vs. Fk depicting four regimes: (I) stable reactions with pure conduction, (II) stable reaction with natural convection, (III) explosion in the presence of convection and (IV) explosion in pure conduction.
However, previous work on the effects of natural convection on thermal explosion has focused on systems in which convection develops well before the onset of explosion.2–5 In such cases, the motion of the fluid occurs on the scale of the vessel containing the reacting fluid, and the boundaries of the vessel have an important role in the transfer of heat. This effect of the boundaries is reflected in the explosion criterion involving Fk and Ra, in which the length scale of the vessel (L) appears. Alternatively, the work of Liu et al.2,6 used criteria based on time scales for reaction, conduction of heat and convection to identify stable and explosive regimes, thus separating the effects of each of those mechanisms. Each of these time scales was based on the length scale of the vessel, and is therefore appropriate when conduction and convection occur on this scale. However, there are conditions under which a reacting fluid may undergo thermal explosion before convection has developed to the scale of the vessel. Such a scenario is not yet well understood.
In a different but related physical situation, natural convection in a layer of fluid confined between two horizontal surfaces has been studied extensively. The buoyancy force might be due to a higher temperature maintained at the bottom surface than that of the top one, as in the classical Rayleigh–Bénard convection,7 or due to internal heating by a volumetric heat source.8 Kulacki and Goldstein8,9 have carried out experimental and theoretical studies using a layer of water heated internally by a constant electric current passed through the medium. They identified the critical modified Rayleigh number, RaH, above which convection occurs as well as the changes of flow regimes when RaH increases.
The present work seeks to extend our fundamental understanding of explosions occurring in the presence of large-scale convection, as well as those occurring when fluid motion is still localised, and therefore independent of the length scale of the container. We focus on a parallel plate geometry in which convection and explosion develop on either similar or very different time scales, and derive analytical criteria for various transitions on the regime diagram. The effects of reactant consumption are ignored. The regime diagram is compared to the one obtained by Merzhanov and Shtessel3 for a liquid medium of Prandtl number, Pr = ν/κ, of 20. The effect of Pr on the transitions between different regimes is thereby discussed.
2 Theory
2.1 Transition from explosion before convection to convection before explosion
Consider a fluid undergoing the simple exothermic reaction A → B. A small, localised thermal perturbation in the vessel leads to the reactions occurring faster at that position in the container, and a hot region of length scale of r forms. The time scale for conduction of heat away from the hot region is| |  | (1) |
where κ is the thermal diffusivity. The heat generated by the reaction is conducted away from the hot region according to| |  | (2) |
where Qv is the volumetric rate of heating, ρ is the density of the fluid and Cp is the specific heat at constant pressure.
In such a hot region the buoyancy of the fluid grows and balances viscous friction such that
| |  | (3) |
where
uz is the vertical velocity of the fluid parcel,
ν is the kinematic viscosity,
g is the gravity acceleration,
β is the coefficient of thermal expansion and Δ
T is the temperature difference between the hot region and the vessel. The balance in
eqn (2) holds until convection becomes of the order of conduction,
i.e.| |  | (4) |
Eliminating the velocity
uz between
eqn (3) and (4) leads to
| |  | (5) |
i.e. convection in the fluid becomes important when the Rayleigh number based on the length scale of the hot region is of order 1. Using
eqn (2) in (5) gives the size of the hot region as
| |  | (6) |
In non-dimensional form,
| |  | (7) |
where
L is the length scale of the container enclosing the hot region.
Substituting eqn (6) in eqn (1) leads to the time scale for the onset of local convection as
| |  | (8) |
In non-dimensional form:
| |  | (9) |
where
tD =
L2/
κ is the time scale for heat conduction across the container. We should note that
eqn (9) is independent of the container size or shape. This contrasts with the time scale for global convection
tC ≈
L/(
βgLΔ
T)
1/2 used in previous studies on similar subjects.
3Eqn (9) shows that
Ra and
Fk have equal impact on
toc/
tD. Increasing either of them whilst the other is fixed shortens the induction period for fluid motion.
The temperature difference between the hot region and the surroundings at the time of onset of convection is given by substituting eqn (6) in eqn (5):
| |  | (10a,b) |
where Δ
Ts =
RT02/
E is a scale for the critical temperature increase in conductive systems.
1Eqn (10a,b) suggest that
Ra and
Fk have opposing effects on Δ
Toc/Δ
Ts. Furthermore,
eqn (9) and eqn (10a,b) show that increasing
Ra reduces both
toc/
tD and Δ
Toc/Δ
Ts, whilst increasing
Fk shortens
toc/
tD but magnifies Δ
Toc/Δ
Ts.
When convection is absent and little heat is lost by conduction, i.e. for nearly adiabatic conditions, the time to explosion has been shown to be1,10tex ≈ ρCpRT02/(QvE). A comparison between this time to explosion tex and the time for onset of convection toc in eqn (8) gives
| |  | (11) |
This relation can be expressed in terms of
Fk and
Ra as
Hence,
is a criterion separating conditions for which explosion occurs before the onset of convection (
Fk >
Ra2/3) and after onset of convection (
Fk <
Ra2/3). The relations developed above are independent of the geometry but will only be tested in this study with numerical results for a parallel plate system.
2.2 Stable reaction: transition from stationary to convective regimes in a parallel-plate geometry
When toc ≥ tD and tex ≫ toc, convection develops on the scale of the container and the boundary plays an important role in heat transfer. The criterion for onset of convection between parallel plates is,
where RaH = (gβL3/(κν))(SL2/(2κ)) is a form of Rayleigh number appropriate for convection due to internal heating (e.g. Roberts;11 Tritton and Zarraga12), and its critical value at the onset of convection is denoted by RaH,oc. Here S is the rate of internal heating, which has a unit of K s−1, and is defined as S = Qv/(ρ0Cp) in the case of a reactive fluid. The onset of convection in a fluid with uniform volumetric internal heating has been investigated experimentally by Kulacki and Goldstein8 in a horizontal layer of water, for which Pr ≈ 6. They measured RaH,oc ≈ 580, which agrees well with the value predicted by their linear stability theory.9
In the light of the definition of RaH,oc, we have
| |  | (13) |
Substituting
eqn (10a,b) in
eqn (13) gives
| |  | (14) |
It should be noted that
eqn (10a,b) was derived based on the local scale whilst
eqn (13) describes the onset of convection in the presence of global-scale conduction. The local-scale analysis balances the heat generation inside the hot region and heat loss due to conduction. This balance fixes the temperature gradient at the edge of the hot region, which grows over time without restriction until the walls are reached. On the other hand, the global scale analysis balances the heat generation inside the entire fluid layer and the conductive heat removal at the walls, whose temperature is kept constant. When a local hot region has grown to the scale of the vessel,
i.e. Lc ≈
L, the situations of the local and the global analyses are broadly similar except for conditions at the edges of the domain (one has constant temperature at a fixed position, while the other has a moving boundary). Indeed, it is not ideal to use the temperature rise derived on the local-scale to obtain the critical Rayleigh number for the onset of convection in the presence of global convection. However, this derivation enables us to make use of the published data on
RaH,oc for experiments on an internally heated fluid layer, which gives the closest physical resemblance to our reactive model.
2.3 Transition from stable to explosive reactions in the presence of strong convection
When tex ≫ toc and toc ≪ tD, heat is predominantly transferred by conduction across a thin boundary layer of thickness lt near the plates. The criterion for an explosion in the purely conductive limit, Fkcr, thus applies within the boundary layer with the length scale L replaced by lt,
where q is the heat of reaction, c0 is the concentration of reactant, and k0 is the rate constant of chemical reaction at the initial temperature T0. Hence, | |  | (15) |
where L/lt can be expressed in terms of the Nusselt number, Nu, and by definition RaH = RaFk/2, so that
| Nu ≈ RaHaPrb ≈ (RaFk)aPrb |
Hence,| |  | (16) |
represents the criterion for thermal explosion in the presence of global convection. The coefficients a and b can be obtained from experiments with inert fluids heated internally such as those by Kulacki and Goldstein.8
3 Governing equations and non-dimensionalisation
Consider the exothermic reaction A → B in a fluid contained between two infinite, horizontal parallel plates. The characteristic length scale of the system, L, is set to be half of the separation between plates. Assuming that the consumption of reactants is negligible (see e.g. Liu et al.2), the fundamental equations are those for the conservation of energy, momentum and mass. For an nth order reaction the conservation of energy is | |  | (17) |
where u is the velocity vector, k is the rate constant for the reaction, γ = Cp/Cv is the ratio of the specific heat at constant pressure to that at constant volume, and ρ0 is the density of the fluid at initial temperature T0. The Boussinesq approximation is applied and the density of the fluid is assumed to depend linearly on the temperature difference. The conservation of momentum is therefore expressed as| |  | (18) |
where p is the pressure and g is the gravity vector. Finally, the continuity equation isIn the present study a two-dimensional rectangular domain with an aspect ratio of Ly/Lz = 1.5 is employed. Here subscripts x and z indicate the horizontal and the vertical dimension, respectively. The temperature of the two parallel plates is maintained constant at T0. The fluid velocity is always zero at the horizontal plates. Free-slip conditions and zero heat flux are applied to the lateral boundaries. The boundary conditions are thus written as| | | u = 0; T = T0 at z = 0 and 2L; | (20) |
| |  | (21) |
Initially, the temperature T0 is uniform in space and the fluid is at rest. The initial conditions are| | | T = T0; u = 0 at t = 0 ∀x | (22) |
where x denotes the position vector.
To non-dimensionalise eqn (17)–(19), the following dimensionless quantities are defined for the temperature, velocity, pressure, position and time, respectively,
| |  | (23a–e) |
Here Δ
T represents a scale for temperature rise in the system and will be quantified below. The Arrhenius temperature dependence of the rate constant can be expressed in dimensionless form as
k =
Zexp[−
E/(
RT)] =
k0exp[
θ/(1 +
ηθ)], where
Z is the pre-exponential factor and
η =
RT0/
E. When the velocity scale
U is set to be
κ/
L,
eqn (17)–(19) can be written in the non-dimensional form
| |  | (24) |
| |  | (25) |
Eqn (24)–(26) show that the evolution of dimensionless temperature and velocity of the fluid flows are governed by five dimensionless groups:
η,
γ,
Pr,
Fk and
Ra. The values of
η and
γ are fixed for a given chemical reaction, and
Pr = 1 is assumed for a gaseous system. Thus the behaviour of the system can be described by
Fk and
Ra for a given geometry. In the next section, we explore this to construct a parametric space for the thermal and hydrodynamic behaviour of the system.
4 Schematic regime diagram for thermal explosions and natural convection
A schematic regime diagram using Fk and Ra as the coordinates is constructed (Fig. 1) to summarise the possible fates of a reactive system. Five main regimes are distinguished: (I) stationary fluid with stable reaction; (II) convecting fluid with stable reaction, (III) explosions in the presence of natural convection, (IV) explosions before the occurrence of convection but subject to cooling by conduction, and (V) adiabatic explosions without convection. Regimes (I)–(IV) were first proposed by Merzhanov and Shtessel3 in their numerical study on a reactive fluid. The current work includes the new adiabatic regime (V) and provides a theoretical scaling for transitions (b), (c) and (d). A summary of these transitions is given in Table 2.
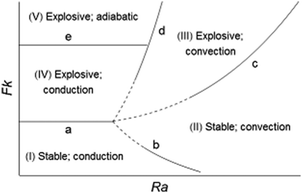 |
| | Fig. 1 Schematic regime diagram for thermal explosion and onset of convection. | |
Table 2 Summary of the scaling for various transitions on the regime diagram in Fig. 1. Transition (e) was previously studied by the authors10
| Transition |
Scaling relationship |
Conditions |
| (a) |
Fk
= Fkcr (parallel plates: 0.88; sphere: 3.324) |
Ra
< Raoc |
| (b) |
Fk
≈ RaH,oc5/3/Ra (eqn (14)) |
t
oc/tD > 1 and tex/tD → ∞ |
| (c) |
Fk
≈ Ra2a/(1 − 2a) (eqn (16)) |
t
oc ≪ tD and tex/toc ≫ 1 |
| (d) |
Fk
≈ Ra2/3 (eqn (12)) |
t
oc/tD < 1 and tex/tD < 1 |
| (e) |
Fk
= const. (parallel plates: 5; sphere: 12.5) |
t
ex/toc < 1 |
Transition (a) shows the minimum Fk for explosion when conduction is the only mechanism for heat transfer, as proposed by Frank-Kamenetskii1 in his classical theory of thermal explosions. The value of Fkcr was determined from the heat balance over the entire container and is a constant, taking the value 0.88 for infinite horizontal parallel plates and 3.32 for a spherical domain.
In the non-explosive, stationary regime (I) conduction is the only mechanism for transfer of heat. This regime occurs for low Fk and Ra. For a given Fk there exists a threshold of Ra above which convective transport takes effect. The transition line (b) separates the non-explosive reactions in a stationary fluid (regime I) from those able to cause persistent convective motion (regime II), as given by eqn (14). This transition is valid for toc/tD > 1 and tex/tD → ∞, i.e. convection develops in a conductive system without explosion.
Transition (c) depicts the minimum Fk for thermal runaway in the presence of natural convection. This transition is described by eqn (16), provided that toc ≪ tD and tex ≫ toc are satisfied, i.e. strong convection becomes well established before an explosion (should it occur). This indicates that the phenomenon of convection is observed on the global scale L of the vessel.
Transition (d) is described by eqn (12) for circumstances where toc/tD < 1 and tex/tD < 1, i.e. low Ra and high Fk. This transition occurs when heating and convection develop in a localised area of the vessel.
Transition (e) further divides the stationary explosive zone into (IV) and (V). Regime (IV) includes explosions delayed by conductive cooling, whilst in regime (V) the explosions are virtually adiabatic. Thermal runaway of these two types has been studied by the authors in a recent work.10 This transition, like (a), is described by a constant value of the Frank-Kamenetskii number, which depends on the geometry of the system.
The ranges of validity of each of these scaling relations will be determined by numerical simulations in the following sections.
5 Numerical method
The problem was solved numerically using the partial differential equation solver Fastflo,13 which uses the finite element method. The algorithm adopted was the same as described before.14 The domain consisting of two horizontal parallel plates separated by Lz = 0.1 m (=2L) is studied. The horizontal dimension (Ly) of the plates was 0.15 m. This aspect ratio of the domain was chosen to coincide with the wavelength of the fluid motion at the onset of convection. Indeed, for a system bounded by two horizontal rigid surfaces with uniform internal heating, the non-dimensional wavenumber, α = 2πd/l, has been found9,15 to be 4; here d is the thickness of the conduction layer and l is the wavelength of the instability. Therefore, the minimum ratio of the depth of the fluid layer, i.e. the separation between plates, to the horizontal dimension of the domain for capturing the features of the onset of convection is d/l ≈ 2/3, i.e. Lz![[thin space (1/6-em)]](https://www.rsc.org/images/entities/char_2009.gif) ∶
∶![[thin space (1/6-em)]](https://www.rsc.org/images/entities/char_2009.gif) Ly = 1
Ly = 1![[thin space (1/6-em)]](https://www.rsc.org/images/entities/char_2009.gif) ∶
∶![[thin space (1/6-em)]](https://www.rsc.org/images/entities/char_2009.gif) 1.5. The temperature of the plates was maintained constant at T0 = 636.2 K and the concentration of the reactant was c0 = 0.37 mol m−3 (corresponding to p ≈ 0.02 bar). The order of reaction, n, was assumed to be 1. The physico-chemical properties, selected to be representative of an exothermic gas-phase decomposition, were: q = 124 kJ mol−1, Cp = 2250 J kg−1 K−1, Z = 1.24 × 10¹⁴ s−1, E/R = 23
1.5. The temperature of the plates was maintained constant at T0 = 636.2 K and the concentration of the reactant was c0 = 0.37 mol m−3 (corresponding to p ≈ 0.02 bar). The order of reaction, n, was assumed to be 1. The physico-chemical properties, selected to be representative of an exothermic gas-phase decomposition, were: q = 124 kJ mol−1, Cp = 2250 J kg−1 K−1, Z = 1.24 × 10¹⁴ s−1, E/R = 23![[thin space (1/6-em)]](https://www.rsc.org/images/entities/char_2009.gif) 280 K, Pr = 1 and γ = 1.018. The other non-dimensional group identified in Section 3 becomes η = 0.027. All simulations were run for 40 s, except for early termination by an explosion. The time step was 0.0025 s for convective cases and 0.01 s for conductive ones.
280 K, Pr = 1 and γ = 1.018. The other non-dimensional group identified in Section 3 becomes η = 0.027. All simulations were run for 40 s, except for early termination by an explosion. The time step was 0.0025 s for convective cases and 0.01 s for conductive ones.
6 Numerical definitions for the onset of convection and explosion
Convection can only be detected in numerical experiments when the initially infinitesimal disturbances in fluid velocity have grown to a measurable level. This detectable convective effect has been termed ‘manifest convection’ by Forster,16 who studied the onset of convection in a semi-infinite fluid layer heated from below (or cooled from above). The occurrence of manifest convection was determined as the initial velocity disturbances being amplified by a given factor. In the present work, a much simpler criterion was chosen to identify the onset of convection, defined as the moment when uave/U > 0.1, where uave is the average speed of the flow inside the domain of simulation. The cut-off value of 0.1 was selected such that the time to the onset of convection is always approximately equal to, or slightly shorter than that obtained by observing the convective effect on the heat flux across the boundaries. Indeed, convection increases the flux across the top plate or hemisphere compared to that across the bottom one. Thus using uave/U > 0.1 provides a stringent yet simple criterion for the onset of convection.
An explosive reaction features a sudden, large temperature increase which is unbounded when reactant consumption is ignored. The moment when  is taken here to be the time of ignition, where
  denotes the first derivative of dimensionless temperature over time at the jth time step. On the other hand, in a stable reaction the maximum temperature inside a system is always bounded. In the parallel plate geometry, this maximum temperature may oscillate about a mean value at sufficiently high Rayleigh number. This is a result of a transition in the convection pattern17 from stable rolls to unstable ones. We note that this instability is not observed in the spherical geometry.
7 Time to the onset of convection
The dimensionless times to the onset of convection calculated numerically are plotted in Fig. 2. The data shown are for the parallel plate geometry with toc/tD < 1, i.e. when convection takes place before conductive heat loss at the walls of the container is significant, and thus the boundaries impose negligible effect on the values of toc. Both toc/tD for stable and explosive cases fall on a straight line, as expected from eqn (9). The dotted curves with various symbols illustrate the numerical calculations of toc by Shtessel et al.4 for parallel plates and a fluid of Pr = 20 at Ra = 2500, 6250 and 12![[thin space (1/6-em)]](https://www.rsc.org/images/entities/char_2009.gif) 500. Both sets of results are in good agreement with scaling relation (9). The apparent effect of a higher Pr is to decrease toc/tD. This is a result of the manner in which the onset of convective motion is detected. Both in laboratory experiments and in numerical simulations, motion is assumed to start when the velocity of the fluid attains a given finite magnitude.3,17,18 The growth of the intensity of fluid motion is indeed more significant for fluids of higher Pr. However, it has been shown theoretically that the onset of fluid motion is independent of Pr (e.g. Chandrasekhar19).
500. Both sets of results are in good agreement with scaling relation (9). The apparent effect of a higher Pr is to decrease toc/tD. This is a result of the manner in which the onset of convective motion is detected. Both in laboratory experiments and in numerical simulations, motion is assumed to start when the velocity of the fluid attains a given finite magnitude.3,17,18 The growth of the intensity of fluid motion is indeed more significant for fluids of higher Pr. However, it has been shown theoretically that the onset of fluid motion is independent of Pr (e.g. Chandrasekhar19).
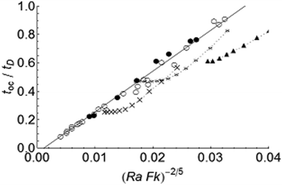 |
| | Fig. 2 Dimensionless time for the onset of convection (toc/tD) as a function of (FkRa)−2/5. Simulations for stable reactions and explosions are denoted by the filled and open circles, respectively. The solid line represents the scaling result in eqn (9). Shtessel et al.'s4 simulations at Ra = 2500 (triangles), 6250 (stars), 12![[thin space (1/6-em)]](https://www.rsc.org/images/entities/char_2009.gif) 500 (crosses) for a fluid with Pr = 20 are also plotted. 500 (crosses) for a fluid with Pr = 20 are also plotted. | |
8 The temperature rise at the onset of convection
Fig. 3 shows the temperature rise at the onset of convection for both stable and explosive cases. An approximately linear relation between ΔToc/ΔTs and Ra−2/5Fk3/5 (c.f. eqn (10a,b)) can be seen for explosive cases with toc/tex < 0.7, as well as for stable reactions. When toc/tex > 0.7 the results depart from eqn (10a,b), and the deviation increases as toc/tex approaches 1. This is expected owing to the large temperature increase as a system approaches explosion.
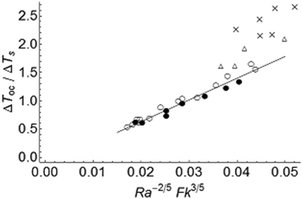 |
| | Fig. 3 Dimensionless temperature rise at the onset of convection ΔToc/ΔTs as a function of Fk3/5Ra−2/5 for cases with toc < tD. Data are categorised based on the ratio toc/tex: the filled circles denote stable reactions (tex → ∞). The other symbols denote explosive reactions with toc/tex < 0.7 (open circles); 0.7 < toc/tex < 0.9 (open triangles), and 0.9 < toc/tex < 1 (crosses). The solid line represents scaling relation (10b). | |
9 Transitions on the regime diagram
9.1 Stable reaction: transition from stationary to convective regimes
Fig. 4 shows the results for the transition between stationary and convective regimes for the parallel plate geometry from three independent studies. The present work, for Pr = 1, is denoted by the filled (conductive) and open (convective) circles. The dashed curve depicts Jones'5 calculations using linear stability analysis, which was performed for a fluid of Pr = 1 bounded by two rigid plates, with the same configuration as in the current work. The solid curve shows the work by Merzhanov and Shtessel3 for a fluid with Pr = 20 bounded by free surfaces. Dumont and co-workers20 performed a linear stability analysis for a reactive fluid with Fk < Fkcr, to obtain the critical Ra for the onset of convection in a fluid layer with Pr = 1 bounded by free surfaces. The stationary solution for the dimensionless temperature rise, θss, was assumed small and the exponential source term in the energy equation was replaced by Fk (1 + θss). Their analytical result for the critical Ra is reproduced in Fig. 4 as the dash-dotted line, which agrees well with their numerical calculation, denoted by the dotted line. Some deviation occurs at higher Fk, possibly due to the breakdown of the assumption of a small θss.
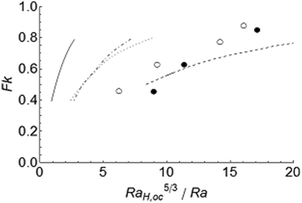 |
| | Fig. 4 Transition between the conductive and the convective regimes for stable reactions. The present results are shown by the open (convective) and filled (stationary) circles, using RaH,oc = 300. The dashed line represents Jones' calculation8 (RaH,oc = 300). The solid line denotes Merzhanov and Shtessel's6 numerical results for Pr = 20 (RaH,oc = 109). The dotted and dash-dotted lines represent Dumont et al.'s20 (RaH,oc = 109) numerical and analytical results, respectively. | |
The values of critical Rayleigh number RaH,oc used in Fig. 4 merit some discussion. For the simulation of the lowest Frank-Kamenetskii number in the present work, Fk ≈ 0.4, we obtained the critical Rayleigh number RaH,oc ≈ 350, above which convection takes place. This value of RaH,oc is significantly lower than the experimentally observed value8 of 580, but close to the prediction of the energy theory of 300 for rigid plates.9 This might suggest that convection is detected earlier in numerical simulations than experimentally. Dumont et al.'s20 analytical and numerical results suggest RaH,oc ≈ 120 for Fk = 0.4. This is also much lower than the linear-theory value (RaH,oc = 265.5), and much closer to the prediction of the energy theory,9RaH,oc = 109, for an internally heated fluid layer bounded by two free surfaces. Therefore, the values of RaH,oc from energy theory, for appropriate boundary conditions, were used in eqn (14) to examine the transition from the stationary to convective regimes in a reacting but non-explosive fluid, shown in Fig. 4.
According to eqn (14) the results presented in Fig. 4 are expected to be linear. However, all data exhibit some curvature, especially at larger Fk. This is due to the assumption of a constant volumetric heat source in the derivation of eqn (14) whilst a chemical reaction has an exponential source term for heat generation.
9.2 Transition from stable to explosive reactions in the presence of strong convection
As mentioned before, Kulacki and Goldstein8 carried out experiments on a layer of fluid bounded at the top and bottom by rigid plates and undergoing volumetric, Joule heating by passing an electric current in the horizontal direction. They obtained Nu ≈ RaH0.228 from the heat transfer data for the upper plate in the range 1104 ≤ RaH ≤ 3.78 × 10⁵ and for Pr = 6. Setting a = 0.228 in eqn (16) leads to Fk ≈ Ra0.838. A good agreement between this scaling and our simulations is shown in Fig. 5, confirming that the behaviour of the explosion limit in the presence of strong convection may be predicted using eqn (16), combined with heat transfer data for an internally heated, inert fluid.
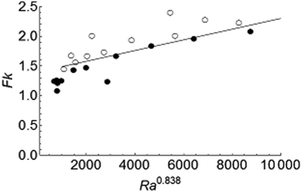 |
| | Fig. 5 The transition between stable and explosive regimes in the presence of strong convection. Filled and open circles denote stable reactions and explosions, respectively. The solid line represents scaling relation (16) with a = 0.228. | |
9.3 Transition from explosion before convection to convection before explosion
The scaling for transition between systems exploding before and after the onset of convection, described by eqn (12), is confirmed numerically in Fig. 6. Only cases with toc < tD and tex < tD are shown since the scaling for both toc and tex was derived based on the dimension of a local hot region, and is independent of the length scale of the container. The open and filled circles denote cases exploding in the presence and in the absence of convection, respectively. The solid line sketches the transition between these two sets of data. The dashed line represents computations by Merzhanov and Shtessel3 for a fluid of Pr = 20. The good agreement between the two lines shows that the transition is independent of Pr.
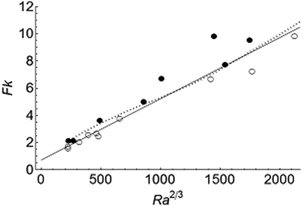 |
| | Fig. 6 Transition between the convective (open circles) and conductive (filled circles) regimes for cases satisfying tex < tD and toc < tD. The solid line represents scaling relation (12). Merzhanov and Shtessel's3 numerical calculations for a fluid of Pr = 20 are shown by the dotted line. | |
10 Regime diagram
A regime diagram summarising all numerical and scaling results for parallel plates is presented in Fig. 7. The filled circles and filled triangles denote stable reactions in (I) pure conduction, and (II) in the presence of natural convection, respectively. The open triangles represent (III) systems exploding after convection has begun, whilst the open circles depict (IV) those exploding before occurrence of any fluid motion. The parts of the boundaries (a)–(d) in black represent the scaling relations in Table 2 under appropriate conditions. Outside the applicable ranges of the scaling relationships stated in Table 2, the boundaries are drawn schematically by dashed curves to separate the numerical results of different types of behaviour. Fig. 7 shows a good agreement between numerical results and analytical predictions. We note that regime (V), previously illustrated in Fig. 1 and Table 2, is not shown here to have clarity of the graph at low values of Fk.
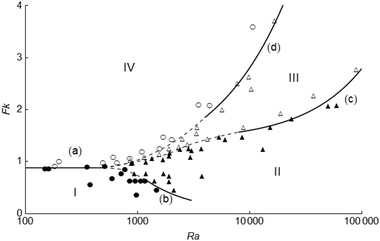 |
| | Fig. 7 Regime diagram summarising the numerical results. The filled circles and triangles denote stable reactions in pure conduction, and those in the presence of convection, respectively. The open circles represent explosion in pure conduction, and open triangles represent explosions in the presence of natural convection. The boundaries (a)–(d) and regimes (I)–(IV) are the same as those described in Fig. 1. The parts of curves drawn in black are based on the scaling relationships given in Table 1, whilst the dashed parts are schematic. | |
11 Effect of the Prandtl number on the regime diagram
The effect of the Prandtl number of the fluid on the regime diagram for thermal explosions is examined in Fig. 8, which compares Merzhanov and Shtessel's results for Pr = 20 (dashed curves) and the present work for Pr = 1 (solid curves). We expect a significant effect of Pr in systems with strong convection only, such as those in transition (c).
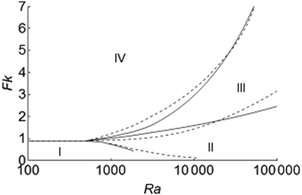 |
| | Fig. 8 Comparison of regime diagrams for thermal explosion and onset of convection for fluids with Pr = 20 by Merzhanov and Shtessel7 and with Pr = 1 (current work), denoted by the dashed and solid lines, respectively. The four regimes (I)–(IV) are the same as those in Fig. 1. | |
For a given Ra below 1.5 × 10⁴, a fluid of Pr = 20 explodes at a lower Fk than a fluid of Pr = 1 whilst the opposite is observed for Ra > 1.5 × 10⁴. An explanation might be suggested by examining eqn (25), which shows equal impact of Ra and Pr on the buoyancy term. For a given Pr, increasing Ra enhances the buoyancy force, which facilitates the removal of heat and thus a higher Fkc is required for explosion. On the other hand, when Ra is fixed, a higher Pr will have the same effect on Fkc, provided that Ra is sufficiently large and the viscous term is negligible compared to the buoyancy term.
12 Conclusion
The thermal and hydrodynamic behaviour of a reactive fluid contained in parallel plate enclosures has been investigated by means of scaling and numerical simulations. Previous work in this field has focused on analyses using Fk and Ra, which are based on the dimension of the vessel. The present study differentiates the situations where convection is subject to the boundary conditions and the geometry of the enclosing vessel from those where convection develops locally.
When the fluid motion occurs before conduction is established across the entire vessel, i.e. toc/tD < 1, the local length scale of the heated fluid parcel dominates the fluid's behaviour, which is independent of the features of the vessel walls. Investigation on the local scale showed that toc/tD was of the order (RaFk)−2/5 for stable and explosive processes alike. The corresponding dimensionless temperature rise was proportional to Ra−2/5Fk3/5 for cases of toc/tex < 0.7. In the opposite situation where convection takes place in the presence of a fully-developed conductive background temperature distribution, i.e. toc/tD > 1, the conditions at the vessel walls play an important role in the onset of fluid motion.
When a reaction proceeds in the presence of vigorous convection, the explosion limit can be estimated by Fk ≈ Ra2a/(1−2a). The coefficient a can be found from heat transfer data obtained for inert fluids in the geometry of interest. In the explosive regime, the transition between explosions in pure conduction and those in the presence of fluid motion can be universally described by Fk ≈ Ra2/3 regardless of the geometry of the vessel.
The effect of Pr on various transitions on the regime diagram was demonstrated by comparing the present results for Pr = 1 with those for Pr = 20 by Merzhanov and Shtessel.3 The explosion limit at higher Ra was found to be most affected by a variation in Pr. The comparison indicates that at sufficiently high Ra, when the viscous effect is negligible, a lower rate of heat generation is required for a thermal runaway in fluids of lower Pr than for those of higher Pr.
Acknowledgements
T.-Y. Liu is grateful for financial support from the Cambridge Overseas Trust, the Department of Chemical Engineering and Biotechnology, and for a C. T. Taylor Studentship.
References
-
D. A. Frank-Kamenetskii, Diffusion and Heat Exchange in Chemical Kinetics (translation by J.P. Appleton), Plenum Press, New York, 1969 Search PubMed.
- T.-Y. Liu, A. N. Campbell, S. S. S. Cardoso and A. N. Hayhurst, Phys. Chem. Chem. Phys., 2008, 10, 5521–5530 RSC.
- A. G. Merzhanov and E. A. Shtessel, Astronaut. Acta, 1973, 18, 191–199 Search PubMed.
- É. A. Shtessel, K. V. Pribytkova and A. G. Merzhanov, Fiz. Goreniya Vzryva, 1971, 2, 167 Search PubMed.
- D. R. Jones, Int. J. Heat Mass Transfer, 1973, 16, 157–167 CrossRef CAS.
- T.-Y. Liu, A. N. Campbell, S. S. S. Cardoso and A. N. Hayhurst, Combust. Flame, 2010, 157, 230–239 CrossRef CAS.
- Lord Rayleigh, Philos. Mag., Ser. 6, 1916, 32, 529–546 Search PubMed.
- F. A. Kulacki and R. J. Goldstein, J. Fluid Mech., 1972, 55, 271–287 CrossRef.
- F. A. Kulacki and R. J. Goldstein, Appl. Sci. Res., 1975, 31, 81–109 CrossRef.
- T.-Y. Liu and S. S. S. Cardoso, Combust. Flame, 2011 Search PubMed (sub-judice).
- P. H. Roberts, J. Fluid Mech., 1967, 30, 33–49 CrossRef.
- D. J. Tritton and M. N. Zarraga, J. Fluid Mech., 1967, 30, 21–31 CrossRef.
- CSIRO, Fastflo Tutorial Guide (version 3), Australia, 2000 Search PubMed.
- S. S. S. Cardoso, P. C. Kan, K. K. Savjani, A. N. Hayhurst and J. F. Griffiths, Phys. Chem. Chem. Phys., 2004, 6, 1687–1696 RSC.
- M. Tveitereid, Int. J. Heat Mass Transfer, 1978, 21, 335–339 CrossRef.
- T. D. Foster, Phys. Fluids, 1965, 8, 1770–1774 CrossRef CAS.
- I. F. Davenport and C. J. King, Int. J. Heat Mass Transfer, 1974, 17, 69–76 CrossRef.
- T. D. Foster, Phys. Fluids, 1968, 11, 1257–1262 CrossRef.
-
S. Chandrasekhar, Hydrodynamic and hydromagnetic stability, Dover Publications, 1961 Search PubMed.
- T. Dumont, S. Genieys, M. Massot and V. A. Volpert, SIAM J. Appl. Math., 2002, 63, 351–372 CrossRef.
|
| This journal is © the Owner Societies 2012 |
Click here to see how this site uses Cookies. View our privacy policy here. 


![[thin space (1/6-em)]](https://www.rsc.org/images/entities/char_2009.gif) ∶
∶![[thin space (1/6-em)]](https://www.rsc.org/images/entities/char_2009.gif) Ly = 1
Ly = 1![[thin space (1/6-em)]](https://www.rsc.org/images/entities/char_2009.gif) ∶
∶![[thin space (1/6-em)]](https://www.rsc.org/images/entities/char_2009.gif) 1.5. The temperature of the plates was maintained constant at T0 = 636.2 K and the concentration of the reactant was c0 = 0.37 mol m−3 (corresponding to p ≈ 0.02 bar). The order of reaction, n, was assumed to be 1. The physico-chemical properties, selected to be representative of an exothermic gas-phase decomposition, were: q = 124 kJ mol−1, Cp = 2250 J kg−1 K−1, Z = 1.24 × 10¹⁴ s−1, E/R = 23
1.5. The temperature of the plates was maintained constant at T0 = 636.2 K and the concentration of the reactant was c0 = 0.37 mol m−3 (corresponding to p ≈ 0.02 bar). The order of reaction, n, was assumed to be 1. The physico-chemical properties, selected to be representative of an exothermic gas-phase decomposition, were: q = 124 kJ mol−1, Cp = 2250 J kg−1 K−1, Z = 1.24 × 10¹⁴ s−1, E/R = 23![[thin space (1/6-em)]](https://www.rsc.org/images/entities/char_2009.gif) 280 K, Pr = 1 and γ = 1.018. The other non-dimensional group identified in Section 3 becomes η = 0.027. All simulations were run for 40 s, except for early termination by an explosion. The time step was 0.0025 s for convective cases and 0.01 s for conductive ones.
280 K, Pr = 1 and γ = 1.018. The other non-dimensional group identified in Section 3 becomes η = 0.027. All simulations were run for 40 s, except for early termination by an explosion. The time step was 0.0025 s for convective cases and 0.01 s for conductive ones.
 is taken here to be the time of ignition, where
  denotes the first derivative of dimensionless temperature over time at the jth time step. On the other hand, in a stable reaction the maximum temperature inside a system is always bounded. In the parallel plate geometry, this maximum temperature may oscillate about a mean value at sufficiently high Rayleigh number. This is a result of a transition in the convection pattern17 from stable rolls to unstable ones. We note that this instability is not observed in the spherical geometry.
![[thin space (1/6-em)]](https://www.rsc.org/images/entities/char_2009.gif) 500. Both sets of results are in good agreement with scaling relation (9). The apparent effect of a higher Pr is to decrease toc/tD. This is a result of the manner in which the onset of convective motion is detected. Both in laboratory experiments and in numerical simulations, motion is assumed to start when the velocity of the fluid attains a given finite magnitude.3,17,18 The growth of the intensity of fluid motion is indeed more significant for fluids of higher Pr. However, it has been shown theoretically that the onset of fluid motion is independent of Pr (e.g. Chandrasekhar19).
500. Both sets of results are in good agreement with scaling relation (9). The apparent effect of a higher Pr is to decrease toc/tD. This is a result of the manner in which the onset of convective motion is detected. Both in laboratory experiments and in numerical simulations, motion is assumed to start when the velocity of the fluid attains a given finite magnitude.3,17,18 The growth of the intensity of fluid motion is indeed more significant for fluids of higher Pr. However, it has been shown theoretically that the onset of fluid motion is independent of Pr (e.g. Chandrasekhar19).

![[thin space (1/6-em)]](https://www.rsc.org/images/entities/char_2009.gif) 500 (crosses) for a fluid with Pr = 20 are also plotted.
500 (crosses) for a fluid with Pr = 20 are also plotted.


