The importance of surface morphology in controlling the selectivity of polycrystalline copper for CO2 electroreduction†
Wei
Tang
a,
Andrew A.
Peterson
b,
Ana Sofia
Varela
a,
Zarko P.
Jovanov
a,
Lone
Bech
a,
William J.
Durand
b,
Søren
Dahl
a,
Jens K.
Nørskov
b and
Ib
Chorkendorff
*a
aCenter for Individual Nanoparticle Functionality, Department of Physics, Building 312, Technical University of Denmark, DK-2800 Lyngby, Denmark. E-mail: ibchork@fysik.dtu.dk
bSUNCAT Center for Interface Science and Catalysis, Department of Chemical Engineering, Stanford University, Stanford, CA, USA
First published on 9th November 2011
Abstract
This communication examines the effect of the surface morphology of polycrystalline copper on electroreduction of CO2. We find that a copper nanoparticle covered electrode shows better selectivity towards hydrocarbons compared with the two other studied surfaces, an electropolished copper electrode and an argon sputtered copper electrode. Density functional theory calculations provide insight into the surface morphology effect.
The electrochemical conversion of CO2 into hydrocarbons is of growing interest, since it could offer a way to continue the convenient use of carbon based fuels in a CO2 neutral manner. The challenge is to convert CO2 under ambient conditions, such that the reaction can run at affordable cost and be adopted on a wide scale in decentralized units positioned where surplus electrical energy is available. The electrical energy would be provided by sustainable energy options (such as wind, solar and hydro) where the electricity production displays strong temporal variations and therefore must be averaged on different time scales. Electrochemical fixation of CO2 is potentially a pathway for long term chemical storage of sustainable energy,1 providing the products which could transport fuel.
In the past few decades, many metals were investigated as catalysts for the electroreduction of CO2 with a view to improving the yield of desirable molecules and control the product selectivity.2 Among the possible products, hydrocarbons such as methane and ethylene are the most desired, due to their high energy densities and widespread use in the current infrastructure. Among the studied metals, copper is the only metal that produces hydrocarbons with high Faradaic efficiency, instead of producing less valuable products such as formic acid or CO.3,4 To produce useful hydrocarbons, such as CH4 (CO2 + 2H2O → CH4 + 2O2), a total potential of about 2.5 V is required, including the thermodynamic reaction potential of 1.1 V, an overpotential of ∼1 V4 on the copper electrode for the hydrogenation reaction and an overpotential of ∼0.4 V5,6 for the oxygen evolution reaction. This results in a total energy efficiency of ∼40%. With its unique electrocatalytic properties and high abundance, polycrystalline copper is a promising candidate for the electrochemical conversion of CO2 at an industrial scale. Therefore, it is essential to understand how to prepare a polycrystalline copper electrode in order to optimize its catalytic activity. In the past, it has been reported that the Faradaic efficiencies for this reaction are strongly affected by pretreatment of the copper electrode.7,8 However, the underlying reasons for the influence of the pretreatment are still not clearly established. In this work, different pretreatments were used to prepare copper electrodes for CO2 reduction. Three copper electrodes (Samples A, B and C) were investigated:
Sample A: a copper electrode (25 mm × 12.5 mm, thickness 1 mm, 99.999%, Goodfellow) and a connecting copper wire (diameter 0.5 mm, 99.999%, Goodfellow) were cleaned by electropolishing. The electropolishing was performed by applying a potential of +2 V between the copper electrode and a platinum cathode in phosphoric acid (1 mol L−1) for 20 min and rinsing the copper electrode with deionized water (18 MΩ). As electropolishing occurs at anodic potential, a certain amount of electrode material is stripped from the surface along with surface impurities.9,10 During the stripping, the protruding parts in the surface profile are preferentially dissolved and thereby results in smooth, ordered terraces,9–11 as shown by scanning tunneling microscopy (STM).9,12,13 The surface morphology resulting from electropolishing is heavily influenced by electrolyte ion adsorption.12,13 Strong binding of adsorbates enhances surface diffusion of metal atoms.12 The terraces are stabilized by the formation of ordered adsorbate layers.13 Consequently, the terraces are harder to dissolve than steps. Electropolishing in phosphoric acid is a routine procedure for the preparation of planar copper single crystal surfaces. The sample shows a smooth surface in scanning electron microscopy (SEM) as shown in Fig. 1a. Hence, based on our SEM images and earlier STM studies,9,14 the electropolished surface will probably be dominated by low indexed terraces such as (100) and (111), but will also contain a significant number of low coordinated surface sites such as steps.
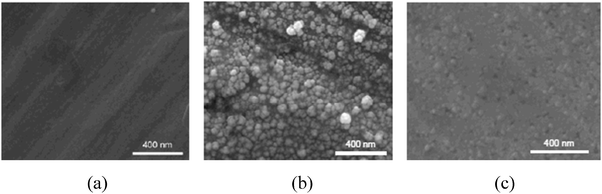 | ||
| Fig. 1 Scanning Electron Microscopy for three surfaces: (a) Sample A (electropolished surface), (b) Sample B (copper nanoparticle covered surface) and (c) Sample C (sputtered surface). | ||
Sample B: a copper electrode as in Sample A covered with nanoparticles. The copper nanoparticles were formed in two steps. In the first step, the potential at the electropolished copper electrode was scanned between −0.6 and +1.15 V vs. RHE (see Fig. 2a) at 20 mV s−1 in N2 saturated KClO4 (0.1 M, Aldrich, 99.99%). The pH value of the electrolyte during the cyclic voltammetry was influenced by hydrogen evolution during the most scan potentials and it increased from an initially neutral value of ∼7 up to the finally measured value of 10.5 after 20 cycles. After cyclic voltammetry, the electrolyte turned slightly yellow-brownish due to eventually dissolved species, as well as to formation of suspended brownish particles. According to the Pourbaix diagram for copper,15 the species present in alkaline solution are not expected to be the Cu2+ ions, but rather CuOxHy species. In the second step, along with reduction of the copper containing species formed at the first step, the copper was redeposited on the electrode surface. The redeposition was performed in CO2 saturated KClO4 (pH = 6.0, 0.1 M) with a constant bias of −1.3 V vs. RHE for 20 minutes. The redeposition of copper is observed to be dependent on the pH value of the electrolyte, as reported previously.16 Purging with CO2 was used to adjust the pH of the electrolyte to a value of ∼6. After redeposition of copper, the electrode surface turned dark as shown in Fig. S1 (ESI†). SEM was used to characterize the dark electrode. As seen in Fig. 1b a few layers of copper nanoparticles with size of 50–100 nm cover the copper surface. Estimated from the SEM image, the surface area of Sample B is greater than the geometric surface area of the electrode by a factor of 2–3.
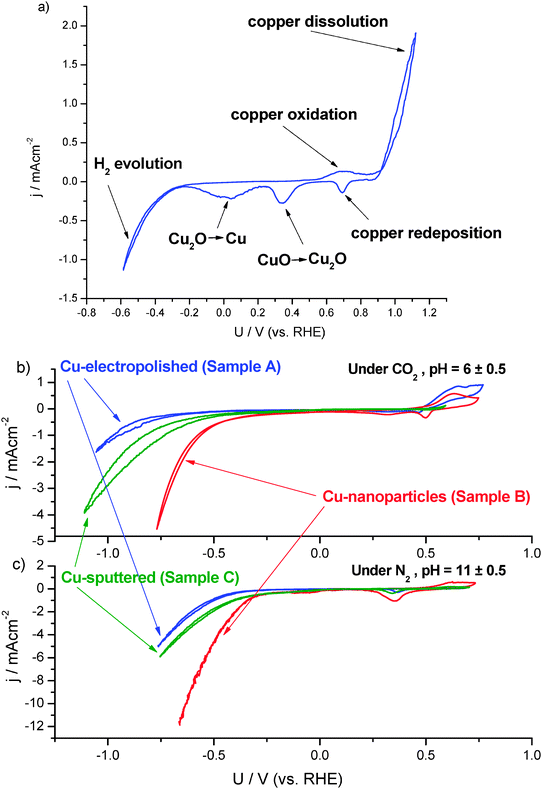 | ||
| Fig. 2 Cyclic voltammogram of the formation of copper nanoparticles in 0.1 M KClO4 purged with N2 at pH 10.5 (a); cyclic voltammogram of the electropolished copper surface, copper nanoparticle covered surface and sputtered copper surface in 0.1 M KClO4 purged with CO2 (b) and N2 (c). The current density is normalized by the geometric area of the electrode surface. The overpotentials are corrected for ohmic resistance between the working and reference electrode. | ||
Sample C: a copper electrode as in Sample A sputtered with argon ions. The sputtering was conducted in an XPS system (Theta Probe, Thermo Scientific) with 3 keV Ar+ ions and 4 μA emission current for 10 min. At each cycle of Ar+ sputtering, an area of 10 mm × 10 mm was bombarded with Ar+ ions, removing approximately 30 monolayers (∼10 nm) from the surface. Six different areas on both sides were sputtered to treat the whole electrode (25 mm × 12.5 mm). On a microscopic scale, Sample C shows a roughened surface topography, due to pit formation after Ar+ bombardment and island growth by metal atoms redeposition, as observed before in the STM studies17 (Fig. 1c).
There is some controversy in the literature as to whether the active phase for CO2 electroreduction is metallic Cu2–4,18–22 or Cu2O.8,23 Consequently, the three samples were characterized using X-ray Photoelectron Spectroscopy (XPS). The XPS spectrum of the sputtered copper surface (Sample C), as prepared, represents that of a clean metallic surface. The other two samples contain some surface oxygen due to the transfer under ambient conditions. However, there is no chemical shift observed due to copper (II) oxide. All three surfaces exhibit the following signals for copper: Cu 2p3/2 at 932.4 eV and Cu 2p1/2 at 952.2 eV, that correspond to metallic copper or copper (I), see Fig. S2a (ESI†).
To differentiate between metallic Cu and Cu2O, the Cu Auger spectrum was measured.24 Fig. S2b (ESI†) shows the copper Auger lines for the three surfaces, as prepared. The sputtered sample naturally only shows the fingerprint of metallic copper since no oxygen was present here at all. The electropolished sample also appears to be metallic, i.e., the small amount of oxygen adsorbed during the transfer is not significantly influencing the Auger signal. This could be explained by the preparation procedure, which involves applying a positive potential in a phosphoric acid solution (pH 1.5) where, according to the copper Pourbaix diagram, the stable species should be Cu2+ and no oxide species are expected.15 The nanoparticle covered surface (Sample B) shows an Auger peak that corresponds to Cu2O. This sample was prepared in 0.1 M KClO4 solution within the pH range where Cu2O can be formed. It was unclear whether the nanoparticles were oxidized when they formed, during the redeposition step, or simply by the exposure to the electrolyte. With the aim of clarifying this issue, we studied the Auger signals on the sputtered sample in following cases: under UHV conditions, air exposed (30 min) and after being dipped into the electrolyte. Based upon Fig. S2c (ESI†), exposure to the air leads to a slightly oxidized surface, while dipping the sample into the electrolyte forms a fully oxidized surface, as observed on the nanoparticle covered sample. Therefore, the XPS measurements are insufficient to identify the active phase of copper for electrocatalytic CO2 reduction. Only in situ measurements would be able to identify the real surface state during the electrocatalytic process.
Even though we do not have any measurements of the oxidation state of copper during the catalytic reaction, we take the view that it is highly unlikely that the active phase is a form of copper oxide, rather than metallic Cu. There is a significant driving force for the reduction of copper oxide under reaction conditions, i.e. ∼−1.5 V overpotential relative to the Nernst potential of the reduction of Cu2O to metallic Cu at pH ∼6 and −1.1 V vs. RHE.15 Notably, in situ STM studies have shown that at the most ∼−1 V overpotential is required to completely reduce Cu oxide to form ordered Cu(111) terraces in 0.1 M NaOH.25 Moreover, Le et al.26 found that their Cu oxide catalyst reduced to metallic Cu at an overpotential of −1.3 V, relative to the Cu/Cu2O reversible potential in CO2 saturated 0.5 M KHCO3.
As electrochemical characterization of the surfaces, cyclic voltammetries in N2 saturated and CO2 saturated atmospheres were performed on the three samples. A non-buffered solution KClO4 (0.1 M) was used as electrolyte, with the pH value monitored throughout all the steps of the electrochemical process. The as-made electrolyte has pH of 7 ± 0.5. Pre-electrolysis was performed in order to remove possible traces of impurities, which shifts the pH to values of ca. 8. Cycling to very negative potentials also increases pH. CVs in N2 were recorded at alkaline pH 11 ± 0.5. However, CO2 bubbling lowers the pH down to 6 ± 0.5. In Fig. 2(b and c), the cyclic voltammograms (CV) in saturated 0.1 M KClO4 under CO2 and N2, respectively, are shown against the reversible hydrogen electrode (RHE), with the potential scales corrected for pH and confirmed through the alignment of the Cu(I)-oxide formation peak. As expected according to the copper Pourbaix diagram,15 these peaks appear at the same potential against RHE when CVs are performed in the same potential range. Plotting the CVs against RHE enabled the comparison of the onset potentials for the reduction process, such as the hydrogen evolution reaction (HER) in the N2 saturated environment and the two simultaneous processes HER and CO2 reduction in the CO2 saturated environment. Firstly in the N2 saturated environment, the formation of the cuprous oxide is observed at potentials of ca. 0.65 V vs. RHE, followed by its reduction during cathodic scan at ∼0.3 V vs. RHE, which is consistent with the thermodynamical potential of Cu to Cu2O at 0.47 V vs. RHE.15 The electropolished polycrystalline copper surface (Sample A) exhibits an exponential increase of cathodic current at −0.45 V, indicative of hydrogen evolution. The nanoparticle covered surface (Sample B) and the sputtered surface (Sample C) have the onset potential for hydrogen evolution earlier than Sample A. Moreover, at the most negative potentials, the cathodic current density is greater on roughened surfaces than on the electropolished surface. This could partially be attributed to the increased surface area of the nanoparticle covered surface. However, we can consider that the electropolished sample and the argon sputtered sample have the same surface area. Therefore, the difference in onset potential and current values, between these two electrodes, can only be attributed to surface morphology. On the other hand, the difference between the current values for the electropolished electrode and the nanoparticles covered electrode is greater than the expected from the difference in surface area. For instance, at −0.6 V the current is 4.5 times higher on the nanoparticle covered surface than on the smooth one. The surface area increase contributes only with the previously estimated factor of 2–3.
In addition, higher surface area does not explain the improved onset potential of the roughened surface, which is more indicative of a better electrocatalytic activity for hydrogen evolution on the surface dominated by low coordinated surface atoms.
Cyclic voltammetry in CO2 (pH 6.0 ± 0.5) shows similar trends as in nitrogen where the higher current densities were observed on roughened surfaces (Samples B and C). For instance, at −0.75 V vs. RHE, the current density of the nanoparticle covered surface (Sample B) is 10 times higher compared to the electropolished surface (Sample A), which again is a proof that the surface morphology contributes more to the current densities than just the effect of surface area increase.
The onset potentials, when the current density exceeds 1 mA cm−2, appear at −1.0 V for the electropolished surface, at −0.8 V for the sputtered surface and around −0.6 V for the nanoparticle covered surface, which are more negative than that observed in N2. The more negative onset potentials indicate the presence of adsorbed species during CO2 reduction. According to Hori2, the CO2 reduction reaction proceeds with the formation of adsorbed CO as an intermediate product. The Faradaic current is being contributed from two competing reactions:
| *CO2 + 2H+ + 2e− → *CO + H2O (The “*” indicates that it adsorbs to the surface) |
| 2*H+ + 2e− → H2 |
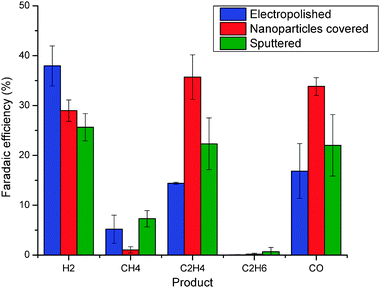 | ||
| Fig. 3 Faradaic efficiency for the products of electroreduction of CO2 on three surfaces in CO2-saturated 0.1 M KClO4 upon −1.1 V vs. RHE, including Sample A (electropolished surface), Sample B (copper nanoparticle-covered surface) and Sample C (sputtered surface). | ||
Better catalytic performance of the roughened surface is obtained due to two different effects: achieved higher current densities and improved faradaic selectivity to hydrocarbons. Increase in current densities is easily explained taking into account the higher surface area of the roughened sample, providing more active sites for both CO2 conversion and hydrogen evolution. Improvement in the selectivity towards hydrocarbons suggests that the morphology of the surface plays a significant role in the process. As established earlier, the smooth surface consists mostly of low index crystal facets, such as Cu(100) and Cu(111). However, the roughened surfaces contain significantly more low-coordination sites, such as steps, edges and defects that seem to be more active towards CO2 reduction.
Our observations on different surfaces are in agreement with Hori's investigations2 of CO2 electroreduction on single crystal Cu surfaces in 0.1 M KHCO3 aqueous solution. These investigations include terrace facets, Cu(111) and Cu(100), that can be compared with the smooth surface of Sample A in our case. Stepped surfaces like Cu(311), Cu(511) and Cu (711) can be related to roughened surfaces on Samples B and C.19–20,22 Hori et al. observed that the stepped copper surfaces exhibit different selectivities and that the reactions occur at lower potentials for a specific current density compared to the terrace facets. They also concluded that the selectivity ratio between CH4 and C2H4 depends strongly on the crystal orientation.19–20,22 They reported that Cu(111) produced CH4 with a faradaic efficiency of 50.5% and C2H4 with an efficiency of 8.8%. On the other hand, the stepped surface, Cu(711), was more selective towards C2H4, with a Faradaic efficiency of 3.8% towards CH4 and 51.6% towards C2H4. Given that CO2 reduction is strongly influenced by the electrolyte, working potentials, and pH,4 it is difficult to make a direct, quantitative comparison of Hori et al.'s results to our own. Nevertheless, our observations, whereby the selectivity towards C2H4 or CH4 depends on the surface morphology, seem to be consistent with those of Hori et al. A recent paper by Koper and co-workers27 sheds light on the correlation between the formation of CO and ethylene. They propose two different pathways: one for methane and another one for ethylene formation. Our results indicate that on different surfaces CO and ethylene formation follow the same trends. Higher CO production seems to favor the formation of ethylene, as previously suggested.21,27 It is also worth mentioning that the highest selectivity for ethylene on nanoparticle covered surface seems to be a reason for suppressed methane production. However, based on our results, we are not able to make strong conclusions on intermediates required neither for methane nor for ethylene formation.
In order to understand the apparent effect of surface pretreatment on the catalytic performance of Cu towards CO2 electroreduction, density functional theory (DFT) calculations were performed on the fcc(111), fcc(100) and fcc(211) facets of Cu. As discussed earlier, the roughened surfaces would contain a larger number of defects such as steps, the effect of which can be modeled by the (211) facet. On the other hand, the electropolished surface should be dominated by the terrace facets, such as (111) and (100).
Free energetics of the hydrogen evolution reaction was calculated with DFT and is shown in Fig. S4 (ESI†); the stepped sites (211) are predicted to have higher activity than the terrace (111) and (100) sites since the free energy of the adsorbed hydrogen intermediate (H*) is closer in free energy to the initial and final states of the reaction. This may translate into a higher activity for hydrogen evolution on these stepped sites. However, this may have less of an effect on the onset potential than the free energy diagram would suggest: the steps on the Cu surface are inaccessible to adsorbed H at low bias (less negative potentials), since they can be blocked by hydroxyl (OH) groups. This is shown in Fig. S5 (ESI†), in which DFT calculations show that OH adsorption from water proceeds spontaneously at 0 V vs. RHE on the (211) and (100) copper surfaces causing the surface blocking.
Density functional theory calculations were also employed to have a better understanding on the improved hydrocarbon selectivity of the roughened surfaces. The conversion of electronic energies to free energies, the effect of solvation, and the effect of electric fields were handled in a manner identical to that in a previous study that examined CO2 reduction at copper electrodes.21,28 In the previous study, the elementary proton–electron transfer steps have been proposed for the process of reducing CO2 to hydrocarbons. The potential requirements in CO2 reduction to methane on Cu fcc(211) surfaces have been proposed, where the protonation of adsorbed CO to produce adsorbed CHO is identified as the limiting step.21 While many factors control the reactivity of the different facets of copper during the CO2 electrochemical reduction and a complete understanding will require a more detailed model, we based on this previous study to determine the effect of surface roughness on the energetics of this transformation. Therefore we calculated the free energies of the transformation of CO* to both CHO* and COH* (where an asterisk, *, indicates an adsorbed species) on three different copper crystal facets, which were taken to be indicative of the range of smooth and roughened surfaces encountered in polycrystalline copper.
These three facets are the (111) surface, which is a smooth facet containing the highest surface density of metal atoms and 3-fold binding sites, the (100) surface, which is a smooth facet containing a lower surface density of metal atoms and 4-fold binding sites, and the (211) surface, which contains a step. Fig. 4 compares the energetics of CO* protonation on the (111), (100), and (211) surfaces at 0 V vs. RHE. It can be seen that on all surfaces, the route to CHO* is favored over the route to COH*, and the (211) surface stabilizes this transformation relative to the (111) and (100) surfaces. This may partially explain the higher current and higher selectivity to hydrocarbons experimentally observed on the roughened surfaces. It has been suggested that the ethylene is formed from a non-electrochemical surface reaction between adsorbed species, for example the coupling of CHO* to *OCHCHO*.21 The high selectivity of C2H4 and low selectivity of CH4 on Sample B are possibly due to high coverage of CHO* or other adsorbed species along step edges. Therefore the formation rate of C2H4 is influenced by the surface crystal orientation.
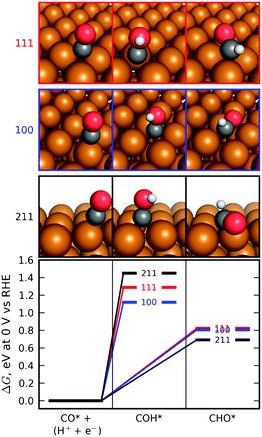 | ||
| Fig. 4 Calculated free energies, at 0 V vs. reversible hydrogen electrode (RHE), of the protonation of adsorbed CO to form adsorbed COH or CHO on the (111), (100), and (211) facets of the face-centered cubic copper crystal. The protonation proceeds most favorably on the (211) facet to the CHO adsorbate. See also Durand et al.28 | ||
Among the three copper surfaces with different pretreatments and thus morphologies, the roughened copper surfaces (the copper nanoparticle covered surface and the sputtered surface) show higher selectivities towards hydrocarbons. In particular, our in situ activation method to prepare the copper nanoparticle surface is simple and effective. The morphology effect is explained by the greater abundance of undercoordinated sites on the roughened surfaces. DFT calculations indicate that these sites are more likely to be the active sites for CO2 reduction. On the basis of our results, we propose that the activity of Cu could be enhanced further by preparing smaller nanoparticles of Cu, as these would have a greater density of undercoordinated sites.
Acknowledgements
This work was supported by the “Catalysis for Sustainable Energy” (CASE) research initiative, which is funded by the Danish Ministry of Science, Technology and Innovation. Center for Individual Nanoparticle Functionality is funded by The Danish National Research Foundation. The Center for Atomic-scale Materials Design is funded by the Lundbeck Foundation. This material is based in part upon work supported by the Air Force Office of Scientific Research through the MURI program under AFOSR Award No. FA9550-10-1-0572. The HPLC analysis of the liquid face was carried out at Haldor Topsøe by Christian Mårup Osmusdsen. The authors sincerely thank Dr Ifan Stephens and Dr Francisco Pérez Alonso for discussion and suggestion.References
- F. Schuth, Eur. Phys. J. Spec. Top., 2009, 176, 155–166 CrossRef.
- Y. Hori, in Modern Aspects of Electrochemistry, ed. C. G. Vayenas, Springer, 2008, pp. 89–189 Search PubMed.
- M. Gattrell, N. Gupta and A. Co, J. Electroanal. Chem., 2006, 594, 1–19 CrossRef CAS.
- Y. Hori, A. Murata and R. Takahashi, J. Chem. Soc., Faraday Trans. 1, 1989, 85, 2309–2326 RSC.
- Y. Gorlin and T. F. Jaramillo, J. Am. Chem. Soc., 2010, 132, 13612–13614 CrossRef CAS.
- S. Trasatti, Electrochim. Acta, 1984, 29, 1503–1512 CrossRef CAS.
- M. R. Goncalves, A. Gomes, J. Condeco, R. Fernandes, T. Pardal, C. A. C. Sequeira and J. B. Branco, Energy Convers. Manage., 2010, 51, 30–32 CrossRef CAS.
- Y. Terunuma, A. Saitoh and Y. Momose, J. Electroanal. Chem., 1997, 434, 69–75 CrossRef CAS.
- S. Huemann, N. T. M. Hai, P. Broekmann, K. Wandelt, H. Zajonz, H. Dosch and F. Renner, J. Phys. Chem. B, 2006, 110, 24955–24963 CrossRef CAS.
- J. K. Zhang, G. N. Okeke and C. H. B. Mee, J. Phys. E: Sci. Instrum., 1986, 19, 314–314 CrossRef CAS.
- T. N. Andryushchenko, A. E. Miller and P. B. Fischer, Electrochem. Solid-State Lett., 2006, 9, C181–C184 CrossRef CAS.
- S. Horch, H. T. Lorensen, S. Helveg, E. Laegsgaard, I. Stensgaard, K. W. Jacobsen, J. K. Norskov and F. Besenbacher, Nature, 1999, 398, 134–136 CrossRef CAS.
- O. M. Magnussen, Chem. Rev., 2002, 102, 679–725 CrossRef CAS.
- H. I. Rasool, E. B. Song, M. J. Allen, J. K. Wassei, R. B. Kaner, K. L. Wang, B. H. Weiller and J. K. Gimzewski, Nano Lett., 2011, 11, 251–256 CrossRef CAS.
- E. Protopopoff and P. Marcus, Electrochim. Acta, 2005, 51, 408–417 CrossRef CAS.
- N. T. M. Hai, K. Wandelt and P. Broekmann, J. Phys. Chem. C, 2008, 112, 10176–10186 CAS.
- T. Michely and G. Comsa, Surf. Sci., 1991, 256, 217–226 CrossRef CAS.
- Y. Hori, H. Konishi, T. Futamura, A. Murata, O. Koga, H. Sakurai and K. Oguma, Electrochim. Acta, 2005, 50, 5354–5369 CrossRef CAS.
- Y. Hori, I. Takahashi, O. Koga and N. Hoshi, J. Phys. Chem. B, 2002, 106, 15–17 CrossRef CAS.
- Y. Hori, I. Takahashi, O. Koga and N. Hoshi, J. Mol. Catal. A: Chem., 2003, 199, 39–47 CrossRef CAS.
- A. A. Peterson, F. Abild-Pedersen, F. Studt, J. Rossmeisl and J. K. Norskov, Energy Environ. Sci., 2010, 3, 1311–1315 CAS.
- I. Takahashi, O. Koga, N. Hoshi and Y. Hori, J. Electroanal. Chem., 2002, 533, 135–143 CrossRef CAS.
- P. Dubé and G. M. Brisard, J. Electroanal. Chem., 2005, 582, 230–240 CrossRef.
- F. Matjaz, P. Sebastijan, K. Anton, C. J. Kova and M. Ingrid, J. Electrochem. Soc., 2010, 157, C295–C301 CrossRef.
- V. Maurice, H.-H. Strehblow and P. Marcus, Surf. Sci., 2000, 458, 185–194 CrossRef CAS.
- M. Le, M. Ren, Z. Zhang, P. T. Sprunger, R. L. Kurtz and J. C. Flake, J. Electrochem. Soc., 2011, 158(5), E45–E49 CrossRef CAS.
- K. J. P. Schouten, Y. Kwon, C. J. M. van der Ham, Z. Qin and M. T. M. Koper, Chem. Sci., 2011, 2, 1902–1909 RSC.
- W. J. Durand, A. A. Peterson, F. Studt, F. Abild-Pedersen and J. K. Nørskov, Surf. Sci., 2011, 605(15–16), 1354–1359 CrossRef CAS.
Footnote |
| † Electronic supplementary information (ESI) available. See DOI: 10.1039/c1cp22700a |
| This journal is © the Owner Societies 2012 |