Ab initio and empirical defect modeling of LaMnO3±δ for solid oxide fuel cell cathodes†
Yueh-Lin
Lee
a and
Dane
Morgan
*ab
aMaterials Science Program, 1509 University Avenue, Madison, Wisconsin 53706-1595, USA
bDepartment of Materials Science and Engineering, 1509 University Avenue, Madison, Wisconsin 53706-1595, USA. E-mail: ddmorgan@wisc.edu; Fax: +1 608-262-8353; Tel: +1 608-265-5879
First published on 14th November 2011
Abstract
Sr doped LaMnO3 is a perovskite widely used for solid oxide fuel cell (SOFC) cathodes. Therefore, there is significant interest in its defect chemistry. However, due to coupling of defect reactions and inadequate constraints of the defect reaction equilibrium constants obtained from thermogravimetry analysis, large discrepancies (up to 4 eV) exist in the literature for defect energetics for Sr doped LaMnO3. In this work we demonstrate how ab initio energetics and empirical modelling can be combined to develop a defect model for LaMnO3. Defect formation enthalpies, including concentration dependence due to defect interactions, are extracted from ab initio energies calculated at various defect concentrations. Defect formation entropies for the defect reactions in LaMnO3 involving O2−(solid) ↔ ½O2(gas) + 2e− are shown to be accessible through combining the gas phase thermodynamics and simple models for the solid phase vibrational contributions. This simple treatment introduces a useful constraint on fitting defect formation entropies. The predicted defect concentrations from the model show good agreement with experimental oxygen nonstoichiometry vs.P(O2) for a wide range of temperatures (T = 873–1473 K), suggesting the effectiveness of the ab initio defect energetics in describing the defect chemistry of LaMnO3. Further incorporating a temperature dependent charge disproportionation energy within 0.0–0.2 eV, the model is capable of describing both defect chemistry and oxygen tracer diffusivity of LaMnO3. The model suggests an important role for defect interactions which are typically excluded from LaMnO3 defect models, and sensitivity of the oxygen defect concentration to the charge disproportionation energy in the high P(O2) region. Similar approaches to those used here can be used to model the defect chemistry for other complex oxides.
A. Introduction
Sr-doped LaMnO3 (LSM) is presently used as a cathode materials in commercial zirconia electrolyte based solid oxide fuel cells (SOFC) due to its good electrical conductivity, good stability, reasonable catalytic activity for oxygen reduction reaction (ORR), and relatively low cost1,2 Defects in perovskites have been shown to play a crucial role in ORR. For example, Ba1−xSrxCo1−yFeyO3, one of the most active perovskites for ORR, has oxygen vacancy concentrations of near 23% under SOFC conditions.3 More broadly, many aspects of oxygen kinetics and catalysis on LSM are intimately related to its defect chemistry. Oxygen transport is governed by the oxygen tracer diffusion coefficient (D*), which is approximately proportional to oxygen vacancy content. In addition, the log of the surface exchange coefficient, k*, which governs how quickly oxygen can enter the material, is typically proportional to log of D* with a slope of approximately 0.5 (i.e., k* is proportional to the square root of D*) in mixed electronic-ionic conducting (MEIC) perovskites,4–6 including LSM. The correlations between k* and D* implies oxygen vacancies play an important role in determining the magnitude of k*. Finally, the ORR activity is strongly dependent on k* and D* values,7 and hence also critically affected by oxygen vacancy content. These observations indicate the importance of understanding defect chemistry of perovskite as SOFC cathode catalysts.Experimental efforts to directly obtain defect concentrations face some significant challenges. In particular, due to low oxygen vacancy content in LSM under typical SOFC conditions, direct measurement of bulk point defect concentration remains very difficult. Thermogravimetry (TG) analysis can be used to determine overall oxygen non-stoichiometry (δ in (La,Sr)MnO3±δ), although such analysis does not independently identify the extent of cation vs.oxygen vacancies. To obtain detailed relationships of defect concentration vs.P(O2) and temperature, defect models8–16 are generally used, with experimental data such as oxygen nonstoichiometry as constraints. Such defect models can be used to solve for the concentrations of defect species in LSMvs.P(O2) and temperature.
However, due to uncertainties in the TG determined equilibrium constants (up to 1–2 order magnitude, as shown in ref. 11) as well as the associated uncertainties in defect reaction enthalpies determined from the equilibrium constants (up to eV scale), significant discrepancies exist in the defect energetics among the previously developed LSM/LaMnO3±δ (LMO) defect models. Defect reaction enthalpies can vary by 2–4 eV between different models, as summarized in Table 2 below. The lack of robust constraints from the TG data in the LSM/LMO defect models leads to multiple reaction energies that all show good agreement with the experiments, but leave significant uncertainty about the true values of these key defect energetics.
Non-ideal behavior is a possible source of significant uncertainty is LSM/LMO defect model parameters. Since defect interactions (non-ideality) are found to be substantial in LMO/LSM,13,15 the constant defect reaction enthalpies and entropies derived from Van’t Hoff plots (equilibrium constants vs. 1/T plots), which neglect non-ideality of defects, will lead to significant errors at lower temperatures. The assumption of ideality may be the source of the disagreement generally found in the LMO/LSM random defect (ideal solution) models when utilizing defect reaction enthalpies and entropies obtained at high temperature to fit with the low temperature TG data, especially for the oxygen excess region. To include non-ideality in LMO and LSM defect chemistry, Mizusaki et al.13 proposed a modified defect model based on the observation of maximum oxygen overstoichiometry of LMO/LSM at high P(O2) and applied an additional constraint to account for the saturation of cation defects, as explained based on the concept of vacancy excluding space around cation vacancies and Sr dopants.13 A consequence of this simplified interaction model is that the Mizusaki model predicts an abrupt flattening of O overstoichiometry for LMO/LSM at low temperatures as the cation vacancy concentration reaches the saturation limit, which implies a step function for the cation defect interaction from 0 to ∞ when the cation defects become saturated. Recently, Mebaneet al.15 modified the random defect model with a defect concentration dependent strain parameter (to account for the excess free energy from the strain field interactions between cation defects) and fit with experimental O nonstoichiometry of oxygen excess La0.9Sr0.1MnO3±δ and La0.8Sr0.2MnO3±δ over a wide range of temperatures (T = 873 K–1273 K). Despite the physical motivation and extensive fitting in Mebaneet al.'s strain defect model, it is not clear how well constrained the parameters are or if other interactions could play a role.
In this work, we seek for guidance from first principles calculations to resolve uncertainty in the defect energetics of the LMO/LSM defect models. An ab initio and empirical defect model is developed by explicitly calculating the vibrational entropies of the defect reactions as well as incorporating the calculated ab initio defect energetics, to serve as new constraints for the defect model. Ideally an ab initio defect model would use ab initio methods to calculate energies and entropies for all possible defect reactions to establish the defect model. However, the considerable number of defect species along with all possible coupling/interactions between the defects in multicomponent oxide systems such as perovskites generally produce enormous amount complexity. In the case of LMO/LSM, the number of the defect species (vacancies, antisite defects, and different valence states of Mn) is more than 10 and the number of the defect coupling terms is around 100, hence including all possible defect reactions and interactions in the defect model is not practical. Furthermore, validation of such a complex model would be very difficult if not impossible with present experimental data. Therefore, in this study we firstly justify the assumptions made in most of the previous defect models8–16 by calculating reaction energies of possible defect reactions and identifying the important defect reactions that should be included in the LMO defect model. Once the key reactions and interactions have been identified, ab initio methods have been utilized to propose new values for the key reaction energies. We hope that the success of the present model will motivate further work to expand the number of reactions and defect interactions in complex oxides treated with fully ab initio based approaches.
Focusing on LMO as an example system, this work serves as a first step to demonstrate that a simple defect model and calculated ab initio defect energetics can predict defect concentrations which agree well with the experimental LMO nonstoichiometry over a wide range of temperature (873–1473 K). Overall, the model developed in this work allows one to directly utilizing ab initio defect energetics to improve understanding of defect chemistry of electron-rich perovskites as SOFC cathode materials. The derivation of the defect reaction vibrational entropies that involve exchange of oxygen ions with the oxygen gas phase can provide quantitative understanding of the vibrational free energy contributions at high temperatures for oxide native defect formation reactions. We readily accept that at this stage ab initio defect energies, particularly for complex oxides, come with their own significant limitations in accuracy. However, the approach demonstrated here is remarkably successful for LMO and can be applied to other systems in combination with experiments and ever improving ab initio methods for more accurate models.
This paper is organized as the following. Section B discusses which defect reactions are important and should be included in the defect model based on the calculated ab initio defect reaction energies. Section C describes the expressions of the LMO defect model with derivation of the vibrational entropy/free energy for the defect reactions. Section D discusses the ab initio modeling approach and compares the calculated LMO defect energetics with the reported defect energetics in the literature. The predicted oxygen nonstoichiometry, defect concentrations vs.P(O2) at various temperatures, and oxygen tracer diffusivity, are discussed in Section E. Finally, conclusions are summarized in Section F.
B. Justification of important defect reactions
To justify which defect reactions are important and should be included in the LMO defect model, we firstly calculate 12 defect reaction energies based on total energies of perfect and defect containing 2 × 2 × 2 (40 atom) perovskite supercells and La and Mn binary oxides (the details of ab initio calculation approach are described in Section D below). To account for the temperature and oxygen partial pressure effects, we further combined the calculated ab initio defect reaction energies with the vibrational entropy contribution (as described in Section B.2 below) and an oxygen partial pressure term, ½·kb·T·ln(P(O2)), for the defect reactions involving O2−(solid) ↔ ½·O2(gas) + 2·e−, to derive the corresponding reaction free energies without the configurational entropy contribution at T = 1000 K. For the rest of the defect reactions that do not involve oxygen exchange between the solids and the O2 gas phase, the calculated ab initio reaction energies are used directly to approximate the
  . The results of the
  vs.P(O2) at T = 1000 K for the 12 defect reactions are shown in Fig. 1. These defect reactions are given in Kröger-Vink notation and are based on small polaron model expressions. Here A and B refer to the La and Mn sublattices, respectively. It is noted the all the calculated
  do not include nonideality, but the ideal solution analysis allows identification of important defect reactions to be further used in the defect model.
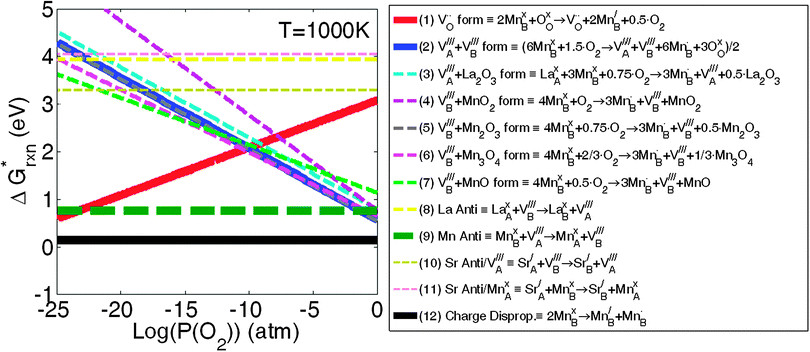 | ||
Fig. 1 The calculated 12 defect reaction free energies without configurational entropy contribution  vs.P(O2) at T = 1000 K. The three major reactions to be further included in the defect model are (the three solid lines): Reaction (1) (oxygen vacancy formation reaction), reaction (2) (cation vacancy formation reaction), and reaction (12) (charge disproportionation reaction). Reaction (2) is used to represent reactions (3)–(7). Reaction (9) is also neglected as the estimated Mn antisite defect concentration based on the vs.P(O2) at T = 1000 K. The three major reactions to be further included in the defect model are (the three solid lines): Reaction (1) (oxygen vacancy formation reaction), reaction (2) (cation vacancy formation reaction), and reaction (12) (charge disproportionation reaction). Reaction (2) is used to represent reactions (3)–(7). Reaction (9) is also neglected as the estimated Mn antisite defect concentration based on the  of reaction (9) is small (∼10−4). of reaction (9) is small (∼10−4). | ||
Based on the obtained  , the defect reactions which are important to be included in the defect model are: reaction (1) (oxygen vacancy formation), reaction (2)–(7) (cation vacancy formation), reaction (9) (Mn antisite defect formation on La sublattice), and reaction (12) (charge disproportionation). These reactions are identified as important since these
  are significantly lower than the others for at least some PO2 values. Among the various cation vacancy formation reactions (reactions (2)–(7)), the B site cation vacancy formation reaction is about 0.2 eV more stable than the A-site cation vacancy formation reaction in the high P(O2) region, which is where cation vacancies can form in significant concentrations. This 0.2 eV energy difference corresponds to about a factor of 10 difference in concentrations at T = 1000 K, which suggest B-site cation vacancies are energetically more favorable to form than the A site vacancies. However, in the defect model below (see Section C) we consider the use of a combined A-site and B-site cation vacancy defect formation reaction (i.e.reaction (2)) to represent the various cation vacancy formation reactions. There are a few reasons to make this approximation. First, this treatment leads to the constraint of equal concentration on the A and B sublattices, which provides a significant simplification in the modeling. Furthermore, the small differences in the cation vacancy formation energies which we are ignoring will not cause significant change in the predicted overall cation vacancy concentrations at high P(O2), the oxygen nonstoichiometry, or the oxygen diffusivity. Finally, it is not clear that including the different cation occupancies with our present ab initio numbers would actually lead to a more accurate model. The
  of reactions (2)–(7) are so close that it is difficult to be sure the distinction is meaningful as the uncertainties in the energies used in this work are at least ∼0.1 eV. In addition, the experiments are neither consistent with the modeling results nor with each other. The A-site vs. B-site vacancy concentration ratio measured by neutron diffraction reported in ref. 17 is about 1.8, which suggests the defect energetic difference between the A-site and B-site cation vacancy formation is about 0.05 eV at 1000 K. However, other studies have found equal A-site and B-site vacancy,18 and up to 10% A-site vacancy vs. filled B-site.19 This spread in results makes it hard to validate the calculations against experiments. It is clear that additional computational and experimental work is needed to help resolving the cation vacancy formation energetic difference and we therefore use a combined A-site and B-site cation vacancy defect formation reaction.
The one other defect reaction of low enough energy to potentially play a role is the Mn antisite defect formation (reaction (8)). While this reaction has a low energy it requires a cation vacancy to be present on the A site, and therefore contributes only a small modification to that already small cation vacancy concentration. The estimated Mn antisite defect concentration based on the  of reaction (8) is about ∼10−4 at 1000 K, which is very small and can be neglected.
Overall, these ab initio calculations suggest three major defect reactions that should be included in the LMO defect model: reaction (1): oxygen vacancy formation reaction, reaction (2): cation vacancy formation reaction, and reaction (12): charge disproportionation reaction. These reactions have been used previously and the ab initio results therefore validate the previous defect model assumptions.8–16
C. Defect modeling approach
The following sections describe the details of the LMO defect modeling approach based on the calculated ab initio defect energetics:1. The three major LMO defect reactions
As discussed above in Section B, the three independent defect formation reactions in the LMO defect model of this work are:(i) Oxygen vacancy formation reaction (reduction reaction):
 | (1) |
 | (2) |
 | (3) |
2. Expression of equilibrium constants for the assumed LMO defect reactions
For an oxide defect reaction at equilibrium, the reaction equilibrium constant can be written as: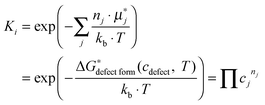 | (4) |
 is a chemical potential without the ideal configurational entropy of a defect j, kb is the Boltzmann constant, T is temperature, and cj is concentration of a defect j.
 is defined as free energy of a defect reaction without configurational entropy at P(O2) = 1 bar and is a function of defect concentration (due to defect interactions) and temperature (due primarily to vibrational free energy contributions). Note that while the enthalpy term in
  will be allowed to have non-ideal terms, the entropy will be assumed to be the ideal entropy. This approximation has been widely used in CALPHAD approaches and yielded excellent accuracy for many systems.20,21
3. Derivation of vibrational free energy/entropy for the LMO defect reactions
To derive an expression for of the LMO defect reactions (eqn (1)–(3)), we split
  into two parts: the defect reaction energy as a function of defect concentration, Δεdefect form(cdefect), and the vibrational free energy contribution of the defect reactions, ΔGvibdefect form(T). As we are aiming to have defect energetic accuracy at ∼0.1 eV scale at ∼1000 K, the vibrational degrees of freedom are approximated to be the only non-configurational degrees of freedom of the defect reactions (other non-configurational degrees of freedom contributions, e.g., magnetic, are neglected under the assumption that their contributions tothe free energy are either small or cancel in the reactions). For a defect reaction involving O2−(solid) ↔ ½·O2(gas) + 2·e−, we assume the vibrational free energy of the solid phase atoms not involved in the reaction do not change significantly during the reaction. Consequently, the main contribution of vibrational free energy for the defect reactions will be from the vibrational free energy difference between the O2 gas and the exchanged O2− ions of the solid. With this assumption one can calculate ΔGvibdefect form(T) by incorporating the empirical thermodynamic free energy/entropy data22 for the O2 gas phase and a simple Einstein model for the exchanged O2− ions in the LMO solid phase:23–26
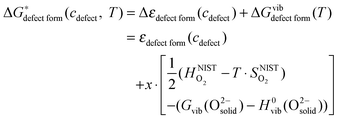 | (5) |
 and
and  are the enthalpy and entropy, respectively, of the O2 gas phase at P(O2) = 1 bar (per O2) (taken from the NIST thermodynamic database22), and
  is the empirical free energy of the oxygen gas phase at P(O2) = 1 bar. Gvib(O2−solid) is the vibrational free energy for an oxygen ion in LMO and H0vib(O2−solid) is the vibrational enthalpy of an oxygen ion in LMO at T = 298.15 K. The subtraction of H0vib(O2−solid) from Gvib(O2−solid)is to set H0vib(O2−solid) at 298.15 K as the reference (
 is also referenced to
  ). Following ref. 25, Gvib(O2−solid) and H0vib(O2−solid) can be calculated by using a simple Einstein model with the Einstein temperature (θE) equal to 500 K for oxygen ions in the solid phase LMO. The value θE = 500 K was determined by diagonalizing the local force constant matrix for O (all other atoms fixed) in LMO from ab initio calculations. This value is consistent with experimental Raman frequencies, which range from 140–660 cm−1 (which corresponds to θE = 202 K–880 K).28 The second term of the right hand side eqn (5) allows one to calculate the vibrational free energies of LMO defect reactions involving exchange of oxygen between LMO solid and O2 gas by using the expressions shown in Table 1 for each term in the bracket of the eqn (5).
To demonstrate the accuracy of this simple model, the model entropy terms and experimental fits to entropies of reactions have been compared. Note that we do not discuss the predicted enthalpy terms. Within a harmonic model these will be set by the equipartition theorem29 to approximately 3kbT at the temperatures of interest. If we assume that anharmonic effects make a relatively small contribution then the proposed Einstein model will capture the enthalpy contributions accurately. In Fig. 2, we show our calculated vibrational entropies between T = 800–1300 K for O2 gas ( , the dotted a line), oxygen ions in the solids (
 , the dashed lines), and any defect reaction involving exchange of oxygens between O2 gas and solid (Δs, the solid lines). It is seen in Fig. 2 that the dominant vibrational entropy term is from the O2 gas phase, while the vibrational entropy for an O2− in LMO is about 30% of the O2 gas entropy. Nonetheless, at SOFC temperatures (∼1000 K), the vibrational entropy for oxygen ions in LMO will lead to ∼0.4 eV/O contribution, which will cause significant error in the calculation if not included. Overall, the calculated defect reaction entropy is about 80 J/(mol K) per O2−(solid) ↔ ½·O2(gas) + 2·e− between T = 800–1300 K (positive for the forward reaction and negative for the backward reaction), which is in good agreement with the reported reaction entropies of LMO defect reactions (78 J/(mol K) per O in ref. 8 and 88.7 to 96 J/(mol K) per O in ref. 10). Fig. 2 also shows that a variation of 100 K in the estimated θE for O2−solid only causes a few J/(mol K) shift in the defect reaction entropy, corresponding to a change of reaction free energy in the range of 0.01–0.1 eV at T = 1000 K. This result suggests an error in the adopted Einstein characteristic temperature will not lead to significant change in defect reaction free energies and justifies the use of such a simple model for the solid phase oxygen vibrational thermodynamics.
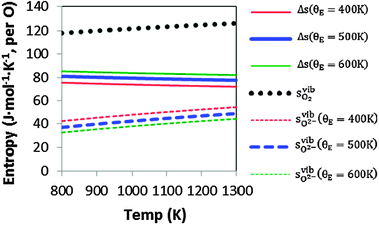 | ||
Fig. 2 Calculated vibrational entropy terms for the O2 gas phase ( ; the dotted a line), oxygen ions in the solids ( ; the dotted a line), oxygen ions in the solids ( ; the dashed lines), and any defect reactions involving exchange of oxygens between O2 gas and solid (Δs, the solid lines) based on the expressions shown in Table 1. The thick solid and dashed lines are for the results with θE = 500 K and the thin solid and dashed lines are for the results of θE = 400 K (in red) and 600 K (in green). ; the dashed lines), and any defect reactions involving exchange of oxygens between O2 gas and solid (Δs, the solid lines) based on the expressions shown in Table 1. The thick solid and dashed lines are for the results with θE = 500 K and the thin solid and dashed lines are for the results of θE = 400 K (in red) and 600 K (in green). | ||
As the charge disproportional reaction does not involve exchange of species from the solid to gas phase, the magnitude of the reaction vibrational free energy and entropy is expected to be much smaller than the other two defect reactions discussed above. Therefore the vibrational entropy change during the charge disproportionation reaction is assumed to be zero for LMO and only the configurational entropy and the reaction energy are included.
It is also worth pointing out that the reaction vibrational entropy of the Schottky defect reaction will be equal to zero following the above approach, since the overall reaction does not involve exchange of oxygens between the solid LMO and the O2 gas phase.
4. Expressions of LaMnO3 defect energetics
With the explicit treatment for the vibrational free energy and entropy of the LMO defect reactions described in Section C.3, the only unknowns left in the LMO defect model are defect reaction energies (Δεdefect form(cdefect) in eqn (5)). To include non-ideality of LMO defect reactions with respect to a range of defect concentration (oxygen and cation vacancies), the defect reaction energetics can be expressed as polynomials in defect concentration. Here, we include defect interactions between cation vacancies and interactions between oxygen vacancies but no interaction between the cation and oxygen vacancies. Although oxygen and cation vacancies may have interactions they are not present together in significant quantities at any P(O2) or temperature in LMO (see Fig. 7) and their interactions can therefore be ignored.In the following, we perform a series of first-principles calculations to obtain the LMO defect energetics. We use first order polynomials of defect concentration to represent the defect reaction energetics for the oxygen and cation vacancy formation reactions. A constant charge disproportionation reaction energy is also derived from the ab initio modeling. These energies will be discussed in Section D below.
D. Ab initio defect energetics
1. Ab initio modeling approach
Calculations were preformed with the Vienna Ab initio Simulation Package (VASP)30,31 using Density Functional Theory (DFT) and the Projector-Augmented plane-Wave (PAW) method.32,33 Exchange–correlation was treated in the Perdew-Wang-91 (PW-91)34 Generalized Gradient Approximation (GGA) with electronic configurations of La (5s2 5p6 6s2 5d1), Mnpv (3p6 3d6 4s1), and Os (soft oxygen pseudopotential, 2s2 2p4). The energy cutoff was set to 450 eV and the brillouin zone was sampled by a Monkhorst–Pack k-point mesh of 8 × 8× 8 for a primitive ideal perovskite unit cell. Energy convergence with respect to k-points was better than 3 meV per perovskite formula unit. Bulk calculations are simulated with 40-atom (2ac × 2ac × 2ac; ac is the lattice constant of an ideal cubic LaMnO3 perovskite), 80-atom (2ac × 2ac × 4ac and ), 160-atom (2ac × 4ac × 4ac and
  ), and 320-atom (4ac × 4ac × 4ac) supercells with ions relaxed internally to restore BO6 octahedron distortion. The above supercells implicitly neglect the Jahn–Teller distortions.25 However, these are negligible at the high working temperature appropriate to SOFC (T = 800–1300 K) as the Jahn–Teller transition temperature, TJT, is about 750 K. The LMO will therefore exhibit bulk structures with an averaged cubic symmetry under SOFC conditions. For the simulated magnetic structure, we use the ferromagnetic (FM) state to approximate the conductive characteristics of LMO at SOFC operating temperatures (above TJT).
To treat the electron correlation errors in LMO using DFT with GGA, we adopt the GGA + U method,35,36 where Ueff (=Coulomb U − exchange J) is applied to the Mn d orbitals, to improve accuracy of redox reaction energetics in our calculations.25,37 Since it has been shown the redoxUeff for Mn binary oxides are slightly different for different Mn oxidation states,37 we adopt Ueff = 4 eV for calculating energies of the oxygen vacancy containing LMO (reduction of Mn3+ to Mn2+) following ref. 25 and 37, and Ueff = 3.5 eV for calculating the cation vacancy containing LMO (oxidation of Mn3+ to Mn4+). The latter value is chosen by fitting to the experimental oxidation enthalpy of 2Mn2O3 + O2 → 4MnO2 (1.678 ± 0.075 eV/O238) with the approach suggested in Ref. 37. The different Ueff for Mn oxidation and reduction is also applied in the charge disproportionation energy (Echg_disp) calculations, which are derived via the following equation:
| Echg_disp = [ELMO(Ueff = 3.5 eV) + ELMO(Ueff = 4 eV)] − [ELMO+h˙(Ueff = 3.5 eV) + ELMO+e′(Ueff = 4 eV)] | (6) |
As both the oxygen vacancy formation and the cation vacancy formation reactions in LMO are involved with exchange of oxygen between the solid phase and the O2 gas phase, an O2 gas energy reference is needed for calculating the defect reaction energies. In DFT ab initio modelling, the O2 energy reference can be calculated by combining the ab initio energy of an isolated O2 molecule  along with a correction term
  to bring the experimental data and the quantum-mechanical calculations into agreement.23,25,37,39 The applied O2 energy correction term
  (eV/O2) used here is 0.33 eV/O225 and was determined for the exchange correlation functional (PW-91) and oxygen pseudopotential (soft oxygen pseudopotential) used in this work. In the following section, the combined energy,
  , which is −8.76 eV/O2 as reported in ref. 25, will be used as the O2 energy reference.
2. Ab initio LMO defect reaction energies vs. defect concentrations
In this work the relationships of defect formation enthalpies vs. defect concentration are obtained from supercells with different sizes. It is assumed that for a given defect concentration the energy is only weakly dependent on defect configuration in the relevant limit of low defect concentration (approximately δ = 0–0.2 for the oxygen excess LaMnO3+δ and δ = 0–0.125 for oxygen deficient LaMnO3−δ). This assumption was checked by calculating different defect arrangements at fixed composition through use of different defect supercells. It was found that the calculated total energies of the simulated defect containing supercells (with either a separated A-site and B-site cation vacancy pair or an anion vacancy) with different supercell shape (2ac × 2ac × 4ac and for 80-atom supercells, and 2ac × 4ac × 4ac and
  for the 160-atom supercells) are fairly close in energy (within 0.1 eV per supercell). This result suggests that, provided the defects remain relatively far apart, the distances between defects are large enough to minimize the configurational dependence of the defect interactions in the calculations presented here.
It has been reported that vacancies in transition metal perovskites can cause chemical expansion40,41 and the changes in lattice parameters with defect concentration are consequently of some importance. Therefore, in Fig. 3, we show lattice constant percent strain (ε = ac(δ)/ac(δ = 0)) vs. the corresponding defect concentration for the oxygen and cation vacancy containing supercells. Volume changes from the smallest defect concentrations (320 atom cells) yield formation volumes of −15.37 Å3 and 6.66 Å3 for a single cation (averaged over A and B sites) and anion defect, respectively. It is interesting to note that the cation vacancies cause lattice contraction, opposite the trend observed for the anion vacancies.
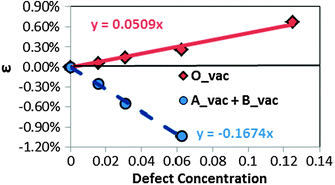 | ||
| Fig. 3 Lattice constant percent strain of the calculated supercells at various defect concentrations: red solid diamonds (the solid line) represent the lattice constants of oxygen vacancy containing supercells, while blue solid circles (the dashed line) represent the lattice constant of the cation vacancy containing (1 A-site and 1 B-site vacancies) supercells. The calculated lattice constant of the perfect bulk LMO in this work is 3.97 Å. | ||
Fig. 4 shows the calculated ab initio total energies of LMO (per Mn) referenced to that of the perfect bulk at the sampled O vacancy and cation vacancy concentrations. Note that for cation vacancies an A and B site vacancy are always created together. For simulating the cation vacancy formation reaction (eqn (2)), an A-site and B-site cation vacancy pair is modelled by putting the A-site vacancy at the corner of the supercell and B-site vacancy is placed at the farthest site from the corner. The 2 × 2 × 2 supercell data for cation vacancy formation reaction is not included in Fig. 4 because the simulated cation vacancy concentration (12.5% for both A and B site vacancy) is much higher than the maximum of experimental values (∼5%) at SOFC conditions. Furthermore, at such high cation vacancy concentration, the 2 × 2 × 2 supercell with 1 A-site and 1 B-site vacancies always has a first nearest neighbor cation vacancy pair, which could have strong short range configurational defect interaction. In such case, configurational dependency needs to be taken into account.
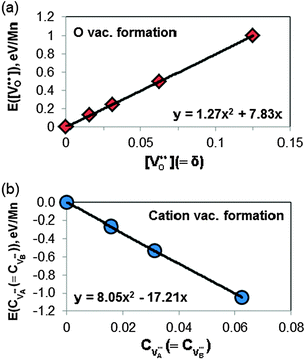 | ||
| Fig. 4 Quadratic fittings of ab initio total energies (normalized as per Mn and referenced to the perfect bulk) vs. defect concentration calculated with various supercell sizes for (a) oxygen vacancy formation reaction (i.e.eqn (1)) and (b) cation vacancy formation reaction (i.e.eqn (2)). These allow to extracting relationships between defect reaction energies as a function of defect concentration. | ||
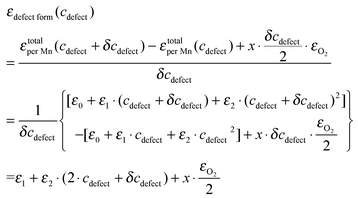
In Fig. 4, the calculated total energies of the defect containing LMO at various defect concentrations, εtotalper Mn(cdefect) (normalized as per Mn), are fitted with 2nd order (quadratic) equations of defect concentration:
| εtotalper Mn(cdefect) = ε0 + ε1·cdefect + ε2·c2defect | (7) |
 | (8) |
Rearranging eqn (8), we obtain the equation of defect reaction energy vs. defect concentration as:
 | (9) |
| Defect reactions | Defect reaction energies vs. cdefect Δεrxn(cdefect) = Erxn + Irxn·cdefect, (eV) | |
|---|---|---|
| Ab initio (this work) | Other works | |
a In the previous defect models, the oxygen vacancy formation reaction is expressed in terms of  (reduction of 2·Mn4+ to 2·Mn3+), while the Ereds summarized in Table 2 are for reduction of 2·Mn3+ to 2·Mn2+ (as expressed in eqn (1)). Therefore, here we correct the reported reaction energy of the (reduction of 2·Mn4+ to 2·Mn3+), while the Ereds summarized in Table 2 are for reduction of 2·Mn3+ to 2·Mn2+ (as expressed in eqn (1)). Therefore, here we correct the reported reaction energy of the  reaction by adding twice of the charge disproportionation reaction energy (i.e. 2·Echg_disp) in the same work to obtain the corresponding Ered. reaction by adding twice of the charge disproportionation reaction energy (i.e. 2·Echg_disp) in the same work to obtain the corresponding Ered.
|
||
| Oxygen vacancy formation, eqn (1) | E red = 3.43 (eV) | 4.51a (eV)8 |
| 3.62a (eV)10 | ||
| 2.43a (eV)11 | ||
| 4.11a (eV)16 | ||
| I red = 2.54 (eV) | — | |
| Cation vacancy formation, eqn (2) | E ox = −4.07 (eV) | −6.54 (eV)8 |
| −3.94 (eV)10 | ||
| −2.86 (eV)11 | ||
| −1.73 (eV)16 | ||
| I ox = 16.10 (eV) | — | |
| Charge disproportionation, eqn (3) | E chg_disp = 0.06 (eV) | 0.39 (eV)8 |
| −1.72 (eV)11 | ||
| 0.23 (eV)16 | ||
3. The charge disproportionation reaction energy
The LMO charge disproportionation energy calculations are performed at various disproportionated charge (hole and electron) concentrations using different supercell sizes (1 hole/electron in 2 × 2 × 2, 2 × 2 × 4, 2 × 4 × 4, and 4 × 4 × 4 supercells). Following eqn (6), the calculated charge disproportionation energies at different charge concentration are shown in Fig. 5. We extract the charge disproportionation energy of 0.06 eV by taking the linear extrapolated value at the 0 charge concentration, which corresponds to the ideal charge disproportionation reaction energy of an infinitely large LMO supercell. This value is consistent with experimental results, as discussed in Section D.4.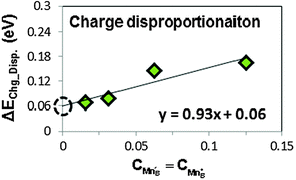 | ||
| Fig. 5 The calculated ab initio charge disproportionation reaction energies (based on eqn (9)) at different charge concentrations. The extrapolated value at charge concentration = 0 (the black empty circle) is used to represent the charge disproportionation energy in LMO. | ||
4. Ab initio LMO defect energetics vs. the reported defect energetics in literature
Table 2 lists the calculated ab initio LMO defect energetics and the reported values in the literature. The Erxn parameters correspond to the ideal defect reaction energies of the stoichiometric LMO bulk (the zeroth order defect term), and Irxn parameters (the coefficients of the first order defect concentration term) correspond to the defect interactions. The ideal oxygen vacancy formation reaction energy (Ered) and cation vacancy formation energy (Eox) are within the range of the previously reported values. The large negative Eox suggests formations of cation vacancies is thermodynamically favorable for stoichiometric LMO at the standard condition (T = 298.15 K and P(O2) = 1 bar). This suggests that at low temperatures and P(O2) = 1 bar, formation of cation vacancies (oxygen overstoichiometry) will persist until the cation vacancy concentration is high enough that the cation vacancy interactions compensate for the negative cation vacancy formation energy and lead to thermodynamic equilibrium. At high temperatures, the vibrational free energy of the O2 gas phase will also drive the cation vacancy formation energy in the positive direction (in fact, at 1 atm P(O2) the cation vacancy formation energy crosses zero and becomes positive at T = 1650 K).The Iox of the cation defect vacancy formation reaction (16.10 eV) in Table 2 is consistent with the scale of Mebaneet al.'s strain energy parameters for La0.9Sr0.1MnO3 (22.5 eV), although somewhat less than for La0.8Sr0.2MnO3 (57.9 eV).15Mebane, et al. reported no value for the LMO system. We hypothesize that the trend of increasing Iox with increasing Sr content can be understood as additional mean-field energy penalty from Sr-cation vacancy repulsion. From defect modeling perspective, the Iox parameter in this work is equivalent to the strain field interaction parameter in ref. 15, but our calculated defect interactions also contain other types of defect interactions beyond the strain (e.g. screened electrostatic interactions). A similar form of the defect energy expression (Δεrxn(cdefect) = Erxn + Irxn·cdefect)) can also be found in the rigid band based defect model for electron-rich perovskites, as discussed in ref. 42 and 43. In such case, Irxn parameters are proportional to be the inverse of the averaged density of states at the Fermi level and accounts for the increase of electron/hole chemical potential with respect to the electron/hole doping. The equations from the rigid band model can be used to estimate density of states at the Fermi level from the I values. However, using these expressions, our normalized Iox/6 and Ired/2 (normalized as per charge) lead to a inconsistent average density of states at Fermi level (0.787 eV−1 and 0.373 eV−1 per formula unit, respectively). The inconsistency with respect to hole and electron doping suggests that the rigid band type model may not be appropriate to model the LMO/LSM defect chemistry. Overall, the first order dependence of defect formation energy on defect concentration function seems to be an effective defect energy expression for the nonstoichiometric LMO under SOFC conditions as, unlike LSM, this material has no obvious oxygen overstoichiometry flattening/transition in the experimental nonstoichiometry vs.P(O2) data.
The calculated Ired parameter of the oxygen vacancy formation reaction is only 2.54 eV, which suggests quite effective screening of oxygen vacancy interactions in LMO. This is also why the random defect model (i.e., ideal solution model) generally shows good agreement on the oxygen nonstoichiometry in the oxygen deficient region, and poor fitting is most commonly seen in the oxygen excess region.11,12
The defect interactions in LSM could arise from strain15 and/or electronic effects, where the latter may include both electrostatic interactions44–46 and overall shifts in electron chemical potential.42,43 To assess the relative contributions of strain and electronic effects we repeated the total energy vs. defect concentration calculations shown in Fig. 4 using ideal (non-distorted) LMO perovskite supercells without relaxation (all atoms in the defected cells were frozen at the undefected LMO atomic coordinates). Because these cells have no relaxation there is no strain interaction between the defects and any interactions are due to electronic contributions. The results of these unrelaxed calculations are provided in Fig. S1 of the Supplemental Information.† The same analysis used on the data from Fig. 4 yields unrelaxed interaction terms (denoted with superscript UR) IURred = 2.66 eV and IURox = 18.44 eV. These values are quite close to those obtained from the fully relaxed calculations, Ired = 2.54 eV and Iox = 16.10 eV (see Table 2). The close agreement in values demonstrates that electronic effects dominate LMO defect nonideality. On the other hand, analysis of the first order defect concentration coefficients in Fig. 4 and Fig. S1 demonstrates that relaxations reduce the defect formation energies (Erxn) by 1.2 eV and 1.5 eV for anion and cation vacancies, respectively. Thus the strain effects do play an important role in the basic defect formation energies. Resolving the relative contributions of electrostatic vs. electron doping effects to the defect interactions is quite difficult due to general challenges in first-principles based supercell calculations.42–46 Furthermore, the transition in LMO from an insulating system at room temperature to a half metal-like system at SOFC temperatures suggests LMO may behave as a transitional case between a localized (electrostatic interaction) and delocalized (shift in electron chemical potential) electronic system. Resolving the physics of electrons in such system is likely beyond the resolution of the approaches used in this work. Therefore, further studies and improvements on the electronic structure calculation methods are needed to resolve and understand the factors controlling the electronic effect in defect nonideality of LMO.
Finally, we note that the reported charge disproportionation reaction energy varies from −1.74 eV to 0.39 eV (as shown in Table 2) in the previous LMO defect models, which potentially leads to discrepancies in the other two defect energetics. Stevenson et al.47 estimated the LMO charge disproportionation reaction free energy based on the measured LMO Seebeck coefficients and the oxygen nonstoichiometry and obtained 0.04 ± 0.03 eV between T = 825 K and 1273 K. The corresponding charge disproportionation enthalpy for the reaction in eqn (3) extracted from the slope of KD (the equilibrium constant for the charge disproportionation reaction reported in ref. 47) vs. 1/T at T = 825 K and 1273 K is ∼0.05 eV. The close to zero energy for the charge disproportionation reaction is consistent with the closing of the LMO optical gap above TJT reported by Tobe et al.48 Our predicted value of 0.06 eV for the charge disproportion enthalpy is quite consistent with the above experimental measurements. Our calculations, although nominally at zero temperature, make use of cubic structures appropriate to the high-temperature LMO phase. Therefore, our calculated charge disproportionation energy can be compared directly to this measured value.
In the Supplemental Information,† we show the sequential approach, adapted from Poulsen,12 for solving our LMO defect model with the defect reaction energies expressed by first order defect concentration polynomials. Table 3 summarizes the independent variables to be solved in the LaMnO3±δ defect model. The resulting stoichiometry predictions will be compared to known experimental results in the next section.
E. The predicted results from the defect model
In Fig. 6, the LMO oxygen nonstoichiometry vs.P(O2) predicted from the above defect model with the calculated ab initio defect energetics are compared with the experimental TG data between T = 873 K and 1273 K reported by Mizusaki et al.13 along with the T = 1473 K data from Kamata et al.49 These studies provide quite extensive data sets of LMO nonstoichiometry vs.P(O2) and temperatures. Overall, the results show good agreement with the experimental data, suggesting the calculated ab initio energetics and the estimated vibrational entropies of the defect reactions are capable of describing the defect chemistry of LMO. Not surprisingly, an improved fitting can be further obtained by slightly adjusting the defect energetics and defect interaction parameters. However, such a refitting may not be unique, given the many variables available in the model. In Fig. S2 of the Supplemental Information† we show a specific example of the kind of improved fit which is possible, where we have altered Ired = 2.54 eV from Table 2 to be Ired = 0.8 eV. Furthermore, a slight variation in the oxygen nonstoichiometry vs.P(O2) is also found in the LMO TG data reported by different groups8,13,16 and it is not clear that additional fitting to any particularly data set would provide more accurate parameters. In Fig. 7, we show the Brouwer diagram at T = 873, 1073, and 1273 K calculated from the defect model in this work.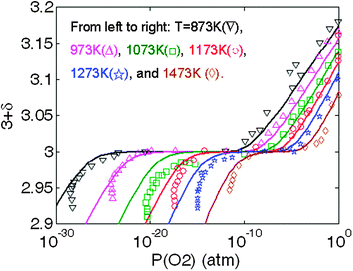 | ||
| Fig. 6 Predictions of LaMnO3 oxygen nonstoichiometry vs.P(O2) based on the defect model in this work with the calculated ab initio defect energetics (solid lines). The experimental data are taken from ref. 13 (873 K–1273 K) and ref. 49 (1473 K). | ||
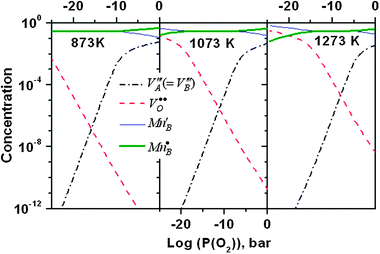 | ||
| Fig. 7 Calculated Brouwer diagram at T = 873 K, 1073 K, and 1273 K in this work. | ||
The present model helps resolve the large discrepancy (up to 4 eV differences) existing in the LMO defect energies among previous defect models. Furthermore, this work demonstrates the capability of modeling the defect chemistry of LMO with defect energetics directly from ab initio calculations, instead of fitting to experimental LMO oxygen nonstoichiometry.
Since non-ideality in the LMO defect reactions can lead to additional defect concentration dependence in the equilibrium constants, the large error bars of the TG determined equilibrium constants shown in ref. 11 are at least in part a reflection of the non-ideality of defects. In Fig. 8, we show the defect reaction equilibrium constants vs.P(O2) for the oxygen vacancy formation reaction (Kred) and the cation vacancy formation reaction (Kox) determined via eqn (S.1) and (S.2) of the Supplemental Information† and the predicted defect concentrations in the Brouwer diagram (Fig. 7). In the case of an ideal solution system, the equilibrium constants should be independent of P(O2). Such independence can be seen in the intermediate P(O2) region where cation and oxygen vacancy concentrations are very dilute and the system is close to an ideal solution. However, as the system enters into the non-dilute defect regions, deviations of the equilibrium constants become more significant (specifically, deviations appear for Kox in the high P(O2) region and Kred in the low P(O2) region). These deviations will give rise to errors in the equilibrium constants vs.P(O2) calculated using the experimental oxygen nonstoichiometry. For example, the equilibrium constant of the cation vacancy formation reaction in LMO can be expressed as:
 | (10) |
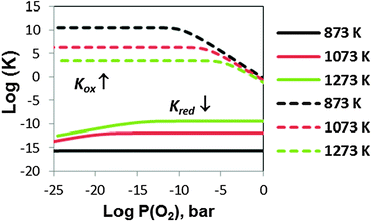 | ||
| Fig. 8 The defect equilibrium constants (dotted lines for the cation vacancy formation reaction, Kox, and solid lines for the oxygen vacancy formation reaction, Kred) vs.P(O2) for LMO at T = 873 K, 1073 K, and 1273 K obtained from the extracted defect concentrations in the Brouwer diagram. | ||
Researchers have also attempted to verify the LSM/LMO defect models by comparing the predicted electrical properties such as Seebeck coefficient and electrical conductivity with experiments11,12,50 based on specific assumed electron conduction mechanisms. However, these conductivity results seem to be less conclusive.12,15 We find disagreement in our predicted vs. experimentally measured electronic properties, primarily in the nondilute defect region, which is shown in our estimation of the Seebeck coefficient vs.P(O2) (via Heikes formula47,51) and the electronic conductivity vs.P(O2) fitting (following Poulsen12) (data not shown). Although the developed defect model in this work is capable of describing the oxygen nonstoichiometry directly from first principles calculations based on the assumed defect reactions (e.g.eqn (1)–(3)), more work is still needed to further refine the defect model and/or include new physics/energetics in order to explain the electronic properties of LMO/LSM. For example, Kamata et al.52 performed electronic conductivity and Seebeck coefficient measurements on LSM suggested that for x ≤ 0.2 both electronic conductivity and Seebeck coefficient can be described in terms of a multi-level hopping conduction model. The multi-level hopping model may suggest the need to include low spin and high spin Mn3+ species (with different chemical potentials) in the current LMO/LSM model. We note that the problem in predicting conductivity properties is a limitation shared by the simplified LMO/LSM defect model assumptions. It is therefore a limitation of our present class of defect models and is not a result of using ab initio energetics.
An additional method to verify the defect model is to use predicted oxygen vacancy concentrations in a model of oxygen tracer diffusion and compare to tracer diffusion experiments. The oxygen tracer diffusion can be modeled by the equation:53
 | (11) |
 ), ν0 is the attempt frequency (taken as 1013 s−1), ΔSm is the migration entropy (taken as 5·kb), and ΔEm is the migration energy of oxygen vacancy hopping in LMO. The value of ΔSm = 5·kb is set by fitting the value of D* at 1173 K. This value is somewhat large, but may reflect other errors propagating from the rest of the model. The experimental activation barrier of the oxygen tracer diffusion (ΔEa) in LMO is reported to be ∼2.5 eV by Berenov et al.55 in the temperature range of 973–1173 K. A value for ΔEm is obtained by calculating the oxygen vacancy hopping barrier in a 2 × 2 × 2 supercell with the GGA+U approach (U = 4 eV). We predict ΔEm is about 0.7 eV, which is consistent with the reported experimental value.56 Combining ΔEm and the predicted oxygen vacancy concentration between 973–1173 K in this work, we obtain an activation barrier of the oxygen tracer diffusion equal to 3.6 eV, which is 1.1 eV higher than the experimental value, as shown in Fig. 9. While such discrepancy seems to be large, the predicted D* using the defect energetic parameters shown in Table 2 are within half an order of magnitude as compared to the experimental D*. Furthermore, it is possible that in the oxygen excess region the cation and anion vacancies have attractive interactions that significantly alter the anion defect formation energies, reducing the effective activation energy for anion diffusion. However, it is also of value to explore if changes in the defect model might be able to explain the observed discrepancy. Therefore, we have performed the exercise of setting experimental D* data of ref. 55 as a constraint and exploring to what extent our ab initio defect energy error bars (∼0.1 eV) could lead to the 1.1 eV difference in activation barrier of D*.
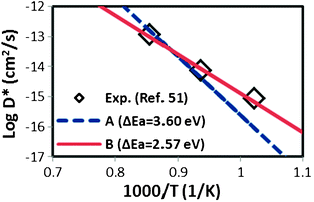 | ||
| Fig. 9 Predicted of LaMnO3 oxygen tracer diffusion coefficient (D*) between T = 973 K and 1173 K at P(O2) = 1 atm based on eqn (11) with the predicted oxygen vacancy concentration in this work and the calculated oxygen vacancy hopping barrier of 0.7 eV. Data A (dashed line) is derived from using a constant charge disproportionation energy Echg_disp = 0.06 eV while data B (solid line) is fitted to the experimental data from ref. 55 with a temperature dependent charge disproportionation energy (Echg_disp = 0.18, 0.10, and 0.02 eV at 973, 1073, and 1173 K). | ||
We observe that a temperature dependent charge disproportionation energy, where Echg_disp = 0.18, 0.10, and 0.02 eV at 973, 1073 and 1173 K, respectively, can be used to bring the model prediction of both the oxygen tracer diffusion activation barrier and the oxygen nonstoichiometry vs.P(O2) (shown in Fig. 10) in good agreement with the experimental values. While these values are clearly an empirical fit, they show a simple linear decrease with increasing temperature and are quite consistent with experimental understanding. Specifically, the decrease of the charge Echg_disp with increasing temperature is consistent with Goodenough et al.'s vibronic conduction picture of LMO above TJT, where mobile charge carriers are strongly coupled to the bond-length fluctuations, and hence the localized electrons in LMO are approaching the transition from localized to itinerant electronic behavior with increasing temperature.57 In addition, all the fitted Echg_disps between 973–1173 K are smaller than the reported experimental optical gap of 0.2 eV measured at 800 K.48 Therefore, we take as a simple semi-empirical defect model that the charge disproportionation energy is fairly constant at 0.2 eV up to 948 K, at which point it reduces linearly to 0 (itinerant behavior) at 1198 K. This model for charge disproportionation is consistent with experimental data on the gap and known oxygen diffusion data. Furthermore, using this model, the predicted oxygen nonstoichiometry vs.P(O2) between 873 K to 1473 K is still in excellent agreement with experiments, as shown in Fig. 10. We can see from these results that oxygen vacancy concentration at high P(O2) is very sensitive to the charge disproportionation energy. Such a sensitivity is perhaps beyond the capability of present ab initio models, but future improvements will hopefully remove the need for such additional fitting. Finally, we note that even using the modified Echg_disp(T), the discrepancy between the predicted electronic conductivity vs. experiments still persists, since the hole carriers are not sensitive to the small change in Echg_disp(T). Hence, the defect model still needs to be refined to include new physics/energetics in order to explain the electronic properties of LMO. Nonetheless, to our knowledge, this work presents the first LMO defect model that agrees with both the defect thermodynamic and the oxygen tracer diffusivity measurements.
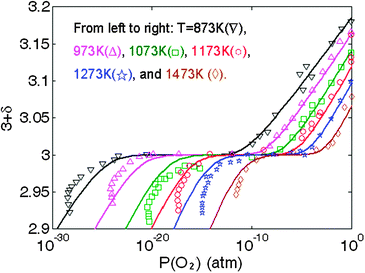 | ||
| Fig. 10 Predicted of LaMnO3 oxygen nonstoichiometry vs.P(O2) between T = 873 K and 1473 K based on the defect model in this work along with modified temperature dependent charge disproportionation energies (see text) and the calculated ab initiooxygen vacancy and cation vacancy formation defect energetics in Table 2 (solid lines). The experimental data are taken from ref. 13 and 49. | ||
F. Conclusions
An ab initio and empirical defect model for LMO under SOFC conditions has been developed. The model explicitly calculates the reaction enthalpies and entropies with ab initio methods, although empirical values for O2 gas are used and some fitting to experimental data is needed to predict the oxygen diffusivity. A useful outcome of analysing this model is the realization that the estimated vibrational entropy of the defect reactions in LMO involving O2−(solid) ↔ ½·O2(gas) + 2·e− is about ∼80 J/(mol K) at T = 800–1300 K and relatively insensitive to the specific details of the solid phase vibrational model. This provides a useful constraint on parameter values for experimental fits of defect models. The calculated ab initio defect energetics at various defect concentrations are expressed with first order functions of defect concentration to describe nonideality of defects in terms of solution thermodynamics. Defect interactions have been challenging to include in LMO defect models fit to experiment as the interaction parameters are difficult to constrain from thermodynamic data. The defect interactions are predicted to be quite significant, particularly for the cation vacancies. The influence of these interactions at least partially explains the range of defect reaction energies that have been found in fitting models that do not explicitly allow for defect interactions. The predicted oxygen nonstoichiometry vs.P(O2) from the model shows good agreement with the experimental data over a wide range of temperatures (T = 873 K–1473 K) and P(O2), suggesting that both the ab initio defect energetics and the vibrational entropies of defect reactions we have obtained are capable of describing the defect chemistry of LMO. Previous LMO/LSM models have defect energies that vary by many electron volts. This work provides a set of ab initio based defect reaction energies that can be used for accurate modeling of the LMO system, greatly reducing the uncertainty in the key defect reaction energies for this material. The predicted oxygen tracer diffusion kinetics based on the defect concentration derived from the defect model with a constant charge disproportionation energy of 0.06 eV shows 1.1 eV overestimation on the oxygen tracer diffusion activation barrier as compared to the experimental value. However, by incorporating an empirical temperature dependent charge disproportionation energy decreasing linearly from 0.2 eV to 0 eV from 948 K to 1198 K, the predicted defect concentration from the defect model is capable of describing both the experimental oxygen tracer diffusion kinetics and defect thermodynamics in LMO. Such temperature dependence for the charge disproportionation reaction is consistent with the vibronic conduction picture of LMO above TJT as proposed by Goodenough et al.,57 and the magnitude is within the reported experimental optical gap (0.2 eV) above TJT. Overall, this work depicts a framework for modeling defect thermodynamics initiated from ab initio calculations with experimental data inputs as constraints to resolve and understand defect chemistry of complex oxide systems. Similar approaches can be taken to model defect chemistry in a wide range of complex oxides.Acknowledgements
We gratefully acknowledge financial support from the National Science Foundation MRSEC program under grant number DMR-0520527 and the U.S. Department of Energy (U.S. DOE), Office of Basic Energy Sciences, Division of Materials Sciences and Engineering (under Award No. DE-SC0001284). We also gratefully acknowledge computing support from National Science Foundation (NSF) National Center for Supercomputing Applications (NCSA) under award number DMR060007 and NERSC allocation of the Center for Nanophase Materials Sciences (CNMS) at Oak Ridge National Laboratory under grant number CNMS2008-204.References
-
S. C. Singhal, High-temperature Solid Oxide Fuel Cells: Fundamentals, Design and Applications, Elsevier Science, 2004 Search PubMed
.
- S. B. Adler, Chem. Rev., 2004, 104, 4791–4843 CrossRef CAS
.
- S. McIntosh, J. F. Vente, W. G. Haije, D. H. A. Blank and H. J. M. Bouwmeester, Solid State Ionics, 2006, 177, 1737–1742 CrossRef CAS
.
- J. A. Kilner, R. A. De Souza and I. C. Fullarton, Solid State Ionics, 1996, 86–88, 703–709 CrossRef CAS
.
- R. A. De Souza and J. A. Kilner, Solid State Ionics, 1999, 126, 153–161 CrossRef CAS
.
- R. Merkle, J. Maier and H. J. M. Bouwmeester, Angew. Chem., Int. Ed., 2004, 43, 5069–5073 CrossRef CAS
.
- S. B. Adler, J. A. Lane and B. C. H. Steele, J. Electrochem. Soc., 1996, 143, 3554–3564 CrossRef CAS
.
- J. H. Kuo, H. U. Anderson and D. M. Sparlin, J. Solid State Chem., 1989, 83, 52–60 CrossRef CAS
.
- J. A. M. Vanroosmalen and E. H. P. Cordfunke, J. Solid State Chem., 1991, 93, 212–219 CrossRef CAS
.
- J. A. M. Vanroosmalen and E. H. P. Cordfunke, J. Solid State Chem., 1994, 110, 113–117 CrossRef CAS
.
- J. Nowotny and M. Rekas, J. Am. Ceram. Soc., 1998, 81, 67–80 CrossRef CAS
.
- F. W. Poulsen, Solid State Ionics, 2000, 129, 145–162 CrossRef CAS
.
- J. Mizusaki, N. Mori, H. Takai, Y. Yonemura, H. Minamiue, H. Tagawa, M. Dokiya, H. Inaba, K. Naraya, T. Sasamoto and T. Hashimoto, Solid State Ionics, 2000, 129, 163–177 CrossRef CAS
.
- K. Nakamura, J. Solid State Chem., 2003, 173, 299–308 CrossRef CAS
.
- D. S. Mebane, Y. J. Liu and M. L. Liu, Solid State Ionics, 2008, 178, 1950–1957 CrossRef CAS
.
- A. Y. Zuev and D. S. Tsvetkov, Solid State Ionics, 2010, 181, 557–563 CrossRef CAS
.
- L. Malavasi, C. Ritter, M. Cristina Mozzati, C. Tealdi, M. Saiful Islam, C. Bruno Azzoni and G. Flor, J. Solid State Chem., 2005, 178, 2042–2049 CrossRef CAS
.
- J. A. M. Vanroosmalen, E. H. P. Cordfunke, R. B. Helmholdt and H. W. Zandbergen, J. Solid State Chem., 1994, 110, 100–105 CrossRef CAS
.
- J. F. Mitchell, D. N. Argyriou, C. D. Potter, D. G. Hinks, J. D. Jorgensen and S. D. Bader, Phys. Rev. B: Condens. Matter, 1996, 54, 6172–6183 CrossRef CAS
.
-
H. L. Lukas, S. G. Fries and B. Sundman, Computational Thermodynamics: The Calphad Method, Cambridge University Press, Cambridge, UK, 2007 Search PubMed
.
-
Y. A. Chang and W. A. Oates, Materials Thermodynamics, John Wiley & Sons Inc., Hoboken, New Jersey, USA, 2009 Search PubMed
.
-
NIST, in NIST Standard Reference Database No. 69, ed. P. J. Linstrom and W. G. Mallard, National Institute of Standards and Technology, Gaithersburg, MD, 2003, http://webbook.nist.gov/chemistry/ Search PubMed
.
- K. Reuter and M. Scheffler, Phys. Rev. B: Condens. Matter, 2001, 65, 035406 CrossRef
.
- E. A. Kotomin, Y. A. Mastrikov, E. Heifets and J. Maier, Phys. Chem. Chem. Phys., 2008, 10, 4644–4649 RSC
.
- Y.-L. Lee, J. Kleis, J. Rossmeisl and D. Morgan, Phys. Rev. B: Condens. Matter Mater. Phys., 2009, 80, 224101 CrossRef
.
- Y. A. Mastrikov, R. Merkle, E. Heifets, E. A. Kotomin and J. Maier, J. Phys. Chem. C, 2010, 114, 3017–3027 CAS
.
-
J. Callaway, Quantum Theory of the Solid State, Academic Press, 1974 Search PubMed
.
- M. N. Iliev, M. V. Abrashev, H. G. Lee, V. N. Popov, Y. Y. Sun, C. Thomsen, R. L. Meng and C. W. Chu, Phys. Rev. B: Condens. Matter Mater. Phys., 1998, 57, 2872 CrossRef CAS
.
-
F. Reif, Fundamentals of Statistical and Thermal Physics (McGraw-Hill Series in Fundamentals of Physics), McGraw-Hill Science/Engineering/Math, 1965 Search PubMed
.
- G. Kresse and J. Hafner, Phys. Rev. B: Condens. Matter, 1993, 47, 558 CrossRef CAS
.
- G. Kresse and J. Furthmuller, Phys. Rev. B: Condens. Matter, 1996, 54, 11169–11186 CrossRef CAS
.
- P. E. Blochl, Phys. Rev. B: Condens. Matter, 1994, 50, 17953–17979 CrossRef
.
- G. Kresse and D. Joubert, Phys. Rev. B: Condens. Matter Mater. Phys., 1999, 59, 1758–1775 CrossRef CAS
.
- J. P. Perdew and Y. Wang, Phys. Rev. B: Condens. Matter, 1992, 45, 13244 CrossRef
.
- V. I. Anisimov, J. Zaanen and O. K. Andersen, Phys. Rev. B: Condens. Matter, 1991, 44, 943–954 CrossRef CAS
.
- V. I. Anisimov, F. Aryasetiawan and A. I. Lichtenstein, J. Phys.: Condens. Matter, 1997, 9, 767–808 CrossRef CAS
.
- L. Wang, T. Maxisch and G. Ceder, Phys. Rev. B: Condens. Matter Mater. Phys., 2006, 73, 195107 CrossRef
.
- S. Fritsch and A. Navrotsky, J. Am. Ceram. Soc., 1996, 79, 1761–1768 CrossRef CAS
.
- E. Heifets, J. Ho and B. Merinov, Phys. Rev. B: Condens. Matter Mater. Phys., 2007, 75, 155431 CrossRef
.
- S. B. Adler, J. Am. Ceram. Soc., 2001, 84, 2117–2119 CrossRef CAS
.
- X. Y. Chen, J. S. Yu and S. B. Adler, Chem. Mater., 2005, 17, 4537–4546 CrossRef CAS
.
- M. H. R. Lankhorst, H. J. M. Bouwmeester and H. Verweij, Phys. Rev. Lett., 1996, 77, 2989–2992 CrossRef CAS
.
- M. H. R. Lankhorst, H. J. M. Bouwmeester and H. Verweij, J. Am. Ceram. Soc., 1997, 80, 2175–2198 CrossRef CAS
.
- G. Makov and M. C. Payne, Phys. Rev. B: Condens. Matter, 1995, 51, 4014–4022 CrossRef CAS
.
- C. W. M. Castleton,
et al.
, Modell. Simul. Mater. Sci. Eng., 2009, 17, 084003 CrossRef
.
- R. M. Nieminen, Modell. Simul. Mater. Sci. Eng., 2009, 17, 084001 CrossRef
.
- J. W. Stevenson, M. M. Nasrallah, H. U. Anderson and D. M. Sparlin, J. Solid State Chem., 1993, 102, 175–184 CrossRef CAS
.
- K. Tobe, T. Kimura, Y. Okimoto and Y. Tokura, Phys. Rev. B: Condens. Matter, 2001, 64, 184421 CrossRef
.
- K. Kamata, T. Nakajima, T. Hayashi and T. Nakamura, Mater. Res. Bull., 1978, 13, 49–54 CrossRef CAS
.
- J. H. Kuo, H. U. Anderson and D. M. Sparlin, J. Solid State Chem., 1990, 87, 55–63 CrossRef CAS
.
-
R. R. Heikes, in Thermoelectricity: Science and Engineering, ed. Robert R. Heikes and Roland W. Ure, Jr., with the collaboration of Stephen J. Angello and others, Interscience Publishers, New York, 1961 Search PubMed
.
- H. Kamata, Y. Yonemura, J. Mizusaki, H. Tagawa, K. Naraya and T. Sasamoto, J. Phys. Chem. Solids, 1995, 56, 943–950 CrossRef CAS
.
-
H. Mehrer, Diffusion in Solids, Springer-Verlag, New York, 2007 Search PubMed
.
- T. Ishigaki, S. Yamauchi, K. Kishio, J. Mizusaki and K. Fueki, J. Solid State Chem., 1988, 73, 179–187 CrossRef CAS
.
- A. V. Berenov, J. L. MacManus-Driscoll and J. A. Kilner, Solid State Ionics, 1999, 122, 41–49 CrossRef CAS
.
- A. Belzner, T. M. Gür and R. A. Huggins, Solid State Ionics, 1992, 57, 327–337 CrossRef CAS
.
- J. B. Goodenough, J. S. Zhou, F. Rivadulla and E. Winkler, J. Solid State Chem., 2003, 175, 116–123 CrossRef CAS
.
Footnote |
| † Electronic supplementary information (ESI) available. See DOI: 10.1039/c1cp22380a |
| This journal is © the Owner Societies 2012 |


