H2 dissociation on individual Pd atoms deposited on Cu(111)
M.
Ramos
,
A. E.
Martínez
and
H. F.
Busnengo
*
Laboratorio de Colisiones Atómicas, Facultad de Ciencias Exactas Ingeniería y Agrimensura, Universidad Nacional de Rosario (UNR) and Instituto de Física de Rosario, Consejo Nacional de Investigaciones Científicas y Técnicas (CONICET), Av. Pellegrini 250 (2000) Rosario, Argentina. E-mail: ramos@ifir-conicet.gov.ar; martinez@ifir-conicet.gov.ar; busnengo@ifir-conicet.gov.ar
First published on 14th November 2011
Abstract
We present a Molecular Dynamics (MD) study based on Density Functional Theory (DFT) calculations for H2 interacting with a Pd–Cu(111) surface alloy for low Pd coverages, ΘPd. Our results show, in line with recent experimental data, that single isolated Pd atoms evaporated on Cu(111) significantly increase the reactivity of the otherwise inert pure Cu surface. On top of substitutional Pd atoms in the Pd–Cu(111) surface alloy, the activation energy barrier for H2 dissociation is smaller than the lowest one found on Cu(111) by a factor of two: 0.25 eV vs. 0.46 eV. Also in agreement with experiments, our DFT-MD calculations show that a large fraction of the dissociating H atoms efficiently spillover from Pd (i.e. the active sites), thanks to their extra kinetic energy due to the ∼0.50 eV chemisorption exothermicity. Still, our DFT-MD calculations predict a dissociative sticking probability for low energy H2 molecules that is much smaller than the estimated value from scanning tunneling microscopy experiments. Thus, further theoretical and experimental investigations are required for a complete understanding of H2 dissociation on low-ΘPd Pd–Cu(111) surface alloys.
Introduction
Physical vapor deposition (PVD) under ultrahigh vacuum conditions is a powerful technique to fabricate surfaces with specific physical and chemical properties. Using PVD, it is possible to modify the composition of the outermost layers of the host material,1–3 to grow strained pseudomorphic monolayers,4 and to produce stable metal clusters ranging from nanoparticles with thousands of atoms5 to individual isolated atoms.6,7 The geometrical structure and physical and chemical properties of the resulting surface strongly depend on the deposited atoms and the substrate, and can be often chosen by selecting particular evaporation conditions (e.g. exposure and surface temperature, Ts). Due to this reason, and thanks to modern accurate atomic-resolution characterization techniques (e.g. scanning tunneling microscopy, STM), bimetallic surface alloys have been attracting a great deal of attention during the last few years (see. e.g.ref. 8 and 9 and references therein).By evaporating a small amount of Pd atoms (e.g. 0.01 ML) on Cu(111) at 350 K, it is possible to obtain a flat Pd–Cu(111) surface alloy in which most of the Pd atoms replace topmost layer Cu atoms and are isolated from each other: i.e. neither nearest neighbor (NN) Pd dimers nor larger Pd clusters are formed.10 After exposing a Pd–Cu(111) surface alloy prepared this way to H2 molecules with thermal energies (Tg ≈ 300 K), Sykes and co-workers observed, using low temperature (7 K) STM, a large fraction of surface terraces covered by H atoms. This is in stark contrast with a complete absence of H atoms on Cu(111) observed for the same H2-exposure conditions. This shows that: (i) individual isolated Pd atoms embedded in the topmost layer of Cu(111) largely enhance the dissociative sticking probability of low energy H2 molecules with respect to the inert Cu(111) surface, and (ii) the spillover of the dissociated H atoms away from the Pd atoms is highly efficient. Moreover, the number of H2 dissociation events, roughly estimated from the final H coverage observed, was even larger than the estimated number of molecules impinging the surface directly on a Pd atom during the surface exposure. This was ascribed to a precursor state in which a significant fraction of H2 molecules that first encounter an unreactive region of the surface would stay trapped for a while, allowing them to diffuse far enough to finally reach a reactive site.
This surprisingly high reactivity of single isolated supported Pd atoms does not seem to be unique since a single Pd atom would be enough to activate acetylene cyclotrimerization on a MgO substrate.11 Still, neither the origin of the necessarily low activation energy barrier for H2 dissociation on Pd–Cu(111)6 nor the actual mechanism responsible for the surprisingly high dissociative sticking probability estimated from experiments has been fully elucidated.7
In this work we use Density Functional Theory (DFT) calculations to investigate the electronic structure of the Pd–Cu(111) surface alloy and possible reaction pathways for H2 dissociation on different surface regions: i.e. near surface and sub-surface Pd atoms as well as close to Cu atoms nearest neighbor (NN) and next nearest neighbor (NNN) of surface Pd atoms (hereafter referred to as CuNN and CuNNN respectively). We have also carried out DFT molecular dynamics (DFT-MD) calculations in order to evaluate the H2 dissociative adsorption probability on Pd–Cu(111) and also to investigate the role of possible dynamical effects (e.g. role of dynamic or inelastic trapping12) in the dissociation process. Finally, we have also used DFT-MD calculations to follow the H atoms produced after dissociation in order to investigate the efficacy of the spillover process after dissociation. In the following section we describe the surface alloy model considered and briefly summarize the computational details. Then, we report and discuss the DFT and DFT-MD results, and in the last section, we present the main conclusions of our study.
Theoretical method
By evaporating Pd on Cu(111) it is possible to create a Pd–Cu(111) surface alloy in which most of the Pd atoms replace topmost layer Cu atoms. For instance, after exposing a flat Cu(111) surface with a 0.01 ML of Pd atoms at 350 K, Sykes and co-workers obtained a surface alloy with ∼90% of Pd atoms substituting topmost layer Cu atoms and 10% occupying sub-surface sites.10 In line with experiments, previous theoretical studies have shown that surface alloy configurations in which Pd substitute outermost or second layer Cu atoms are both energetically more stable than any structure involving an overlayer of Pd ad-atoms.13,14 On the other hand, it is expected that the presence of Pd atoms located below the second outermost surface layer will barely affect the surface reactivity. Accordingly, we have used DFT to investigate the geometric, electronic structure and reactivity of Pd–Cu(111) surface models, only with Pd atoms replacing outermost layer and second layer Cu atoms. In what follows, the latter surface alloy structures will be referred to as Pd(1)–Cu(111) and Pd(2)–Cu(111) respectively.For the lowest Pd-coverages considered in ref. 7 (i.e.ΘPd ≈ 0.01 = 0.01 ML), Pd form neither dimers nor clusters and so, act as isolated atoms. It is to note, however, that near the steps the Pd-concentration is larger because it is precisely in the step edges where alloying occurs. Thus, to stay close to this low-ΘPd experimental condition but at an affordable computational cost, most of the calculations have been carried out for a 3 × 3 unit cell with only one Pd atom per cell (i.e.ΘPd = 1/9, Fig. 1(a)). Still, some extra calculations were done also for a 2 × 2 unit cell also with one Pd atom per cell (i.e.ΘPd = 1/4, Fig. 1(b)), in order to estimate the influence of surface patches with a locally higher Pd coverage.
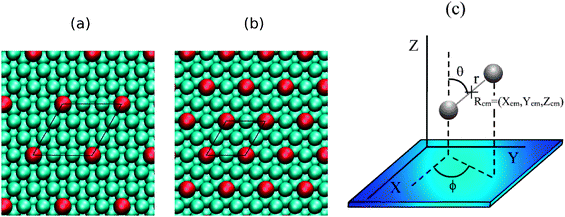 | ||
| Fig. 1 Left panels: top view of the Pd(1)–Cu(111) surface showing the (a) (3×3) and (b) (2×2) unit cells employed in the calculations. Turquoise and red represent Cu and Pd atoms, respectively. (c) Coordinates used to define the position and orientation of H2 near the surface. | ||
All the calculations have been carried out with the Vienna Ab initio Simulation Package, VASP,15–19 that uses a plane wave basis set to represent the Kohn–Sham orbitals. The interaction of valence electrons with atomic cores has been described using the Projected Augmented Wave (PAW) method20,21 and we have used PBE to account for electronic exchange and correlation within the generalized gradient approximation (GGA).22 The energy cutoff was set to 350 eV, electronic smearing was introduced following the Methfessel and Paxton approach23 with N = 1 and σ = 0.20 eV. With these settings, the DFT Cu-bulk lattice constant is aTh = 3.64 Å, which is in good agreement with the experimental value: aExp = 3.61 Å.24 The surface alloy has been represented by a 4-layer slab separated by a ∼ 15 Å width vacuum region from its closest periodic image. The two bottom layers of the slab were kept fixed at the theoretical distance between consecutive (111) planes in bulk,  , whereas the positions of the atoms in the two topmost layers were allowed to relax. Calculations for the 3 × 3 and 2 × 2 cells were carried out using 5 × 5 × 1 and 11 × 11 × 1 Monkhorst and Pack k-point grids25 respectively.
In line with previous theoretical results, for ΘPd = 1/9 (3 × 3 unit cell) we obtain a total energy of Pd(1)–Cu(111) lower than for Pd(2)–Cu(111) by 0.17 eV. The substitution of a topmost layer Cu atom by a Pd atom provokes a small ripple of the outermost layer of Cu atoms (∼0.014 Å) and the average height of the substitutional Pd above the remaining topmost and second layer Cu atoms is 0.08 Å and 2.15 Å respectively. In addition, the Pd–CuNN distance is 2.6 Å, i.e. ∼0.03 Å larger than the theoretical NN Cu–Cu distance in Cu(111). Both geometric distortions are simply due to the fact that Pd atoms are larger than Cu.
Results and discussions
In order to investigate the reactivity of the Pd–Cu(111) surface alloy, we have first computed the adsorption energy of a H atom on Pd(1)–Cu(111) for different possible adsorption sites. In agreement with the DFT results reported in ref. 6, we obtained that the hollow sites NN to the Pd atom are the energetically most stable ones for H chemisorption (e.g. the adsorption energy is ∼60 meV larger than for a hollow site surrounded by three Cu atoms). A summary of the adsorption energies computed on the different hollow sites of Pd(1)–Cu(111) shown in Fig. 2 is reported in Table 1.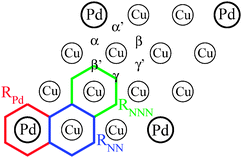 | ||
| Fig. 2 Schematic representation of the Pd(1)–Cu(111) topmost layer, definition of different hollow adsorption sites and the three hexagonal regions considered in the DFT-MD calculations (see the text). | ||
| Sites | α | α′ | β | β′ | γ | γ′ |
|---|---|---|---|---|---|---|
| E ads/eV | 0.227 | 0.236 | 0.145 | 0.129 | 0.168 | 0.177 |
Then, we computed some two-dimensional (2D) cuts (usually called elbow plots) of the H2/Pd(1)–Cu(111) potential energy surface (PES) which depends on the three Cartesian coordinates of the H2 center of mass (Xcm,Ycm,Zcm), the H–H distance, r, and the molecular orientation defined by the polar and azimuthal angles of the H–H interatomic vector: θ and ϕ (see Fig. 1c). In Fig. 3(a) and (b) we respectively consider H2 flat on a rigid Pd(1)–Cu(111) surface with its center of mass on a Pd and CuNN atom and with the H–H bond pointing to fcc and hcp sites (configurations to be referred to as fcc-topPd-hcp and fcc-topCu-hcp) respectively. For comparison, in panels (c) and (d) we plot 2D cuts (Zcm,r) for similar molecular configurations but on Pd(111) and Cu(111) respectively.
For the fcc-topPd-hcp configuration, the activation barrier for H2 dissociation is much smaller than for fcc-topCu-hcp (∼0.25 eV vs. ∼0.75 eV). It is important to note that 0.25 eV is also much smaller than the lowest activation barrier we have found for H2/Cu(111) at the same level of theory, i.e. DFT-PBE and using the same unit cell, k-points sampling and energy cutoff: ∼0.46 eV (see Fig. 6c below). Thus, the replacement of a single Cu atom of the outermost layer of Cu(111) by a Pd atom strongly favors H2 dissociation. Still, this is not enough to turn the dissociative adsorption process to non-activated as in the case of Pd(111) (Fig. 3c). It is also worthy of note that the activation energies found in the fcc-topCu-hcp 2D cuts (Zcm,r) on a CuNN atom (Fig. 3b) and on a CuNNN atom (not shown) are very close to each other. The latter activation barriers are slightly larger than for a similar configuration on Cu(111) (Fig. 3d): 0.75 eV vs. 0.65 eV. This might be due to the strain suffered by Cu atoms (compression) induced by the presence of Pd atoms in Pd(1)–Cu(111).26
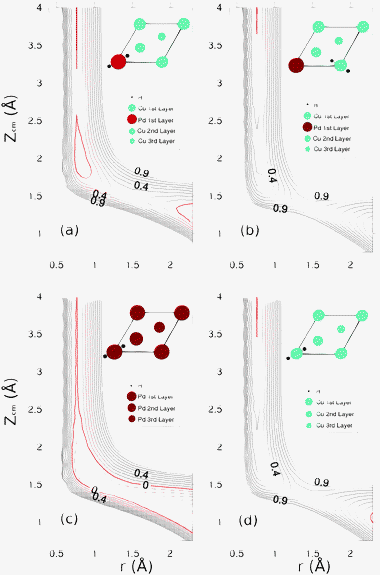 | ||
| Fig. 3 2D cuts (Zcm,r) of the H2-surface PES for various molecular configurations. (a) fcc-topPd-hcp and (b) fcc-topCu-hcp, on the Pd(1)–Cu(111) surface; (c) fcc-top-hcp on the Pd(111) surface and (d) fcc-top-hcp on the Cu(111) surface. Distance between equipotential lines is ΔE = 0.10 eV. The reference energy level E = 0 (corresponding to H2 far from the surface and for r = req = 0.75 Å) is indicated with a red line and those for which E < 0 by dashed lines. | ||
These reactivity trends are usually understood through the analysis of the density of states (DOS) projected on the topmost layer surface atoms. In Fig. 4(a) we show the total DOS projected on Pd atoms (Pd-PDOS) and on CuNN and CuNNN (CuNN-PDOS and CuNNN-PDOS respectively) in Pd(1)–Cu(111). In Fig. 4(b) we compare the Pd-PDOS for Pd(1)–Cu(111) and for Pd(111), whereas in panel (c) we compare both CuNN-PDOS and CuNNN-PDOS for Pd(1)–Cu(111) with the Cu-PDOS for Cu(111). The main signature of the Pd(1)–Cu(111) electronic structure shown in Fig. 4 is the difference between the Pd-PDOS on one side and the CuNN-PDOS and CuNNN-PDOS on the other. The Pd-PDOS: (i) presents a large peak at ∼1.3 eV below the Fermi level corresponding to relatively weakly hybridized Pd d-orbitals (Fig. 4a), and (ii) is very small at the Fermi level in contrast with the Pd-PDOS for Pd(111) (Fig. 4b). The center of gravity of the d-band projected onto Pd atoms is 0.6 eV higher than for Cu atoms. According to the so-called d-band model,27 this provides an explanation of why the activation energy barrier for H2 dissociation on topPd sites is much smaller than on topCu sites. In fact, the CuNN-PDOS and CuNNN-PDOS in Pd(1)–Cu(111) are very similar to each other and also similar to the Cu-PDOS for Cu(111) (Fig. 4c). This clearly indicates a relatively small influence of Pd atoms on the surface electronic structure around Cu atoms.
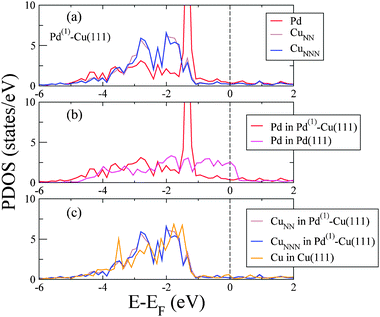 | ||
| Fig. 4 (a) PDOS corresponding to a Pd (red line), a CuNN (brown line) and a CuNNN (blue line) atom in Pd(1)–Cu(111). (b) Pd-PDOS for Pd(1)–Cu(111) (red line) and for a topmost layer atom in Pd(111) (magenta line). (c) Cu-PDOS for a CuNN (brown line) and a CuNNN (blue line) atom in Pd(1)–Cu(111) and for a Cu atom in Cu(111) (orange line). The Fermi energy is indicated by the vertical dashed line. | ||
Though the 2D cuts (Zcm,r) shown in Fig. 3 do provide useful information about the ability of Pd(1)–Cu(111) to dissociate H2, it must be kept in mind that the H2-surface PES is six-dimensional (6D), and more favorable dissociation pathways might also involve other molecular degrees of freedom apart from r and Zcm. Moreover, a further reduction of the activation barriers due to the surface relaxation in the presence of the H2 molecule not accounted for in Fig. 3 cannot be ruled out. Therefore, we have also carried out Nudged Elastic Band (NEB) calculations to look for the minimum energy pathway (MEP) for H2 dissociation on Pd(1)–Cu(111) taking into account all the six molecular coordinates and optimizing also the coordinates of substrate atoms in the two topmost layers. We have started the NEB calculations from a dissociation pathway for H2 parallel to the Pd(1)–Cu(111) surface, with its center of mass on a topPd site and with a fcc-topPd-hcp orientation. Fig. 3(a) indicates that on topPd sites, there is a shallow potential well for r ≈ 0.8 Å and Zcm ≈ 1.9 Å, hereafter referred to as molecular well. Accordingly, we have carried out two NEB calculations to compute the MEP for: (i) H2 initially 3.25 Å above the surface and finally in the molecular well, and (ii) H2 initially in the molecular well and finally dissociated with the H atoms adsorbed on fcc and hcp sites. Fig. 5(a) and (b) show the MEPs obtained this way for the full dissociation process (i+ii) for surface unit cells (3×3) and (2×2) respectively. It can be seen in Fig. 5(a) that reaching the shallow molecular well on topPd sites (∼0.10 eV depth) is a barrierless process but there exists a significant late activation energy barrier for dissociation: Eb ≈ 0.25 eV (for r ≈ 1.5 Å, i.e. twice the H–H equilibrium distance in vacuum). Thus, these results confirm the scenario described above in the light of 2D cuts of the H2/Pd(1)–Cu(111) PES for a frozen substrate (Fig. 3). The latter conclusions are not altered in a surface patch with a locally larger Pd coverage. Using a (2×2) unit cell of Pd(1)/Cu(111) (ΘPd = 1/4), the activation energy barrier for H2 dissociation is reduced (with respect to the case of ΘPd = 1/9 shown in panel a) by only ∼0.04 eV (Fig. 5).
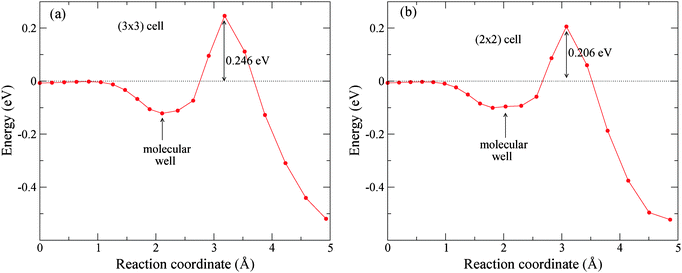 | ||
| Fig. 5 Minimum energy pathways for H2 dissociative adsorption on P(1)–Cu(111) near a topPd site. (a) (3×3) unit cell (ΘPd = 1/9), and (b) (2×2) unit cell (ΘPd = 1/4). | ||
It might be argued that sub-surface Pd atoms might enhance reactivity because, due to their larger size, they are expected to provoke NN Cu–Cu distances in the outermost Cu layer of the surface alloy, larger than in Cu(111). To explore this, we have also computed a few 2D cuts (Zcm,r) of the PES for H2 interacting with Pd(2)–Cu(111). In Fig. 6 we show such 2D cuts for a H2 molecule parallel to the surface with its center of mass on a top site (panel a) and on a bridge site (panel b), in both cases for the H–H bond pointing to the nearest fcc and hcp sites: i.e. for fcc-topCu-hcp and fcc-bridge-hcp configurations. For comparison, in Fig. 6c we also show the 2D cut (Zcm,r) for H2 in the fcc-bridge-hcp configuration on a pure Cu(111) surface (i.e. the one for which the lowest activation barrier is found). These results show that Pd(2)–Cu(111) is significantly less reactive than Pd(1)–Cu(111): the activation barriers for fcc-topCu-hcp and fcc-bridge-hcp on Pd(2)–Cu(111) are both ∼0.25 eV larger than for fcc-topPd-hcp on Pd(1)–Cu(111). Thus, the surface strain induced by second layer Pd atoms in Pd(2)–Cu(111) does not provoke a significant change in the activation barrier for H2 dissociation for the fcc-bridge-hcp configuration with respect to the case of the pure Cu(111) surface (compare Fig. 6b and c). For this reason, in what follows we will restrict our study to H2 interacting with Pd(1)–Cu(111).
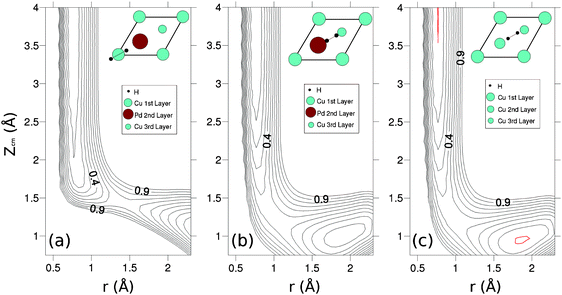 | ||
| Fig. 6 2D cuts (Zcm,r) of the H2-surface PES for different molecular configurations. (a) fcc-topPd-hcp and (b) fcc-bridge-hcp, on the Pd(2)–Cu(111) surface; (c) fcc-bridge-hcp on the Cu(111) surface. Distance between equipotential lines is ΔE = 0.10 eV. The reference energy level E = 0 (corresponding to H2 far from the surface and for r = req = 0.75 Å) is indicated with a thick line and those for which E < 0 by dashed lines. | ||
Molecular dynamics
So far, the analysis has been restricted to static aspects of the H2/Pd(1)–Cu(111) interaction. However, in order to evaluate reactive sticking probabilities it is necessary to carry out dynamics calculations. For instance, for N2/Ru(0001)28 and N2/W(110)29 it has been found that, due to dynamical effects, the dissociative adsorption probability is very small even for molecules impinging the surface with kinetic energies larger than the minimum activation energy barrier for dissociation. On the other hand, it is well known that the vibrational zero point energy (ZPE) of H2 (∼0.27 eV) can play a significant role promoting dissociation. An efficient transfer of the initial vibrational ZPE to the reaction coordinate often gives rise to a reactive adsorption threshold well below the value of the lowest activation energy barrier found in static calculations.30,31Dynamical calculations have been carried out using the DFT-MD approach32 in which the classical equations of motion are integrated along the time by evaluating the forces acting on all the atoms directly from DFT calculations through the use of the Hellmann–Feynman theorem. We have performed quasi-classical calculations in which the initial vibrational ZPE of the molecules is taken into account.33 DFT-MD calculations were carried out in the microcanonical ensemble using a fourth order predictor corrector algorithm with a fixed time step of 0.3 fs. The initial Zcm value for all the trajectories was 4 Å. Surface atoms were initially placed at their equilibrium positions and with zero kinetic energy but those in the two outermost layers were allowed to move due to the interaction with the impinging molecules. This allowed us to take into account also molecule–surface energy exchange effects which for light molecules like H2 are expected to play a minor role for the dissociation process, but they are certainly a prerequisite for a description of the post-dissociation spillover of H atoms from the active Pd sites to the Cu host.
Due to the high computational cost of DFT-MD calculations we have only considered (initially non-rotating) H2 molecules impinging the surface at normal incidence with energies, Ei = 0.10 eV, 0.15 eV and 0.20 eV. For each Ei value we have integrated 200 trajectories which were stopped whenever r reached the value rdiss = 2.3 Å (dissociation) or when Zcm reached the value Zvac = 4 Å, with the velocity of the center of mass pointing to vacuum (reflection). In order to investigate in some detail the scope of the influence of Pd atoms it is convenient to divide the Pd(1)–Cu(111)-(3×3) cell into three kinds of hexagonal regions (Fig. 2): (i) RPd: centered at a Pd atom, (ii) RNN: centered at a CuNN atom, and (iii) RNNN: centered at a CuNNN atom. Then, for each Ei value, we have integrated 100 trajectories for H2 molecules impinging the surface within RPd and 100 trajectories for RNN. The number of dissociation events we have found in each case is reported in Table 2.
| E i /eV | Number of reactive trajectories | Number of trapped trajectories | ||
|---|---|---|---|---|
| RPd | RNN | RPd | RNN | |
| 0.10 | 0 | 0 | 10 | 0 |
| 0.15 | 6 | 0 | 2 | 0 |
| 0.20 | 6 | 0 | 4 | 1 |
For H2 molecules initially impinging the surface within the RPd region we have found 6 dissociation events for both Ei = 0.15 eV and 0.20 eV whereas for Ei = 0.10 eV, no dissociation events were obtained. Interestingly, Ei = 0.15 eV and 0.20 eV are both lower than the minimum activation energy barrier found for H2/Pd(1)–Cu(111)-(3×3) (Fig. 5a): i.e. 0.246 eV. Thus, for these Ei values, dissociative adsorption takes place thanks to a fraction of the initial vibrational ZPE (∼0.27 eV) that is transferred to the reaction coordinate. Since for Ei = 0.10 eV we have not found any dissociation event (among the 200 trajectories considered), it seems that less than ∼50% of the initial vibrational ZPE can be efficiently used to promote dissociation at these low energies.
For trajectories initially impinging the surface within the RNN region, we have found no dissociation events: all the computed trajectories that start there are reflected for the three Ei values considered. This clearly shows that, at least for this range of impact energies, the reactive influence of Pd atoms has a relatively short range. Accordingly, we have not computed trajectories for H2 molecules initially in RNNN that is even further away from the Pd atoms than RNN.
From these results, we conclude that the reactive sticking probability, Pdiss, of H2 molecules impinging the surface within RPd for Ei ≈ 0.15–0.20 eV is ∼0.06. Thus, for Pd(1)–Cu(111)-(3×3) (ΘPd = 1/9), Pdiss ≈ 0.06/9 = 7 × 10⁻³, whereas for ΘPd = 1/100 (the Pd coverage considered in ref. 6), Pdiss ≈ 0.06/100 = 6 × 10⁻⁴. Therefore, though our calculations do confirm that individual isolated Pd atoms deposited on Cu(111) largely enhance the substrate reactivity, for ΘPd = 0.01 and Ei ≈ 0.15–0.20 eV they predict Pdiss values much smaller than the one estimated from experiments for even smaller molecular kinetic energies: i.e. ∼2.5 × 10−2.6 The relatively small number of computed trajectories certainly entails non-negligible statistical errors of the estimated theoretical sticking probabilities given above. In addition, for the considered impact energies that are close to the dissociation threshold, quantum effects might play some role (see e.g.ref. 34). Unfortunately, full-dimensional quantum calculations are not possible in the present case in which a continuous representation of the PES (obtained by interpolation or fitting of the DFT data) is not available. In any case, the factor of ∼40 (∼2.5 × 10⁻²/6 × 10−4) by which the experimental estimated value is larger than our present theoretical result is well beyond our statistical errors.
We now turn to the analysis of the reaction mechanisms through which H2 dissociates on Pd(1)–Cu(111). In the right columns of Table 2 we also report the number of trajectories that remain trapped near the surface in our DFT-MD calculations. Here we have characterized trapping according to the number of rebounds, Nreb, undergone by a trajectory before dissociation or reflection to vacuum. Thus, whenever Nreb > 5, we considered that the trajectory has been temporarily trapped whereas those for which Nreb ≤ 5 are associated to direct scattering events. The results presented in Table 2 show that some trapping takes place within the RPd region and, as usual, the trapping probability tends to decrease when Ei increases.35 It is important to mention that for both Ei = 0.10 eV and 0.15 eV, all the trapped trajectories finally scatter back to vacuum (only direct dissociation was found for Ei = 0.15 eV). Though for Ei = 0.20 eV two of the six reactive trajectories have been trapped before dissociation, at the two lowest energies we have considered, trapping does not promote dissociation efficiently. In the present calculations, substrate atoms were initially in their equilibrium positions and with zero kinetic energy that corresponds to Ts = 0 K. So, for high Ts values trapping is expected to play an even less important role than reported in Table 2 because in general, trapping decreases when Ts increases.36
Also important is the fact that almost no trapping was found among trajectories initially impinging the surface in the RNN region. This is consistent with the fact that the H2/Pd(1)–Cu(111) DFT-PBE PES does not present any significant attraction (in the entrance channel) exerted by the surface for molecules impinging the surface more than ∼1.3 Å away from a Pd atom (i.e. in RNN and RNNN). Thus, though under the experimental exposure conditions (Tg = 300 K)6,7 a large fraction of the impinging molecules have collision energies smaller than 0.1 eV, our results do not support the hypothesis of a prominent role of a precursor state as proposed to explain the surprisingly large reactive adsorption probability estimated from experiments.6 The origin of the mentioned discrepancy between theory and experiments is unfortunately unclear, and still requires further scrutiny. For instance, it is unlikely that this discrepancy would be due to the use of the DFT-PBE GGA method. As well as the similar so-called PW91 exchange correlation functional,37 for H2 dissociation on metal surfaces, PBE calculations usually predict reactive adsorption probabilities in good agreement38 or slightly larger than experiments39 but not the converse as in the present case (see also ref. 40 and references therein).
A mismatch between the surface alloy model considered here, i.e. Pd(1)–Cu(111), and the actual experimental surface structure of ref. 6 and 7, cannot be ruled out. Still, for a rigorous and direct comparison with the present theoretical results, measurements of the H2 sticking probability as a function of impact energy using a supersonic molecular beam would be also desirable. Thus, further investigations from both experiments and theory are still required.
In Fig. 7 we have plotted the kinetic energy of the molecule and the slab, as a function of time for two of the six reactive trajectories obtained for Ei = 0.20 eV: a direct trajectory (left panels) and an indirect trajectory (right panels). In the bottom panels we have also plotted the time-evolution of the r coordinate in order to identify the time at which dissociation takes place (i.e. r = rdiss = 2.3 Å). For direct (indirect) dissociation, the kinetic energy of surface atoms before dissociation is always smaller than 0.02 eV (0.05 eV). Thus, the H2-surface energy transfer before dissociation is in general very small, which validates the use of the frozen surface approximation as far as only the dissociation process is of interest.
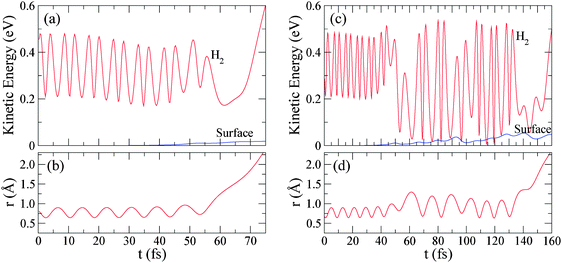 | ||
| Fig. 7 (a) Kinetic energy of H2 and the surface atoms as a function of time for a trajectory leading to direct dissociation for Ei = 0.20 eV. (b) Time-evolution of the r coordinate for the same trajectory, indicating when dissociation takes place. (c) and (d) Same as (a) and (b) but for a trajectory leading to indirect dissociation. | ||
When r increases beyond rdiss, the kinetic energy of the H2 molecule rapidly increases because of the exothermicity of the dissociation reaction (i.e. ∼ 0.50 eV). Consequently, dissociative adsorption produces hot H atoms that, in principle, can migrate away from the active topPd site. How fast H atoms lose their extra kinetic energy and how far they can travel before depend on dynamical factors governing the H-surface interaction, as well as on Ts.41 Hot atoms lose energy through two different mechanisms: (i) energy exchange with surface phonons41,42 and (ii) electron–hole pair excitations in the substrate (see e.g.ref. 43 and 44). Whereas the treatment of the latter mechanism requires the use of some extra approximations,44 the former effect can be properly estimated using DFT-MD calculations. Therefore, we have integrated all the reactive trajectories for Ei = 0.20 eV, until the total kinetic energy of the two H atoms on one hand, and the total kinetic energy of the substrate atoms on the other, become similar to each other (and close to ∼0.25 eV). This takes place approximately for total integration times of ∼1.5 ps. Fig. 8 shows the full trajectory of the H atoms for all the six reactive trajectories obtained for Ei = 0.20 eV. In this picture, the larger thicker (smaller thinner) circles represent the topmost layer Pd (Cu) atoms. In all the cases, the trajectories start close to the Pd atom depicted in the center of each panel and the arrows indicate the positions of the H atoms at the end of the integration period (i.e. ∼1.5 ps). Interestingly, only in one case (bottom right panel) both H atoms finally occupy hollow sites nearest to the central Pd atom on which dissociation takes place. In most of the cases, one H atom remains close to the active Pd atom whereas the other goes away and, in one case both H atoms finally occupy hollow sites far from the Pd atom where dissociation has taken place. Due to the dissociation exothermicity, Pd atoms on which dissociation takes place cannot capture the produced hot H atoms which rapidly migrate away from the active site. It is important to note that our results might be somewhat polluted by the use of a (3×3) surface unit cell that is not large enough to avoid the interaction of the dissociating H atoms with their periodic images (not represented in Fig. 8).42 However, these results are still meaningful and clearly illustrate the tendency of hot H atoms to travel away from the active Pd atom after dissociation on Pd(1)–Cu(111). The efficacy of the spillover of hot H atoms from the active Pd sites might depend on Ts.41 Though we have only considered Ts = 0 K, our results are in line with experiments that put in evidence a rapid spillover of the hot H atoms produced by H2 dissociation from the Pd atoms to Pd-free regions of the Pd–Cu(111) surface alloy.
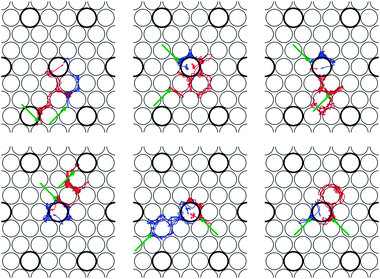 | ||
| Fig. 8 Top view of the trajectories followed by the H atoms (blue and red lines), in the six dissociation events obtained for Ei = 0.20 eV. The arrows indicate the positions of the H atoms at the end of the integration period ∼1.5 ps. The thicker larger (thinner) circles represent topmost layer Pd (Cu) atoms. | ||
Conclusions
We have investigated the electronic properties and reactivity of low Pd-coverage Pd–Cu(111) surface alloys through total energy and molecular dynamics (MD) calculations based on Density Functional Theory. In line with recent experiments, we have found that individual isolated Pd atoms embedded in the topmost layer greatly enhance the surface reactivity of Cu(111) by reducing the activation energy barrier for H2 dissociative adsorption by a factor of two: i.e. ∼0.25 eV for Pd–Cu(111) vs. ∼0.46 eV for Cu(111). The latter activation energy barrier in the Pd–Cu(111) surface alloy is found on top of substitutional Pd atoms where, also in contrast with Cu(111), the molecule–surface potential energy surface is attractive in the entrance channel and presents a local minimum corresponding to a ∼0.12 eV depth molecular well. This higher reactivity around Pd atoms can be associated with the interaction of the H2 occupied molecular orbital with Pd d-states of the surface alloy that are closer to the Fermi energy than in the case of Cu(111). On top of Cu atoms and in general, far from substitutional Pd atoms, the activation energy barriers for H2 dissociation on Pd–Cu(111) are even higher than on Cu(111). This seems to be due to the surface strain produced by substitutional Pd atoms that entail, in the surface alloy, Cu–Cu distances shorter than in Cu(111).In spite of the mentioned enhanced surface reactivity due to individual isolated Pd atoms, for a low Pd coverage, ΘPd, our calculations predict a H2 dissociation threshold of ∼0.10–0.15 eV and dissociative sticking probabilities of only ∼0.06×ΘPd, for H2 with initial perpendicular energies up to 0.20 eV. Such a low dissociative adsorption probability is obviously due to the existence of a ∼0.25 eV activation energy barrier. In addition, for impact energies slightly above the dissociation threshold, only molecules impinging the surface very close to Pd atoms can dissociate. Molecules first encountering an unreactive region of the surface alloy are scattered back to vacuum directly, i.e. without staying trapped near the surface which might allow them to diffuse and eventually find a reactive substitutional Pd atom. Accordingly, the theoretical dissociative adsorption probabilities found here are much lower than the value estimated from recent scanning tunneling experiments. To elucidate the origin of this discrepancy further investigations are required. Still, in agreement with the experimental observation, our MD calculations do predict an efficient H spillover from Pd atoms due to a relatively slow energy dissipation to the substrate of the extra kinetic energy carried by the hot H atoms produced by the exothermic (by ∼0.50 eV) dissociation process.
Acknowledgements
The authors acknowledge Charles Sykes and Daniel Farías for reading the manuscript and for useful comments about this work. This work has been supported by ANPCyT-Argentina (Project PICT 33595), by CONICET-Argentina (Project PIP 0667) and by the UNR (Project PID ING235).References
- G. Attard and D. King, Surf. Sci., 1987, 188, 589 CrossRef CAS.
- D. A. Butler and B. E. Hayden, Surf. Sci., 1995, 337, 67 CrossRef CAS.
- M. Beutl, J. Lesnik, K. D. Rendulic, R. Hirschl, A. Eichler, G. Kresse and J. Hafner, Chem. Phys. Lett., 2001, 342, 473 CrossRef CAS.
- R. Otero, F. Calleja, V. García-Suárez, J. Hinarejos, J. de la Figuera, J. Ferrer, A. Vázquez de Parga and R. Miranda, Surf. Sci., 2004, 550, 65 CrossRef CAS.
- J. Libuda and H. Freund, Surf. Sci. Rep., 2005, 57, 157 CrossRef CAS.
- H. L. Tierney, A. E. Baber, J. R. Kitchin and E. C. H. Sykes, Phys. Rev. Lett., 2009, 103, 1 CrossRef.
- A. E. Baber, H. L. Tierney, T. J. Lawton and E. C. H. Sykes, ChemCatChem., 2011, 3, 607 CrossRef CAS.
- B. E. Hayden and A. Hodgson, J. Phys.: Condens. Matter., 1999, 11, 8397 CrossRef CAS.
- J. Chen, C. Menning and M. Zellner, Surf. Sci. Rep., 2008, 63, 201 CrossRef CAS.
- H. L. Tierney, A. E. Baber and E. C. H. Sykes, J. Phys. Chem. C, 2009, 113, 7246 CAS.
- S. Abbet, A. Sanchez, U. Heiz, W.-D. Schneider, A. M. Ferrari, G. Pacchioni and N. Rösch, J. Am. Chem. Soc., 2000, 122, 3453 CrossRef CAS.
- H. F. Busnengo, W. Dong and A. Salin, Phys. Rev. Lett., 2004, 93, 236103 CrossRef CAS.
- A. Canzian, H. O. Mosca and G. Bozzolo, Surf. Sci., 2004, 551, 9 CrossRef CAS.
- A. Roudgar and A. Gros, Surf. Sci., 2005, 597, 42 CrossRef CAS.
- G. Kresse and J. Hafner, Phys. Rev. B: Condens. Matter, 1993, 47, 558 CrossRef CAS.
- G. Kresse and J. Hafner, Phys. Rev. B: Condens. Matter, 1994, 49, 14251 CrossRef CAS.
- G. Kresse and J. Hafner, J. Phys.: Condens. Matter., 1994, 6, 8245 CrossRef CAS.
- G. Kresse and J. Furthmüller, Comput. Mater. Sci., 1996, 6, 15 CrossRef CAS.
- G. Kresse and J. Furthmüller, Phys. Rev. B: Condens. Matter, 1996, 54, 11169 CrossRef CAS.
- P. E. Blöchl, Phys. Rev. B: Condens. Matter, 1994, 50, 17953 CrossRef.
- G. Kresse and D. Joubert, Phys. Rev. B: Condens. Matter, 1999, 59, 1758 CrossRef CAS.
- J. P. Perdew, K. Burke and M. Ernzerhof, Phys. Rev. Lett., 1997, 78, 1396 CrossRef CAS.
- M. Methfessel and A. T. Paxton, Phys. Rev. B: Condens. Matter, 1989, 40, 3616 CrossRef CAS.
- C. Kittel, Introduction to solid state physics, John Wiley & Sons, New York, 1971 Search PubMed.
- H. Monkhorst and D. Pack, Phys. Rev. B: Solid State, 1976, 13, 5186 CrossRef.
- S. Sakong and A. Groß, Surf. Sci., 2003, 525, 107 CrossRef CAS.
- B. Hammer and J. K. Nørskov, Nature, 1995, 376, 238 CrossRef CAS.
- C. Díaz, J. K. Vincent, G. P. Krishnamohan, R. A. Olsen, G. J. Kroes, K. Honkala and J. Norskov, Phys. Rev. Lett., 2006, 96, 096102 CrossRef.
- M. Alducin, R. M. A. Díez Muiño, H. F. Busnengo and A. Salin, Phys. Rev. Lett., 2006, 97, 056102 CrossRef CAS.
- P. Rivière, H. F. Busnengo and F. Martín, J. Chem. Phys., 2005, 123, 074705 CrossRef.
- C. Díaz and R. A. Olsen, J. Chem. Phys., 2009, 130, 094706 CrossRef.
- A. Groß and A. Dianat, Phys. Rev. Lett., 2007, 98, 206107 CrossRef.
- H. F. Busnengo, C. Crespos, W. Dong, J. C. Rayez and A. Salin, J. Chem. Phys., 2002, 116, 9005 CrossRef CAS.
- H. F. Busnengo, E. Pijper, M. F. Somers, G. J. Kroes, A. Salin, R. A. Olsen, D. Lemoine and W. Dong, Chem. Phys. Lett., 2002, 356, 515 CrossRef CAS.
- M. A. Di Césare, H. F. Busnengo, W. Dong and A. Salin, J. Chem. Phys., 2003, 118, 11226 CrossRef. -
- H. Busnengo, M. Di Césare, W. Dong and A. Salin, Phys. Rev. B: Condens. Matter, 2005, 72, 1 CrossRef.
- J. P. Perdew and Y. Wang, Phys. Rev. B: Condens. Matter, 1992, 45, 13244 CrossRef.
- A. Salin, J. Chem. Phys., 2006, 124, 104704 CrossRef CAS.
- C. Díaz, E. Pijper, R. A. Olsen, H. F. Busnengo, D. Auerbach and G. J. Kroes, Science, 2009, 326, 832 CrossRef.
- G. A. Bocan, R. Díez Muiño, M. Alducin, H. F. Busnengo and A. Salin, J. Chem. Phys., 2008, 128, 154704 CrossRef CAS.
- N. Pineau, H. F. Busnengo, J. C. Rayez and A. Salin, J. Chem. Phys., 2005, 122, 214705 CrossRef CAS.
- A. Groß, Phys. Rev. Lett., 2009, 103, 6 Search PubMed.
- A. Luntz and M. Persson, J. Chem. Phys., 2005, 123, 074704 CrossRef CAS.
- J. Juaristi, M. Alducin, R. Muiño, H. F. Busnengo and A. Salin, Phys. Rev. Lett., 2008, 100, 1 CrossRef.
| This journal is © the Owner Societies 2012 |
