Synthesis of hexagonal-symmetry α-iron oxyhydroxide crystals using reduced graphene oxide as a surfactant and their Li storage properties†
Cuimiao
Zhang
ab,
Jixin
Zhu
a,
Xianhong
Rui
ab,
Jing
Chen
a,
Daohao
Sim
a,
Wenhui
Shi
a,
Huey Hoon
Hng
a,
Tuti Mariana
Lim
*bc and
Qingyu
Yan
*ade
aSchool of Materials Science and Engineering, Nanyang Technological University, 50 Nanyang Avenue, Singapore, 639798, Singapore. E-mail: Alexyan@ntu.edu.sg
bSchool of Civil & Environmental Engineering, Nanyang Technological University, 50 Nanyang Avenue, Singapore, 639798, Singapore. E-mail: TMLim@ntu.edu.sg
cSchool of Life Sciences and Chemical Technology, Ngee Ann Polytechnic, 599489, Singapore
dEnergy Research Institute, Nanyang Technological University, 637459, Singapore
eTUM CREATE Centre for Electromobility, Nanyang Technological University, 637459, Singapore
First published on 14th October 2011
Abstract
Microcrystalline α-iron oxyhydroxide/reduced graphene oxide (α-FeOOH/rGO) samples have been successfully synthesized by a facile hydrothermal process. The α-FeOOH/rGO samples are either hexagonal disks with a diameter of ∼1 μm and a thickness of 300 nm or hexapods with a diameter of ∼2 μm and a thickness of 700 nm, while only bulk and aggregated FeOOH is observed without the addition of graphene oxide sheets. The size and shape of the α-FeOOH depend on the reaction time, concentration of Fe3+, and the addition of graphene oxide. The growth of the hexagonal disks and hexapods is mainly due to a series of phase and structural transformations. The α-FeOOH/rGO displays superior anode performance with a high reversible specific capacity of 569 mA h g−1 at the 50th cycle.
Introduction
The chemical and physical properties of inorganic micro-/nanostructures are closely interrelated with their chemical composition, size, phase, surface chemistry, shape, and dimensionality.1–4 Therefore, great efforts have been devoted to exploit these factors to develop micro-/nanostructure electrode materials for advanced applications such as lithium ion battery (LIB) applications, etc.5–8 Numerous approaches including molten-salt synthesis, hydrothermal process, template-direct growth, etc. have been pursued in preparation of advanced electrode materials.3,9–11 Among these approaches, the hydrothermal method has proven to be an effective, scalable, and environmentally friendly approach in preparing various inorganic materials with tunable size, morphologies, and phases.12–14 Meanwhile, enhanced performance of electrode materials for LIBs has been reported by attaching metal oxide nanoparticles onto graphene sheets.5,7,15–18 Due to their high electrical conductivity and high surface-to-volume ratio, graphene sheets are considered as the scaffolds to facilitate the charge transfer and maintain the electrical contact between active materials and current collectors, which led to improvement of the specific capacities and cycling stabilities. Many of the reported works show heterogeneous growth of nanoparticles onto reduced graphene oxide (rGO) sheets, however, the detailed interaction between graphene sheets and active materials during the growth is still ambiguous.5,7,19–21 For example, it was shown that graphene sheets can serve as epitaxial templates during the growth of Au, which changed the Au crystal structure from face-centered cubic (fcc) to hexagonal close-packed (hcp).22 It would be interesting to investigate how the graphene sheets can serve as special “surfactant” to tailor the size and morphology of the redox-active materials and in turn affect their electrochemical properties.Although the theoretical specific capacity of α-FeOOH is predicted to be as high as 905 mA h g−1, there are only few reports on α-FeOOH as LIB anode materials.23 Herein, we report a facile hydrothermal process to synthesize α-FeOOH onto rGO sheets. The synthesized α-FeOOH/rGO samples are of either hexagonal-disks or hexapod α-FeOOH crystals, while only randomly shaped α-FeOOH clusters are formed without the presence of graphene sheets. The effect of other parameters such as reaction time and Fe3+ concentration on the growth of α-FeOOH is also investigated. The electrochemical characterization shows that such α-FeOOH/rGO hybrid can deliver a highly reversible specific capacity of 569 mA h g−1 at the 50th cycle with a current density of 100 mA g−1.
Results and discussion
Phase structure, morphology, and formation process
The synthesized sample from the hydrothermal process (180 °C for 24 h) with 0.0143 M Fe3+ in the precursor and a weight ratio of RFeCl3:GO = FeCl3![[thin space (1/6-em)]](https://www.rsc.org/images/entities/char_2009.gif) :
:![[thin space (1/6-em)]](https://www.rsc.org/images/entities/char_2009.gif) GO = 16.2 was characterized by an XRD pattern and is shown in Fig. 1. All the diffraction peaks can be well indexed to the orthorhombic phase of α-FeOOH (JCPDS no. 81-0464, space group: pbnm, no. 62).24,25 The α-FeOOH has a goethite structure which consisted of infinite chains of FeO6 octahedra linked by hydrogen bonds. There is no detectable peak from impurity phases, thus indicating the formation of a pure α-FeOOH phase under aforementioned experimental conditions. Additionally, the strong and sharp diffraction peaks in the XRD pattern indicate that the synthesized FeOOH/rGO sample is well crystallized with large grain size (935 nm using the Scherrer equation). Moreover, the EDX spectrum (Fig. S1, ESI†) further confirms the presence of Fe, O, and C elements in the as-prepared FeOOH/rGO sample. The reduction of the graphene oxide (GO) to reduced graphene oxide (rGO) through the hydrothermal process was confirmed by Raman spectroscopy (Fig. S2, ESI†). An increase in the intensity ratio of the D band locating at 1352 cm−1 to the G band locating at 1585 cm−1 is observed, e.g. ID/IG, from 0.96 to 1.18 upon the reduction of GO through the hydrothermal process. This result is consistent with the previous reports.5,26,27
GO = 16.2 was characterized by an XRD pattern and is shown in Fig. 1. All the diffraction peaks can be well indexed to the orthorhombic phase of α-FeOOH (JCPDS no. 81-0464, space group: pbnm, no. 62).24,25 The α-FeOOH has a goethite structure which consisted of infinite chains of FeO6 octahedra linked by hydrogen bonds. There is no detectable peak from impurity phases, thus indicating the formation of a pure α-FeOOH phase under aforementioned experimental conditions. Additionally, the strong and sharp diffraction peaks in the XRD pattern indicate that the synthesized FeOOH/rGO sample is well crystallized with large grain size (935 nm using the Scherrer equation). Moreover, the EDX spectrum (Fig. S1, ESI†) further confirms the presence of Fe, O, and C elements in the as-prepared FeOOH/rGO sample. The reduction of the graphene oxide (GO) to reduced graphene oxide (rGO) through the hydrothermal process was confirmed by Raman spectroscopy (Fig. S2, ESI†). An increase in the intensity ratio of the D band locating at 1352 cm−1 to the G band locating at 1585 cm−1 is observed, e.g. ID/IG, from 0.96 to 1.18 upon the reduction of GO through the hydrothermal process. This result is consistent with the previous reports.5,26,27
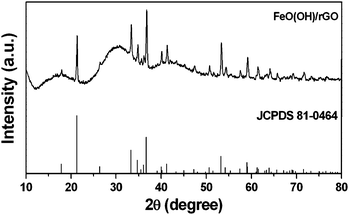 | ||
| Fig. 1 XRD pattern of the α-FeOOH/rGO sample prepared at 180 °C for 24 h and the standard data of iron oxyhydroxide (JCPDS 81-0464) as reference. | ||
Fig. 2 shows the SEM and TEM images of the as-obtained FeOOH/rGO hybrid samples. The low- and high-magnification SEM images (Fig. 2a and b) show that uniform hexagonal disks with smooth surface are wrapped by the graphene sheets. The diameter of the hexagonal disks is about 1 μm and the thickness is 300 nm with interesting asterisk (*) shape at the top/bottom surface. The TEM images of the FeOOH/rGO hybrids are shown in Fig. 2c and d, which further confirm the hexagonal structure. The corresponding HRTEM image (Fig. 2e) shows that the FeOOH hexagonal disk is single crystalline. The observed interplanar distances of 0.245 and 0.269 nm correspond to the (111) and (130) planes of FeOOH, respectively.
 | ||
| Fig. 2 SEM (a and b), TEM (c and d), and HRTEM (e) images of the as-prepared α-FeOOH/rGO sample (180 °C, 24 h, the concentration of Fe3+ is 0.0143 M). | ||
GO is noted to play an important role in controlling the morphology of the final α-FeOOH crystals. Without the addition of GOs, the sample is composed of irregular clusters with a broad size distribution (e.g. >5 μm) as shown in the SEM image (Fig. S3, ESI†). The XRD pattern reveals that these random-shaped clusters are likely formed through the agglomeration of many α-FeOOH and small amount of β-FeOOH caused by the incomplete phase transformation. Some separated hexapod shaped α-FeOOH crystals are also observed with the diameter of 5–6 μm, which is much larger than the α-FeOOH/rGO hybrids prepared by a similar hydrothermal process. This result demonstrates that the graphene sheets serve as special “surfactant” to tailor the size and morphology of the α-FeOOH crystals and effectively prevent their agglomeration.
The size and morphology of α-FeOOH/rGO are also dependent on the concentration of Fe3+ ions in the precursors. When the concentration of Fe3+ increases to 0.0286 M (RFeCl3:GO = 42.4), there is a significant change in the size and shape of α-FeOOH compared to samples prepared at lower Fe3+ concentration (e.g. 0.0143 M). The SEM and TEM images (Fig. 3) show that hexapods with short arms and smooth surfaces are dispersed in the graphene sheets. The diameter of the hexapods is ∼2 μm and the thickness is ∼700 nm, which are much larger than those of hexagonal disks.
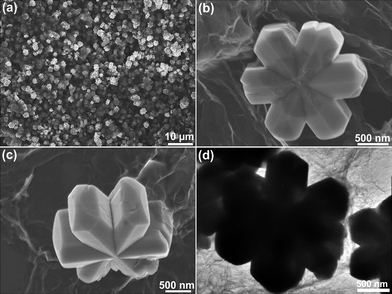 | ||
| Fig. 3 SEM (a–c) and TEM (d) images of the as-prepared α-FeOOH/rGO sample (180 °C, 24 h, the concentration of Fe3+ is 0.0286 M). | ||
TGA was used to investigate the rGO composite in the α-FeOOH/rGO hybrid samples. TGA curves (Fig. 4) indicate a slight weight loss below 100 °C which is attributed to detachment of the physically adsorbed water or ethanol. An another obvious weight loss at 200–320 °C is ascribed to the decomposition of α-FeOOH, while the weight loss at 320–567 °C indicates the percentage losses of rGO in α-FeOOH/rGO hybrids.7,28 Based on the total weight loss, the rGO contents in hexagonal and hexapod α-FeOOH/rGO samples are estimated to be 14.0 wt% and 6.9 wt%, respectively.
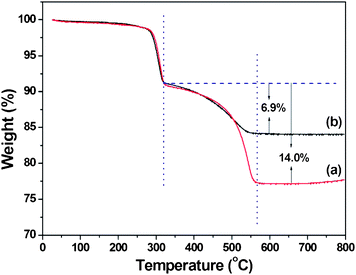 | ||
| Fig. 4 TGA curves of the as-prepared hexagonal-disk α-FeOOH/rGO (a) and hexapod α-FeOOH/rGO (b). The TGA was performed in air with a heating rate of 10 °C min−1. | ||
To investigate the growth progression of FeOOH/rGO hybrid samples, time-dependent experiments were performed (at 180 °C with 0.5 mmol Fe3+ in the precursor). Fig. 5 shows the XRD patterns of the sample obtained at different reaction times. The XRD pattern of the sample obtained after 0.5 hour shows a broad and weak band at the 2θ range of 18–35°, indicating an amorphous sample consisting of uniform nanoparticles with the size of about 80 nm (Fig. 6a and b) dispersed in the graphene sheets. When the reaction time extends to 1.0 hour, several weak diffraction peaks appear in the XRD pattern, which can be indexed to tetragonal iron oxide hydrate (β-FeOOH, JCPDS no. 34-1266, space group: I4/m, no. 87). The SEM image (Fig. 6c) shows that the β-FeOOH are cubes with a size of 0.7–1 μm. After 2.0 hours of hydrothermal reaction, besides the intense diffraction peaks of β-FeOOH, some weak peaks of α-FeOOH are observed as labeled by the blue marks in Fig. 5c. The corresponding SEM image analysis (Fig. 6d) shows that the α-FeOOH are hexagonal disks with the diameter of 500 nm. The results indicate that phase transformation from β-FeOOH to α-FeOOH occurs between 1 and 2 hours of the reaction. When the reaction time increases to 6.0 hours, the diffraction peaks of β-FeOOH disappear and only peaks of α-FeOOH (JCPDS no. 81-0464) are observed (Fig. 5d). In the corresponding SEM image (Fig. 6e), it can be seen that the β-FeOOH cubes disappeared while only uniform α-FeOOH hexagonal disks with a size of ∼600 nm are observed. Further extending the reaction time to 12 hours, only α-FeOOH hexagonal disks can be obtained (Fig. 5e) with the diameter and thickness of 700–800 nm and 250 nm (Fig. 6f), respectively.
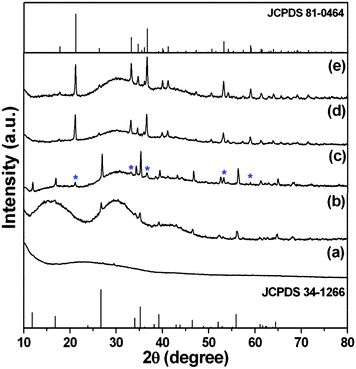 | ||
| Fig. 5 XRD patterns of as-synthesized FeOOH/rGO samples at 180 °C at different reaction times: (a) 0.5 hour, (b) 1.0 hour, (c) 2.0 hours, (d) 6.0 hours, and (e) 12.0 hours. | ||
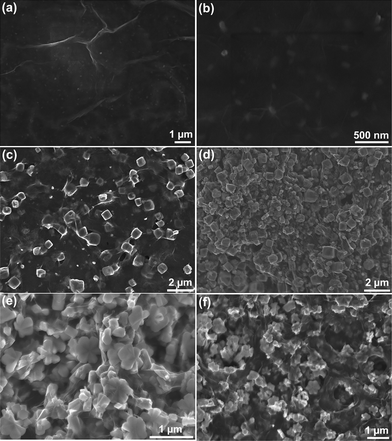 | ||
| Fig. 6 SEM images of the as-synthesized FeOOH/rGO samples at 180 °C at different reaction times: (a and b) 0.5 hour, (c), 1.0 hour, (d), 2.0 hours, (e), 6.0 hours, and (f) 12.0 hours. | ||
The above observations are also confirmed by FT-IR spectra shown in Fig. 7. The FT-IR spectrum of the sample after one hour hydrothermal reaction shows an intense absorption band at 3178 cm−1 (Fig. 7a), which is attributed to the characteristic vibrations of the FeO–(OH) bond.28,29 The absorption peaks at 489, 693, and 837 cm−1 are assigned to the Fe–O vibrational modes in β-FeOOH.30 These experimental results demonstrate that β-FeOOH is obtained. For the sample obtained after 2 hours hydrothermal reaction, besides the typical bands of β-FeOOH, the presence of a broad band at 891 cm−1 with a shoulder at 795 cm−1 and a weak band at 624 cm−1 is ascribed to Fe–O–H bending vibrations and Fe–O stretching vibrations of goethite α-FeOOH, respectively,31,32 thus indicating the presence of the α-FeOOH phase. When the reaction time increases to >6 hours, the observed strong band at 3133 cm−1 is due to the presence of the O–H stretching mode in α-FeOOH, whereas the shoulder at 3471 cm−1 can be ascribed to stretching modes of surface H2O molecules or to the envelope of hydrogen-bonded surface OH groups.33 Two typical bands of goethite at 889 and 795 cm−1 can be ascribed to Fe–O–H bending vibrations in α-FeOOH. The Fe–O stretching vibrations are responsible for the bands at 628 and 472 cm−1.34 Accordingly, it can be concluded that the conversion from β-FeOOH to α-FeOOH crystals begins after about 1 hour reaction and pure α-FeOOH sample can be obtained after 6 hours of the hydrothermal process.
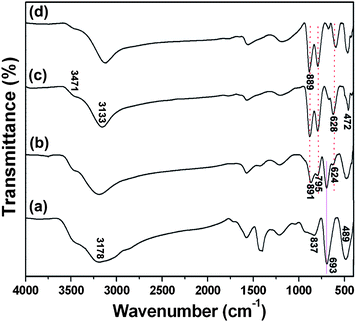 | ||
| Fig. 7 FT-IR spectra of FeOOH/rGO samples synthesized at 180 °C at different reaction times: (a) 1.0 hour, (b) 2.0 hours, (c) 6.0 hours, and (d) 24 hours. | ||
Based on the above results, the formation mechanism of the α-FeOOH hexagonal disks is believed to involve a series of phase and structural transformations, which is summarized as follows. (a) Amorphous and well dispersed nanoparticles will grow first on the graphene oxide sheets after 0.5 hour. At this stage, the functional groups (such as carboxylic and hydroxyl groups) on the graphene surface act as the active seeding sites to initiate the nucleation of FeOOH.7 (b) As the reaction continues, the FeOOH nanoparticles further grow and crystallize to form cubic β-FeOOH. (c) The β-FeOOH crystals are transformed to α-FeOOH through the dissolution/re-crystallization process, which is consistent with other previous report.35 (d) When the reaction time extends further, hexagonal disks are formed as the preferred growth along [10![[1 with combining macron]](https://www.rsc.org/images/entities/char_0031_0304.gif) 0]. Generally, in hexagonal structures, the surfaces typically consisted of {0001} top/bottom planes and six energetically equivalent {10
0]. Generally, in hexagonal structures, the surfaces typically consisted of {0001} top/bottom planes and six energetically equivalent {10![[1 with combining macron]](https://www.rsc.org/images/entities/char_0031_0304.gif) 0} family of prismatic side planes (Fig. S4, ESI†). During the crystal growth of α-FeOOH, graphene sheets are selectively adsorbed strongly onto the {0001} surfaces due to the presence of carboxylic and hydroxyl groups on the graphene surface, which remarkably prohibits the {0001} directed growth and promotes the crystal growth mainly along [10
0} family of prismatic side planes (Fig. S4, ESI†). During the crystal growth of α-FeOOH, graphene sheets are selectively adsorbed strongly onto the {0001} surfaces due to the presence of carboxylic and hydroxyl groups on the graphene surface, which remarkably prohibits the {0001} directed growth and promotes the crystal growth mainly along [10![[1 with combining macron]](https://www.rsc.org/images/entities/char_0031_0304.gif) 0].36 A schematic illustration for the formation of α-FeOOH hexagonal disks is presented in Scheme 1 according to the above explanation. Moreover, at higher ratio of Fe3+ to GOs, the hexapods are formed through preferred growth along the special crystallographic direction. During the process with higher concentration of Fe3+ ions, the formation process is assumed to be divided into two steps. Firstly, the hexagonal disks were formed through a series of phase and structural transformations. Subsequently, the hexagonal disks underwent a further crystal growth process along the crystallographically oriented directions that are perpendicular to the {10
0].36 A schematic illustration for the formation of α-FeOOH hexagonal disks is presented in Scheme 1 according to the above explanation. Moreover, at higher ratio of Fe3+ to GOs, the hexapods are formed through preferred growth along the special crystallographic direction. During the process with higher concentration of Fe3+ ions, the formation process is assumed to be divided into two steps. Firstly, the hexagonal disks were formed through a series of phase and structural transformations. Subsequently, the hexagonal disks underwent a further crystal growth process along the crystallographically oriented directions that are perpendicular to the {10![[1 with combining macron]](https://www.rsc.org/images/entities/char_0031_0304.gif) 0} planes. This results in a micro-rod arrays architecture of six-fold symmetry.
0} planes. This results in a micro-rod arrays architecture of six-fold symmetry.
 | ||
| Scheme 1 Schematic illustration for the growth of α-FeOOH hexagonal disks on graphene oxide sheets. | ||
Lithium-ion battery performance
The α-FeOOH/rGO hybrid samples were tested as lithium-ion battery anode materials. A series of electrochemical measurements were performed. Working electrodes were prepared by a mixture of hexagonal-disk α-FeOOH/rGO sample, carbon black, and polyvinyl difluoride (PVDF) at the weight ratio of 8![[thin space (1/6-em)]](https://www.rsc.org/images/entities/char_2009.gif) :
:![[thin space (1/6-em)]](https://www.rsc.org/images/entities/char_2009.gif) 1
1![[thin space (1/6-em)]](https://www.rsc.org/images/entities/char_2009.gif) :
:![[thin space (1/6-em)]](https://www.rsc.org/images/entities/char_2009.gif) 1. Cyclic voltammograms (CVs) of the α-FeOOH/rGO electrode at a scan rate of 0.5 mV s−1 are shown in Fig. 8. During the first cycle, an intense cathodic peak is observed at 0.50 V, which is attributed to initial lithium insertion into the crystal structure and reduction of Fe3+/Fe2+ to Fe0. Meanwhile, a broad anodic peak is present at 1.98 V, corresponding to the oxidation of Fe0 to Fe3+/Fe2+.37,38 In the subsequent cycles, the anodic peak shifts to higher potentials with a decrease in peak intensity, while the cathodic peak only shows a decrease in peak intensity, revealing some irreversible reaction.39
1. Cyclic voltammograms (CVs) of the α-FeOOH/rGO electrode at a scan rate of 0.5 mV s−1 are shown in Fig. 8. During the first cycle, an intense cathodic peak is observed at 0.50 V, which is attributed to initial lithium insertion into the crystal structure and reduction of Fe3+/Fe2+ to Fe0. Meanwhile, a broad anodic peak is present at 1.98 V, corresponding to the oxidation of Fe0 to Fe3+/Fe2+.37,38 In the subsequent cycles, the anodic peak shifts to higher potentials with a decrease in peak intensity, while the cathodic peak only shows a decrease in peak intensity, revealing some irreversible reaction.39
 | ||
| Fig. 8 Cyclic voltammograms (CV) of hexagonal-disk α-FeOOH/rGO electrode for the first, second, and third cycles at a scan rate of 0.5 mV s−1 with a voltage window of 0–3 V. | ||
Fig. 9a shows the charge/discharge voltage profiles of hexagonal-disk α-FeOOH/rGO electrode at a current density of 100 mA g−1 and a voltage range between 0.005 and 3.0 V vs. Li+/Li. A voltage plateau at 0.88 V for the first discharge process is observed corresponding to the reduction of Fe3+ to Fe0via reaction: α-FeOOH + 3Li+ + 3e−− ↔ Fe + LiOH + Li2O.23 The small plateau at 1.56 V in the first discharge step is attributed to the lithium intercalation.23,40 The first discharge and charge capacities are 1357 mA h g−1 and 1004 mA h g−1, respectively, resulting in a coulombic efficiency of 74.0%. The low coulombic efficiency is mainly attributed to the incomplete conversion reaction and irreversible lithium loss due to the formation of a solid electrolyte interface film during the first cycle. During the second cycle, the discharge and charge capacities are 1001 and 907 mA h g−1, respectively, which lead to a higher coulombic efficiency of 90.6%. In the subsequent cycles, the coulombic efficiency continues to increase and finally maintains at about 98% (Fig. S5, ESI†). The cycling response (Fig. 9b) of hexagonal-disk α-FeOOH/rGO electrode was tested at a current density of 100 mA g−1 in the range of 0.005–3 V. The discharge capacity gradually decreases to 569 mA h g−1 at the 50th cycle, which is still better than the previous report (e.g. 500 mA h g−1 at 20th cycle).23 For comparison purpose, the cycling response was also tested with the same current density and voltage range on the electrode made from pure α-FeOOH clusters as shown in Fig. 9b. The pure α-FeOOH electrode shows an initial discharge capacity of 1158 mA h g−1 and decreases sharply to 75 mA h g−1 at the 50th cycle. In addition, the lithium storage capacity of pure reduced graphene oxide was measured for comparison, as shown in Fig. S6 (ESI†). The discharge capacities of pure reduced graphene oxide are 430 mA h g−1 at the first cycle and 349 mA h g−1 at the 50th cycle. Considering the 14.0 wt% rGO in the α-FeOOH/rGO sample, one can estimate that the direct contribution of ∼49 mA h g−1 is from rGO. The stable lithium storage capacity of the rGO-supported FeOOH is mainly due to the rGO providing a conductive scaffold to maintain the reliable contact between electrodes and current collectors during the charge/discharge process.5,15,17 Specific capacities of the α-FeOOH/rGO electrode were tested at different current densities as shown Fig. 10. At the 10th cycle, the specific capacities are 387, 285, 134 and 81 mA h g−1 at current densities of 200, 500, 1000 and 1500 mA g−1, respectively. After cycling at a current density of 1500 mA g−1, the specific capacities of the α-FeOOH/rGO electrode can gradually recover back to ∼450 mA h g−1 when the current density changes back to 100 mA g−1, indicating an acceptable performance.
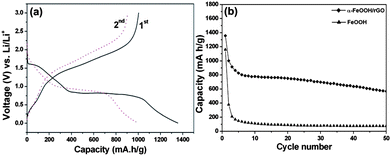 | ||
| Fig. 9 (a) Charge–discharge voltage profiles of hexagonal-disk α-FeOOH/rGO electrode at the first and second cycles at a current density of 100 mA g−1. (b) Cycling performance of hexagonal-disk α-FeOOH/rGO and pure FeOOH electrodes at the current density of 100 mA g−1. | ||
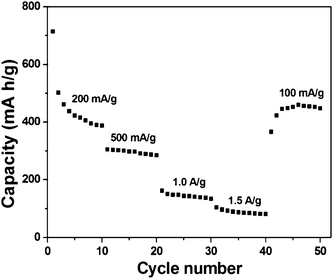 | ||
| Fig. 10 Cycling responses of hexagonal-disk α-FeOOH/rGO electrode between 0.005 and 3.0 V at different current densities. | ||
We also measured the lithium storage properties of the as-synthesized hexapods α-FeOOH/rGO sample at a current density of 100 mA g−1, which is shown in Fig. S7 (ESI†). The hexapods α-FeOOH/rGO electrode depicts a high discharge capacity of 1526 mA h g−1 at the first cycle, which is mainly attributed to the formation of a solid electrolyte interface film.41 The discharge capacity gradually decreases to 610 mA h g−1 at 50th cycle, which is slightly higher than that of the hexagonal α-FeOOH/rGO sample (569 mA h g−1). This is mainly due to the higher FeOOH content in the hexapods α-FeOOH/rGO sample as compared to that of the hexagonal-disk α-FeOOH/rGO sample as revealed by the TGA results.
Conclusion
A simple approach to synthesize the α-FeOOH/rGO hybrids with hexagonal-disk and hexapod morphology has been successfully demonstrated. The morphology and size can be controlled by varying the reaction time, Fe3+ concentration, and the precursor weight ratio of the FeCl3 to graphene oxides. Phase transformation from tetragonal β-FeOOH to orthorhombic α-FeOOH is observed during the growth process. As anode materials for lithium-ion battery, the α-FeOOH/rGO hybrids exhibit superior Li storage performance with high specific capacities and good cycling stabilities. This study demonstrates that the graphene sheets can act as effective surfactants to direct the growth of inorganic nanocrystals to achieve desired hybrid materials.Experimental
Chemicals and materials
Ferric chloride (FeCl3), ammonium fluoride (NH4F), hydrogen peroxide (H2O2, 30%), sulfuric acid (H2SO4, 98%), phosphorus pentoxide (P2O5, 97%), potassium persulfate (K2S2O8), chlorohydric acid (HCl, 37%), and potassium permanganate (KMnO4) were purchased from Aldrich. Natural graphite was obtained from Bay Carbon (Bay City, Michigan) to synthesize graphene oxide (GO). All the materials were used without further purification. Millipore de-ionized (DI) water was used in all experiments.Synthesis of graphene oxide (GO)
Graphite oxide was prepared from natural graphite by a modified Hummer's method.5,42,43 In a typical procedure, 6 mL of concentrated H2SO4 (98%), 1.25 g of K2S2O8, and 1.25 g of P2O5 were added into a three-necked flask under stirring. Then, 1.5 g of graphite powder was added into the above solution and the mixture was maintained at 80 °C for 4.5 h. The resulting pre-oxidized product was cooled to room temperature and washed with DI water to remove the residual acid. The as-obtained product was then dried in a vacuum oven at 50 °C for 12 h. Next, the pre-oxidized graphite was put into 60 mL concentrated H2SO4 in an ice bath, and then 7.5 g of KMnO4 was slowly added under vigorous stirring. The reaction temperature was kept below 20 °C. Once all KMnO4 has been added, the mixture was stirred at 35 °C for 2 h followed by addition of 125 mL of DI water in an ice bath to avoid overheating due to the dilution process. After stirring for 2 h, an additional 200 mL of DI water and 10 mL of H2O2 (30%) were slowly added into the mixed solution. The resulting mixture was washed with dilute HCl aqueous solution (1/10, v/v) and DI water. Graphite oxide was finally obtained after drying in a vacuum oven at 35 °C.Synthesis of FeOOH/reduced graphene oxide (rGO)
The FeOOH/rGO and pure FeOOH microcrystals were prepared by a simple hydrothermal process. In a typical procedure, 5 mg of GO was dispersed in 35 mL DI water by ultrasonication to obtain GO aqueous solution. Then, 0.5 mmol of FeCl3 was dissolved into the above solution to give a Fe3+ concentration of 0.0143 M (weight ratio of RFeCl3:GO = FeCl3![[thin space (1/6-em)]](https://www.rsc.org/images/entities/char_2009.gif) :
:![[thin space (1/6-em)]](https://www.rsc.org/images/entities/char_2009.gif) GO = 16.2). After ultrasonication for another 20 min, 24 mmol of NH4F was added into the above solution. The mixture was then stirred for 10 min and was transferred into a 50 mL Teflon-lined autoclave and maintained at 180 °C for 24 hours. When cooled to room temperature, the precipitate was collected by centrifugation, washed with DI water and ethanol in sequence, and dried at 70 °C for 12 h. Additionally, hydrothermal treatment in the absence of GO, various Fe3+ concentrations, and different reaction times was also carried out to investigate their effects on the morphology of the sample and their electrochemical properties.
GO = 16.2). After ultrasonication for another 20 min, 24 mmol of NH4F was added into the above solution. The mixture was then stirred for 10 min and was transferred into a 50 mL Teflon-lined autoclave and maintained at 180 °C for 24 hours. When cooled to room temperature, the precipitate was collected by centrifugation, washed with DI water and ethanol in sequence, and dried at 70 °C for 12 h. Additionally, hydrothermal treatment in the absence of GO, various Fe3+ concentrations, and different reaction times was also carried out to investigate their effects on the morphology of the sample and their electrochemical properties.
Characterization
X-Ray powder diffraction (XRD) measurements were performed on a Scintag PAD-V X-ray diffractometer using Cu Kα irradiation (λ = 0.15406 nm) at a scan rate of 1° s−1 with a range of 10–80°. The morphology of the samples was investigated using a field-emission scanning electron microscopy (FESEM) system (JEOL, model JSM-7600F) and the structures were characterized by using a transmission electron microscopy (TEM) system (JEOL, Model JEM-2100) operating at 200 kV. Raman spectra were acquired by using a WITec CRM200 confocal Raman microscopy system with a laser wavelength of 488 nm and a spot size of 0.5 mm. Thermogravimetry analysis (TGA, Q500) was carried out in the temperature range of 28 to 800 °C at a heating rate of 10 °C min−1 in air. FT-IR spectra were recorded on a Fourier transform infrared spectrometer (Perkin-Elmer) with a DGTS detector.Electrochemical measurements
80 wt% active material (α-FeOOH/rGO or FeOOH), 10 wt% acetylene black (Super-P), and 10 wt% polyvinyl difluoride (PVDF) binder were mixed into N-methyl-2-pyrrolidinone (NMP) solvent. The resulting mixture was then pasted onto Cu foil disks to form working electrodes and dried in vacuum at 60 °C for 24 h to remove the solvent. Electrochemical measurements were carried out on the CR2032 (3 V) coin-type cells44 with lithium metal as the counter/reference electrode, Celgard 2400 membrane as the separator, and electrolyte solution obtained by dissolving 1 M LiPF6 into a mixture of ethylene carbonate (EC) and dimethyl carbonate (DMC) (EC/DMC, 50![[thin space (1/6-em)]](https://www.rsc.org/images/entities/char_2009.gif) :
:![[thin space (1/6-em)]](https://www.rsc.org/images/entities/char_2009.gif) 50 wt/wt). The coin cells were assembled in an argon-filled glove box where both moisture and oxygen levels were less than 1.0 ppm. The cell was tested on a NEWARE multi-channel battery system with charge and discharge in the voltage range of 0.005–3.0 V. Cyclic voltammetry (CV; 0.01–3.0 V, 0.5 mV s−1) was performed with an electrochemical workstation (CHI 660C).
50 wt/wt). The coin cells were assembled in an argon-filled glove box where both moisture and oxygen levels were less than 1.0 ppm. The cell was tested on a NEWARE multi-channel battery system with charge and discharge in the voltage range of 0.005–3.0 V. Cyclic voltammetry (CV; 0.01–3.0 V, 0.5 mV s−1) was performed with an electrochemical workstation (CHI 660C).
Acknowledgements
The authors gratefully acknowledge AcRF Tier 1 RG 31/08 of MOE (Singapore), NRF2009EWT-CERP001-026 (Singapore), Singapore Ministry of Education (MOE2010-T2-1-017), A*STAR SERC grant 1021700144 and Singapore MPA 23/04.15.03 RDP 009/10/102 and MPA 23/04.15.03 RDP 020/10/113 grant.References
- Y. W. Jun, J. S. Choi and J. Cheon, Angew. Chem., Int. Ed., 2006, 45, 3414–3439 CrossRef CAS.
- Y. Ding, S. H. Yu, C. Liu and Z. A. Zang, Chem.–Eur. J., 2007, 13, 746–753 CrossRef CAS.
- A. M. Cao, J. S. Hu, H. P. Liang and L. J. Wan, Angew. Chem., Int. Ed., 2005, 44, 4391–4395 CrossRef CAS.
- F. Y. Cheng, J. Liang, Z. L. Tao and J. Chen, Adv. Mater., 2011, 23, 1695–1715 CrossRef CAS.
- J. X. Zhu, Y. K. Sharma, Z. Y. Zeng, X. J. Zhang, M. Srinivasan, S. Mhaisalkar, H. Zhang, H. H. Hng and Q. Y. Yan, J. Phys. Chem. C, 2011, 115, 8400–8406 CAS.
- S. Saadat, Y. Y. Tay, J. X. Zhu, P. F. Teh, S. Maleksaeedi, M. M. Shahjamali, M. Shakerzadeh, M. Srinivasan, B. Y. Tay, H. H. Hng, J. Ma and Q. Y. Yan, Chem. Mater., 2011, 23, 1032–1038 CrossRef CAS.
- N. Li, G. Liu, C. Zhen, F. Li, L. L. Zhang and H. M. Cheng, Adv. Funct. Mater., 2011, 21, 1717–1722 CrossRef CAS.
- J. G. Kim, S. H. Nam, S. H. Lee, S. M. Choi and W. B. Kim, ACS Appl. Mater. Interfaces, 2011, 3, 828–835 CAS.
- M. F. Hassan, M. M. Rahman, Z. P. Guo, Z. X. Chen and H. K. Liu, J. Mater. Chem., 2010, 20, 9707–9712 RSC.
- G. L. Wang, J. C. Huang, S. L. Chen, Y. Y. Gao and D. X. Cao, J. Power Sources, 2011, 196, 5756–5760 CrossRef CAS.
- X. Duan, Y. Huang, Y. Cui, J. Wang and C. M. Lieber, Nature, 2001, 409, 66–69 CrossRef CAS.
- Z. G. Lu, H. L. Chen, R. Robert, B. Y. X. Zhu, J. Q. Deng, L. J. Wu, C. Y. Chung and C. P. Grey, Chem. Mater., 2011, 23, 2848–2859 CrossRef CAS.
- Y. Wang, Q. S. Zhu, L. Tao and X. W. Su, J. Mater. Chem., 2011, 21, 9248–9254 RSC.
- J. X. Zhu, T. Sun, H. H. Hng, J. Ma, F. Y. C. Boey, X. W. Lou, H. Zhang, C. Xue, H. Y. Chen and Q. Y. Yan, Chem. Mater., 2009, 21, 3848–3852 CrossRef CAS.
- H. Wang, L. F. Cui, Y. Yang, H. S. Casalongue, J. T. Robinson, Y. Liang, Y. Cui and H. J. Dai, J. Am. Chem. Soc., 2010, 132, 13978–13980 CrossRef CAS.
- B. Wang, X. L. Wu, C. Y. Shu, Y. G. Guo and C. R. Wang, J. Mater. Chem., 2010, 20, 10661–10664 RSC.
- D. H. Wang, D. W. Choi, J. Li, Z. G. Yang, Z. M. Nie, R. Kou, D. H. Hu, C. M. Wang, L. V. Saraf, J. G. Zhang, I. A. Aksay and J. Liu, ACS Nano, 2009, 3, 907–914 CrossRef CAS.
- D. H. Wang, R. Kou, D. Choi, Z. G. Yang, Z. M. Nie, J. Li, L. V. Saraf, D. H. Hu, J. G. Zhang, G. L. Graff, J. Liu, M. A. Pope and I. A. Aksay, ACS Nano, 2010, 4, 1587–1595 CrossRef CAS.
- S. Yang, X. Feng, S. Ivanovici and K. Müllen, Angew. Chem., Int. Ed., 2010, 49, 8408–8411 CrossRef CAS.
- G. Zhou, D. W. Wang, F. Li, L. Zhang, N. Li, Z. S. Wu, L. Wen, G. Q. Lu and H. M. Cheng, Chem. Mater., 2010, 22, 5306–5313 CrossRef CAS.
- W. H. Shi, J. X. Zhu, D. H. Sim, Y. Y. Tay, Z. Y. Lu, X. J. Zhang, Y. Sharma, M. Srinivasan, H. Zhang, H. H. Hng and Q. Y. Yan, J. Mater. Chem., 2011, 21, 3422–3427 RSC.
- X. Huang, S. Z. Li, Y. Z. Huang, S. X. Wu, X. Z. Zhou, S. Z. Li, C. L. Gan, F. Boey, C. A. Mirkin and H. Zhang, Nat. Commun., 2011, 2, 292 CrossRef.
- X. M. Lou, X. Z. Wu and Y. X. Zhang, Electrochem. Commun., 2009, 11, 1696–1699 CrossRef CAS.
- C. M. Flynn, Jr, Chem. Rev., 1984, 84, 31–41 CrossRef.
- N. H. de Leeuw and T. G. Cooper, Geochim. Cosmochim. Acta, 2007, 71, 1655–1673 CrossRef CAS.
- S. Stankovich, D. A. Dikin, R. D. Piner, K. A. Kohlhaas, A. Kleinhammes, Y. Jia, Y. Wu, S. T. Nguyen and R. S. Ruoff, Carbon, 2007, 45, 1558–1565 CrossRef CAS.
- H. Li, W. Li, Y. J. Zhang, T. S. Wang, B. Wang, W. Xu, L. Jiang, W. G. Song, C. Y. Shu and C. R. Wang, J. Mater. Chem., 2011, 21, 7878–7881 RSC.
- Z. Y. Zhong, J. Ho, J. Teo, S. C. Shen and A. Gedanken, Chem. Mater., 2007, 19, 4776–4782 CrossRef CAS.
- G. Tong, J. Guan and Q. Zhang, Mater. Chem. Phys., 2007, 127, 371–378 CrossRef.
- C. Wei and Z. Nan, Mater. Chem. Phys., 2011, 127, 220–226 CrossRef CAS.
- J. Liang, M. Luo, C. Yang, J. Fang and L. Li, Cryst. Res. Technol., 2011, 46, 493–496 CrossRef CAS.
- S. Deki, Y. Aoi, J. Okibe, H. Yanagimoto, A. Kajinami and M. Mizuhata, J. Mater. Chem., 1997, 7, 1769–1772 RSC.
- C. Morterra, A. Chiorino and E. Borello, Mater. Chem. Phys., 1984, 10, 119–138 CrossRef CAS.
- S. Krehula, S. Popović and S. Musić, Mater. Lett., 2002, 54, 108–113 CrossRef CAS.
- M. Žic, M. Ristić and S. Musić, J. Mol. Struct., 2009, 924–926, 235–242 Search PubMed.
- S. H. Jiao, L. F. Xu, K. L. Hu, J. J. Li, S. Gao and D. S. Xu, J. Phys. Chem. C, 2010, 114, 269–273 CAS.
- T. Zhu, J. S. Chen and X. W. Lou, J. Phys. Chem. C, 2011, 115, 9814–9820 CAS.
- S. L. Jin, H. G. Deng, D. H. Long, X. J. Liu, L. Zhan, X. Y. Liang, W. M. Qiao and L. C. Ling, J. Power Sources, 2011, 196, 3887–3893 CrossRef CAS.
- J. Chen, L. N. Xu, W. Y. Li and X. L. Guo, Adv. Mater., 2005, 17, 582–586 CrossRef CAS.
- J. Rose, M. M. Cortalezzi-Fidalgo, S. Moustier, C. Magnetto, C. D. Jones, A. R. Barron, M. R. Wiesner and J. Y. Bottero, Chem. Mater., 2002, 14, 621–628 CrossRef CAS.
- J. X. Zhu, T. Zhu, X. Z. Zhou, Y. Y. Zhang, X. W. Lou, X. D. Chen, H. Zhang, H. H. Hng and Q. Y. Yan, Nanoscale, 2011, 3, 1084–1089 RSC.
- Y. X. Xu, H. Bai, G. W. Lu, C. Li and G. Q. Shi, J. Am. Chem. Soc., 2008, 130, 5856–5857 CrossRef CAS.
- X. Z. Zhou, X. Huang, X. Y. Qi, S. X. Wu, C. Xue, F. Y. C. Boey, Q. Y. Yan, P. Chen and H. Zhang, J. Phys. Chem. C, 2009, 113, 10842–10846 CAS.
- J. Zhu, Z. Lu, M. O. Oo, H. H. Hng, J. Ma, H. Zhang and Q. Yan, J. Mater. Chem., 2011, 21, 12770–12776 RSC.
Footnote |
| † Electronic supplementary information (ESI) available: EDX, Raman spectra, XRD, SEM, schematic diagram, Coulombic efficiency, and cycling performance of the as-obtained products. See DOI: 10.1039/c1ce05965c |
| This journal is © The Royal Society of Chemistry 2012 |
