ZnO plates synthesized from the ammonium zinc nitrate hydroxide precursor
Lijuan
Wan
ac,
Xiangyan
Wang
b,
Shicheng
Yan
ab,
He
Yu
ac,
Zhaosheng
Li
*abc and
Zhigang
Zou
*abc
aEco-materials and Renewable Energy Research Center (ERERC), National Laboratory of Solid State Microstructures, Nanjing University, Nanjing 210093, People's Republic of China. E-mail: zsli@nju.edu.cn; zgzou@nju.edu.cn; Fax: +86-25-8368-6632; Tel: +86-25-8368-6630
bCollege of Engineering and Applied Sciences, Nanjing University, Nanjing 210093, People's Republic of China
cDepartment of Physics, Nanjing University, Nanjing 210093, People's Republic of China
First published on 17th October 2011
Abstract
ZnO assembled hexagonal or porous rectangular plates were synthesized from the decomposition of a new precursor, ammonium zinc nitrate hydroxide (NH4Zn3(OH)6NO3), through a facile solvothermal route assisted by Poly(styrene sulfonic acid) sodium salt (PSS). XRD, BET surface area measurements, SEM, HRTEM and TG-DSC were used to describe the as-prepared products and understand the phase transformation. Our results indicate that the morphology of the ZnO plates is dependent strongly on the decomposition process of the precursor. By directly heating NH4Zn3(OH)6NO3, porous ZnO plates were obtained due to the thermal decomposition of the precursor. Using the same precursor under the solvothermal reaction, however, the final product is hexagonal ZnO plates. The growth mechanism of ZnO plates formed in different synthetic routes was proposed. Photoluminescence (PL) and photocatalytic properties of the as-prepared ZnO with different morphologies were studied. Porous ZnO plates showed three emission peaks, which may be induced by its microstructure and defect centres, and the porous ZnO showed the improved photocatalytic activity for photoreduction of CO2.
1. Introduction
Zinc oxide (ZnO) has attracted considerable attention as a versatile material in a wide range of applications, including piezoelectronic devices, catalysis, actuators, light-emitting diodes, photodetectors, photoelectrochemical cells, biosensor and so forth.1,2 Furthermore, some photocatalysts including ZnO are expected to be used in environmental purification and the photoreduction of CO2.3 Recently, it has been documented that these applications depend greatly on their microstructures, including crystal size, orientation, and morphological character.3ZnO materials with different morphologies, such as rods, belts, combs, cables, tetrapods, wires, and hierarchical nanostructures with high symmetries1,4 have been synthesized. To get various ZnO nanostructures, many strategies are proposed, such as the vapour transport process using catalyst,5 or catalyst-free,6 and the wet-chemistry route.7 In the existing synthetic routes, hydrothermal or solvothermal techniques have been widely used to be the effective approaches for the facile operation, flexible adjustment of experimental parameters and mild synthesis conditions.8 These factors make such strategies more economic than the vapour phase route.The microstructure of ZnO is influenced by its synthetic conditions, such as precursor, morphology-directing agents and reaction medium. Among these factors, the reaction precursor is a crucial effect factor. Different precursors for the synthesis of ZnO in solution phase may induce various morphologies, such as porous ZnO interconnected networks from Zn3(OH)4(NO3)2,9ZnO superstructure from Zn5(OH)8(NO3)2·1.3NH3·0.7H2O,10ZnO microboxes from LHZA [Zn5(OH)8(OCOCH3)2·2H2O]11 and flower-like cupped-end ZnO microrod bundles from ZnCl2(N2H4)2.12 Thus, the unusual precursor and its decomposition process may induce ZnO with different morphologies.
In this work, we report the synthesis of ZnO plates with porous rectangular and assembled hexagonal morphologies through a solvothermal route in an environmentally benign alcohol-water reaction medium. A new precursor NH4Zn3(OH)6NO3 was obtained in this synthesis system. The porous or hexagonal ZnO plates can be easily obtained by changing the decomposition process of NH4Zn3(OH)6NO3. Hexagonal ZnO plates can be prepared from the decomposition of NH4Zn3(OH)6NO3 in the solvothermal system. Porous ZnO plates were obtained through thermal treatment of NH4Zn3(OH)6NO3. The synthesis mechanism of ZnO with different morphologies was proposed and the PL properties of the products at room temperature were studied. Also, the as-prepared ZnO samples are used as photocatalysts in the photocatalytic reduction of CO2.
2. Experimental
2.1 Materials
The starting materials utilized are zinc nitrate hexahydrate (Zn(NO3)2·6H2O, analysis purity grade), 26∼28% NH3·H2O and absolute ethanol (Nanjing Chemical Reagent Co. Ltd.). Poly(styrene sulfonic acid) sodium salt (PSS, MW = 300,000, product no. 25704-18-1) was purchased from Alfa Aesar and used as received without further purification. Distilled water was used throughout the experiment.2.2 Synthesis of ZnO plates
In a typical process, 2.12 g of Zn(NO3)2·6H2O and 0.18 g PSS was dissolved in 29.3 mL of solution containing water and ethanol, then 1.61 mL of NH3·H2O was added dropwise at room temperature. The volume of water used in the starting solution is changed from 1 to 4 mL. The mixture was stirred for 15 min, then transferred into Teflon-lined stainless steel autoclave, and heated at 120 °C for 5 h. These samples were treated by centrifugation and thoroughly rinsed with water and ethanol several times to remove the PSS, and then dried at 60 °C in an oven for subsequent characterization. Porous ZnO was obtained from the calcination of the precursor at 200 °C for 4 h and washed for the removal of by-products, and then dried and calcined at 450 °C for 4 h (1 °C min−1 under air).2.3 Characterization
The crystalline phase and orientation of products were identified using X-ray diffraction (XRD; Ultima III, Rigaku) with Cu-Kα radiation (λ = 0.154 nm, 40 kV, 40 mA) and a scan rate of 10° min−1. Thermogravimetry-differential scanning calorimetry (TG-DSC) were performed using a NETZSCH STA449C thermal analyzer (10 °C min−1 under air atmosphere). The specific surface area of porous ZnO powders was obtained on a Micromeritics TriStar 3000 instrument and the Brunauer–Emmett–Teller (BET) equation was used to calculate the surface area. The morphology and microstructure were observed using a field emission scanning electron microscope (FE-SEM; NOVA230, FEI Ltd.) with accelerating voltage of 5 kV, and a high resolution transmission electron microscope (TEM; JEM-2100, 200 kV, JEOL Ltd.). Ultraviolet visible (UV-vis) diffuse reflection spectra were measured using a UV-vis spectrophotometer (Shimadzu UV-2550, Japan) and converted from reflection to absorbance by the Kubelka-Munk method. The acquired photoluminescence (PL) properties of the as-prepared ZnO samples were investigated using PL instrument (FLS920, Edinburgh) at room temperature.2.4 Photocatalytic activity test
In the photocatalytic reduction of CO2, ZnO powder sample (0.1 g) was uniformly dispersed on a glass reactor with an area of 4.2 cm2. A 300W Xenon arc lamp was used as the light source for the photocatalytic reaction. The volume of the reaction system was about 230 mL. The reaction setup was vacuum-treated several times, and then high-purity CO2 gas was introduced into the reaction to achieve ambient pressure. Deionized water (0.4 mL) was injected into the reaction system as the reducing agent. During the irradiation, about 1 mL of gas was taken from the reaction cell at given intervals for subsequent CH4 or CO concentration analysis with a gas chromatograph (GC-2014, Shimadzu Corp., Japan).3. Results and discussion
When the water content in the starting solution was more than 3 mL, ZnO was obtained in the solvothermal system. From Fig. 1a, it can be seen that the diffraction peaks of the as-prepared sample show highly preferential orientation compared with JCPDS No. 36-1451, a typical ZnO crystal (hexagonal, P63mc). The result shows the preferential growth of the (002) plane in the as-prepared ZnO, for which morphology may be plate13 or rod.14 To further study the formation process of ZnO in the solvothermal system, XRD patterns of the samples obtained at different reaction times were obtained (see Fig. 1b–d). In the sample after 20 min growth, the XRD result shows the particles have the composition of NH4Zn3(OH)6NO3, compared with JCPDS No. 44-0740 (see Fig. 1b). As the growth time increases, the XRD pattern shows the formation of a partial crystalline ZnO structure because of the decomposition of NH4Zn3(OH)6NO3 (see Fig. 1c). When the growth time increases to 180 min, its composition completely becomes pure crystalline ZnO with (002) plane preferred growth (see Fig. 1d).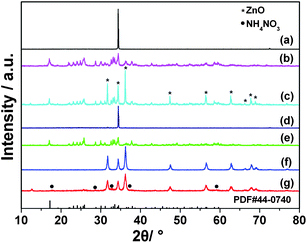 | ||
| Fig. 1 The XRD patterns of the samples prepared with more than 3 mL of water in the starting solution collected at different times; (a) 5 h, (b) 20 min, (c) 140 min, (d) 180 min, (e) the samples prepared with less than 3 mL water, (f) the corresponding calcined sample at 450 °C and (g) the samples from NH4Zn3(OH)6NO3 calcined at 130 °C for 4 h and the standard XRD pattern of bulk ammonium zinc nitrate hydroxide (JCPDS No. 44-0740). The labels (*) and (•) refer to the diffraction peaks from ZnO (JCPDS card no. 36-1451) and NH4NO3 (JCPDS No. 85-0600), respectively. | ||
SEM and TEM observations were presented in Fig. 2. Fig. 2a shows the as-prepared ZnO samples have obvious hexagonal plates morphology, with one side of the two parallel planes being about 500 nm larger than the other due to the ZnO polarity growth. The side-view image shows that the plate is composed of many smaller plates. Fig. 2b shows the TEM image of a hexagonal ZnO plate and the HRTEM image (Fig. 2c) shows the (010) crystalline plane of ZnO. The SAED pattern from the edge of the ZnO hexagonal plates (Fig. 2d) shows the single crystalline (002) plane. The single crystal-like pattern consisting of individual diffraction spots indicates that the whole hexagonal plate is highly oriented.
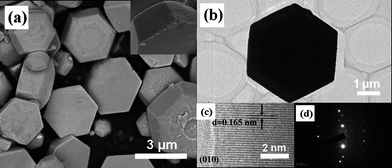 | ||
| Fig. 2 FE-SEM and TEM images of the as-prepared ZnO samples with more than 3 mL water in the starting solution; (a) low-magnification SEM image, and the side image (inset), (b) TEM image, (c) high-resolution TEM image and (d) SAED pattern. | ||
For the formation of the assembled pattern of hexagonal plates, the presence of the water-soluble long-chain polymer PSS is crucial. As is well-known, a ZnO crystal consists of polar planes, namely the Zn2+-terminated (001) plane, the O2−-terminated (00![[1 with combining macron]](https://www.rsc.org/images/entities/char_0031_0304.gif) ) plane, and the nonpolar plane (010) with C6v symmetry, for which the growth rates (v) are reported to be v001 > v010 > v100.15 A preferential adsorption of PSS on the ZnO (001) plane occurs due to the electrostatic attraction between the positively charged Zn2+-terminated (001) plane and the negatively charged sulfonic acid groups in the side chain of PSS. The adsorbed species can suppress growth along the c-axis by “blocking” the attachment of growth units until they are displaced or are buried by the next atomic layer, and thus reduces the aspect ratio of ZnO microrods.16,17 As a result, steric, Van der Waals and hydrophilic–hydrophobic interactions associated with the pendent chains of the adsorbed PSS polymers,18 cooperative with the special shape anisotropy of ZnO primary nanosheets, mean those polymer-anchored ZnO nanosheets spontaneously assembled into plate superstructures to eliminate the high surface energy. Thus, the nanoplate superstructures may be induced to have a smooth surface to reduce the surface area and so minimize the surface energy through a dissolution-recrystallization process with Ostwald ripening.
) plane, and the nonpolar plane (010) with C6v symmetry, for which the growth rates (v) are reported to be v001 > v010 > v100.15 A preferential adsorption of PSS on the ZnO (001) plane occurs due to the electrostatic attraction between the positively charged Zn2+-terminated (001) plane and the negatively charged sulfonic acid groups in the side chain of PSS. The adsorbed species can suppress growth along the c-axis by “blocking” the attachment of growth units until they are displaced or are buried by the next atomic layer, and thus reduces the aspect ratio of ZnO microrods.16,17 As a result, steric, Van der Waals and hydrophilic–hydrophobic interactions associated with the pendent chains of the adsorbed PSS polymers,18 cooperative with the special shape anisotropy of ZnO primary nanosheets, mean those polymer-anchored ZnO nanosheets spontaneously assembled into plate superstructures to eliminate the high surface energy. Thus, the nanoplate superstructures may be induced to have a smooth surface to reduce the surface area and so minimize the surface energy through a dissolution-recrystallization process with Ostwald ripening.
The crystalline phases of the samples prepared with less than 3 mL of water content in the starting solution were characterized by XRD and the results are shown in Fig. 1e and 1f. From Fig. 1e, the diffraction peaks of the sample are in good agreement with JCPDS no. 44-0740, an ammonium zinc nitrate hydroxide (NH4Zn3(OH)6NO3) crystal. Fig. 1f shows the XRD pattern of the sample from NH4Zn3(OH)6NO3 after calcination at 450 °C, for which the diffraction peaks are in good agreement with JCPDS no. 36-1451, a typical wurtzite-type ZnO crystal (hexagonal, P63mc). No impurity phases were detected, indicating that the NH4Zn3(OH)6NO3 was transferred to ZnO by complete decomposition. Thus, the thermal stability of NH4Zn3(OH)6NO3 was investigated.
The thermal behaviour of the as-prepared NH4Zn3(OH)6NO3 precursor was analyzed by TG-DSC (see Fig. 3a). From the DSC curve, there are two obvious peaks: one is at 137 °C, the endothermic reaction for the decomposition of NH4Zn3(OH)6NO3, and at the same temperature zone, it decomposed into Zn(OH)2 and NH4NO3, then the Zn(OH)2 became ZnO. From the TG curve, the corresponding weight loss is 13.57% at 60 to 260 °C for Zn(OH)2 to ZnO. The other peak at 302 °C is exothermic reaction for the decomposition of NH4NO3, and from TG curve, the corresponding weight loss is 18.91% at 260 to 400 °C for the thermal decomposition of NH4NO3. The XRD pattern (see Fig. 1g) of the product from NH4Zn3(OH)6NO3 calcined at 130 °C clearly shows the diffraction peaks of ZnO and NH4NO3, which is in agreement with the above proposition. Also, the thermal behaviour of PSS was studied by TG-DSC (see Fig. 3b). The result shows the starting decomposition temperature of PSS was over 370 °C and it was completely decomposed at 550 °C. Thus, the exothermic peak of the as-prepared NH4Zn3(OH)6NO3 sample is caused by the thermal decomposition of NH4NO3 but not PSS. From the TG curve, the thermal decomposition of NH4Zn3(OH)6NO3 is supposed to proceed first into Zn(OH)2 and NH4NO3 and finally ZnO, which weight loss is totally equal to 32.48%, almost in agreement with 35.54% in theory for the complete decomposition of NH4Zn3(OH)6NO3 into ZnO.
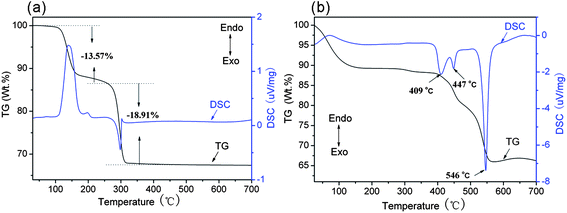 | ||
| Fig. 3 The TG-DSC curves of (a) the as-prepared precursor with less than 3 mL of water in the starting solution and (b) the surfactant PSS. | ||
SEM images of the as-prepared NH4Zn3(OH)6NO3 and ZnO samples are shown in Fig. 4. The low- and high-magnification images reveal that NH4Zn3(OH)6NO3 exhibits the rectangular plate morphology with about 1 μm in length, 800 nm in width and 60 nm in thickness (Fig. 4a, b). The SEM images presented in Fig. 4c, d show that the ZnO samples have porous microstructure aggregated by nanoparticles and maintain rectangular plate profile. The TEM images provide further information on the morphology and crystalline structure. It can be observed from Fig. 4e, f that the porous ZnO plate is composed of nanocrystalline ZnO particles of about 10 nm and the pores are formed by the agglomeration of nanoparticles. The selected area electron diffraction (SAED) pattern in the circle pattern discloses the as-prepared ZnO is multi-crystalline (Fig. 4e, inset). The high-resolution TEM (HRTEM) image shows that the lattice fringes have a spacing of 0.243 nm corresponding to the interplanar spacing of the (101) plane of ZnO (Fig. 4f, inset). According to the TG-DSC results, it can be known that the porous ZnO resulted from the thermal decomposition of NH4Zn3(OH)6NO3. When NH4Zn3(OH)6NO3 nanoplates were subjected to high-temperature annealing, the pores might be formed as a result of releasing the gaseous side products and the structural contraction from Zn(OH)2 (a medium product formed by decomposition of NH4Zn3(OH)6NO3, with density ∼3.053 g cm−3) to ZnO (with density ∼5.606 g cm−3) through a pseudo-topological transformation. This process is similar to those routes by thermal decomposition of basic carbonate zinc7,19 or ZnS(en)0.520 to porous ZnO with different morphologies. The BET surface area of the porous ZnO is 15.52 m2 g−1 (about 2.6 times that of commercial ZnO), and the larger surface area is attributed to the porosity. As far as we know, NH4Zn3(OH)6NO3 is a new precursor to prepare porous ZnO through the calcination route.
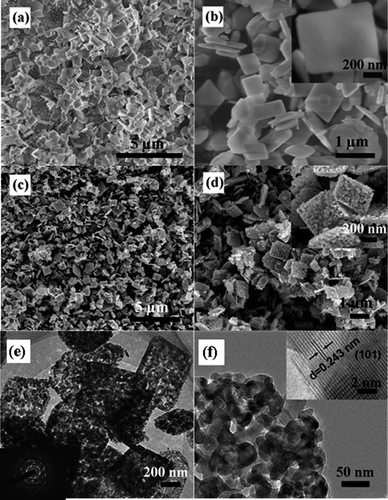 | ||
| Fig. 4 FE-SEM and TEM images of the as-prepared precursor with less than 3 mL of water in the starting solution and the corresponding calcined sample at 450 °C. SEM images of (a),(b) the precursor and (c),(d) the calcined sample. The inset of (b) and (d) is the high-magnification SEM image. (e),(f) TEM images of the calcined sample. The inset of (e) is the SAED pattern and the inset of (f) is the high-resolution TEM image. | ||
Based on the above results, NH4Zn3(OH)6NO3 is sensitive to the water content, since it can be kept in lower water content while it decomposed in the reaction system when increasing the water content. When using less than 3 mL of water in the reaction medium, the XRD pattern shows that the product is ammonium zinc nitrate hydroxide (NH4Zn3(OH)6NO3). When the water content was more than 3 mL, the formation of ZnO as the product is attributed to the decomposition of NH4Zn3(OH)6NO3 in the reaction system. Thus, the NH4Zn3(OH)6NO3 as a precursor obtained in different starting solutions can be treated to obtain ZnO in two ways: through thermal decomposition or solvothermal decomposition. Thus, the decomposition condition of the precursor NH4Zn3(OH)6NO3 affects the morphology of the final product ZnO. The proposed formation mechanism of porous rectangular plate and assembled hexagonal ZnO plates is presented in Fig. 5.
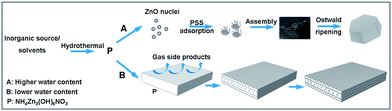 | ||
| Fig. 5 Schematic illustration of the proposed formation mechanism for the variation of ZnO morphology assisted by PSS with different water content in the starting solution. | ||
In the applications of ZnO, it has been used in light-emitting diodes and high-efficiency laser generators, which can operate at room temperature, due to its wide band gap and large exciton binding energy [60 meV].21 The optical features of ZnO may be influenced by the microstructures.16 The room-temperature PL spectra of the as-prepared ZnO plates are shown in Fig. 6. The as-prepared porous ZnO rectangular plates show different PL spectrum features from hexagonal ZnO plates. Porous ZnO shows three emission peaks, a UV band located at about 383 nm (3.25 eV), a green band (520 nm, 2.48 eV) and a red band (620 nm, 2.00 eV), respectively. It has been shown that different defect centres are responsible for the UV, green, and orange-red emissions.22,23 The observation of UV emission was attributed to the near band edge emission of the wide band gap ZnO, and it has been suggested that it comes from recombination of excitons.24 The green emission is generally referred to as the deep level or trapped state emission. The green transition is supposed to be attributed to the single ionized oxygen vacancy in ZnO and the emission comes from the radiative recombination of photon generated hole with electrons in singly occupied oxygen vacancies.24 The red band has been reported to be observed in porous ZnO.9 Yellow and red emissions exhibited different decay properties induced by different initial states (conduction band and shallow donors).25 It has been suggested that the orange-red emission is associated with excess oxygen.26 The UV, green, and orange-red emissions shown in as-prepared porous ZnO may be attributed to the oxygen vacancies and interstitials. While for the ZnO hexagonal plates, it shows a weak UV emission from the recombination of excitons24 and a strong yellow emission, locating at around 383 and 605 nm, respectively. The yellow emission in ZnO has been attributed to oxygen excess.27 Thus, the room-temperature PL properties of the as-prepared ZnO samples are influenced by different microstructures and defect centres.
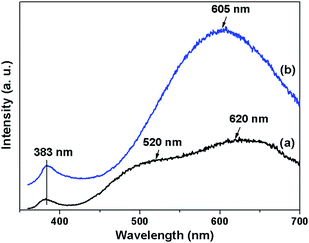 | ||
| Fig. 6 The PL spectra of (a) the porous ZnO and (b) the ZnO hexagonal plates at room temperature (λex = 325 nm). | ||
The diffuse reflectance spectrum of the ZnO samples is shown in Fig. 7. The light absorption edges of the ZnO plates exhibit red shift slightly compared with the porous ZnO, which may be attributed to the different microstructures and defects. The band gap of porous ZnO and ZnO plates is estimated from the absorption edge to be 3.20 and 3.15 eV, respectively. In addition, the photoreduction of CO2 to fuel by means of solar energy is a subject of growing importance in both energy shortage and global warming. Fig. 8 shows that CO2 can be photoreduced to CO and CH4 in the presence of water vapour by using the above-mentioned ZnO samples as photocatalysts. The mechanism of photoreduction of CO2 into CO and CH4 can be described as follows: under UV-vis light irradiation, the photogenerated hole on the valence band top (potential: 2.86 V vs.NHE)28 of ZnO can lead to oxidation of water to produce hydrogen ions viaH2O → 1/2O2 + 2H+ + 2e− (E0redox = 0.82 V vs.NHE),29 and the photogenerated electron on the conduction band bottom (potential: −0.29 V vs.NHE) of ZnO can drive the reduction of CO2 into CH4viaCO2 + 8e− + 8H+ → CH4 + H2O (E°redox = −0.24 V vs.NHE).30 The presence of CO in the gaseous product mixture presumably resulted from the incomplete reduction of CO2, which may be due to insufficient H+ produced from the H2O present in the reactant mixture and resulted from recombination of ˙C radicals and oxygen on the surface of the catalysts.31 From Fig. 8, it is obvious that porous ZnO (76.35 ppm h−1CO and 20.52 ppm h−1CH4) exhibits higher activity than ZnO plates (44.68 ppm h−1CO and 1.57 ppm h−1CH4). The porous structure of ZnO influences both the PL property and the photocatalysis activity. The porous ZnO exhibits better photoreduction performance, which is attributed to the higher specific surface area (15.52 m2 g−1) than that of ZnO plates (2.41 m2 g−1) and also better gas diffusion property due to the porosity.
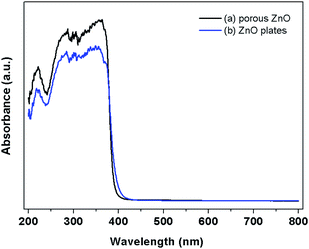 | ||
| Fig. 7 UV-vis absorption spectra of (a) porous ZnO and (b) ZnO hexagonal plates. | ||
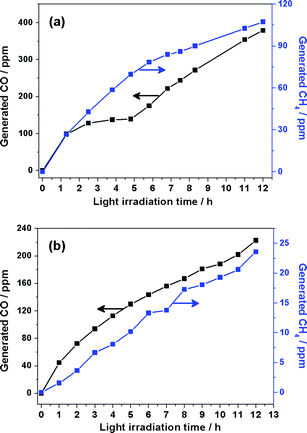 | ||
| Fig. 8 CH4 and CO generation over (a) porous ZnO and (b) ZnO hexagonal plates as a function of UV-vis light irradiation time. | ||
4. Conclusions
In summary, ZnO porous rectangular and assembled hexagonal plates were synthesized from the decomposition of a new precursor NH4Zn3(OH)6NO3. Porous ZnO plates were obtained from the thermal treatment of NH4Zn3(OH)6NO3. ZnO hexagonal plates were synthesized through the decomposition of NH4Zn3(OH)6NO3 in the solvothermal system. The growth mechanism of ZnO plates is proposed. The formation of ZnO hexagonal plates may be attributed to the change of growth rate due to preferred adsorption of PSS on the (001) plane of the ZnO crystal. Room-temperature PL spectra of the as-prepared ZnO plates show that the difference of the emissions in porous ZnO plates from ZnO hexagonal plates are induced by their different microstructures and defect centres. The better performance of porous ZnO than ZnO plates for photoreduction of CO2 is attributed to the high specific surface area.Acknowledgements
This work is supported by the National Natural Science Foundation of China (no. 21073090), the Fundamental Research Funds for the Central Universities (no. 1095021338, 1114021304, and 1116021308) and the Natural Science Foundation of Jiangsu Province (no. BK2008028).References
- M. H. Huang, S. Mao, H. Feick, H. Q. Yan, Y. Y. Wu, H. Kind, E. Weber, R. Russo and P. D. Yang, Science, 2001, 292, 1897 CrossRef CAS.
- Z. W. Zhao, X. J. Chen, B. K. Tay, J. S. Chen, Z. J. Han and K. A. Khor, Biosens. Bioelectron., 2007, 23, 135 CrossRef CAS.
- (a) T. S. Dzhabiev, Kinetics and Catal., 1998, 38, 795 Search PubMed; (b) J. G. Yu and X. X. Yu, Environ. Sci. Technol., 2008, 42, 4902 CrossRef CAS; (c) Y. Y. Liu, B. B. Huang, Y. Dai, X. Y. Zhang, X. Y. Qin, M. H. Jiang and M.-H. Whangbo, Catal. Commun., 2009, 11, 210 CrossRef CAS.
- Z. W. Pan, Z. Dai and Z. L. Wang, Science, 2001, 291, 1947 CrossRef CAS.
- Z. L. Wang, J. Mater. Chem., 2005, 15, 1021 RSC.
- W. Ogasawara, W. Shenton, S. A. Davis and S. Mann, Chem. Mater., 2000, 12, 2835 CrossRef CAS.
- J. Zhang, S. R. Wang, M. J. Xu, Y. Wang, B. L. Zhu, S. M. Zhang, W. P. Huang and S. H. Wu, Cryst. Growth Des., 2009, 9, 3532 CAS.
- B. Cheng and E. T. Samulski, Chem. Commun., 2004, 986 RSC.
- J. H. Wu, B. Varghese, X. D. Zhou, S. Y. Teo, C. H. Sow, S. G. Ang and G. Q. Xu, Chem. Mater., 2010, 22, 1533 CrossRef CAS.
- H. Tang, J. C. Chang, Y. Y. Shan and S.-T. Lee, J. Phys. Chem. B, 2008, 112, 4016 CrossRef CAS.
- F. H. Zhao, W. J. Lin, M. M. Wu, N. S. Xu, X. F. Yang, Z. R. Tian and Q. Su, Inorg. Chem., 2006, 45, 3256 CrossRef CAS.
- C. L. Jiang, W. Q. Zhang, G. F. Zou, W. C. Yu and Y. T. Qian, J. Phys. Chem. B, 2005, 109, 1361 CrossRef CAS.
- J. H. Zhang, H. Y. Liu, Z. L. Wang, N. B. Ming, Z. R. Li and A. S. Biris, Adv. Funct. Mater., 2007, 17, 3897 CrossRef CAS.
- S. P. Garcia and S. Semancik, Chem. Mater., 2007, 19, 4016 CrossRef CAS.
- Y. Peng, A. W. Xu, B. Deng, M. Antonietti and H. Colfen, J. Phys. Chem. B, 2006, 110, 2988 CrossRef CAS.
- J. G. Yu, C. Li and S. W. Liu, J. Colloid Interface Sci., 2008, 326, 433 CrossRef CAS.
- F. C. Frank, R. H. Doremus, B. W. Roberts and D. Turnbull, in Growth and Perfection of Crystals, Wiley, New York, 1958, 411 Search PubMed.
- J. G. Yu and S. W. Liu, J. Solid State Chem., 2008, 181, 1048 CrossRef.
- X. Y. Wang, Z. P. Tian, T. Yu, H. M. Tian, J. Y. Zhang, S. K. Yuan, X. B. Zhang, Z. S. Li and Z. G. Zou, Nanotechnology, 2010, 21, 065703 CrossRef.
- J. Y. Liu, Z. Guo, F. L. Meng, T. Luo, M. Q. Li and J. H. Liu, Nanotechnology, 2009, 20, 125501 CrossRef.
- X. Xia, P. Yang, Y. Sun, Y. Wu, B. Mayers, B. Gates, Y. Yin, F. Kim and H. Yan, Adv. Mater., 2003, 15, 353 CrossRef.
- H. C. Ong and G. T. Du, J. Cryst. Growth, 2004, 265, 471 CrossRef CAS.
- A. B. Djurišić, Y. H. Leung, K. H. Tam, L. Ding, W. K. Ge, H. Y. Chen and S. Gwo, Appl. Phys. Lett., 2006, 88, 103107 CrossRef.
- K. Vanheusden, W. L. Warren, C. H. Seager, D. R. Tallant, J. A. Voigt and B. E. Gnade, J. Appl. Phys., 1996, 79, 7983 CrossRef CAS.
- R. B. Lauer, J. Phys. Chem. Solids, 1973, 34, 249 CrossRef CAS.
- A. Teke, Ü. Özgür, S. Doğan, X. Gu, H. Morkoç, B. Nemeth, J. Nause and H. O. Everitt, Phys. Rev. B: Condens. Matter Mater. Phys., 2004, 70, 195207 CrossRef.
- S. A. Studenikin, N. Golego and M. Cocivera, J. Appl. Phys., 1998, 84, 2287 CrossRef CAS.
- V. P. Indrakanti, J. D. Kubicki and H. H. Schobert, Energy Environ. Sci., 2009, 2, 745 CAS.
- Q. Liu, Y. Zhou, J. H. Kou, X. Y. Chen, Z. P. Tian, J. Gao, S. C. Yan and Z. G. Zou, J. Am. Chem. Soc., 2010, 132, 14385 CrossRef CAS.
- Y. Xu and M. A. A. Schoonen, American Mineralogist, 2000, 85, 543 CAS.
- S. S. Tan, L. Zou and E. Hu, Catal. Today, 2006, 115, 269 CrossRef CAS.
| This journal is © The Royal Society of Chemistry 2012 |