Crystal structure and phase behavior of the tolyl glycerol ethers. From the conglomerate former to the chirality-driven nanogelator†
Alexander A.
Bredikhin
*,
Dmitry V.
Zakharychev
,
Zemfira A.
Bredikhina
,
Aidar T.
Gubaidullin
and
Robert R.
Fayzullin
A.E. Arbuzov Institute of Organic and Physical Chemistry, Kazan Scientific Center, Russian Academy of Sciences, Arbuzov St., 8, Kazan, 420088, Russian Federation. E-mail: baa@iopc.ru; Fax: +7 843 2731872; Tel: +7 843 2734573
First published on 24th October 2011
Abstract
According to differential scanning calorimetry data ortho-, meta-, and para-tolyl glycerol ethers 1–3 form thermodynamically most stable crystal phases during solution crystallization. For all members of the series the crystal phases formed during melt crystallization have different thermodynamic characteristics from those of the stable ones. Binary melting diagrams were constructed for the stable solid phases; on this basis it was found that 1 is prone to spontaneous resolution, and 2 and 3 form stable solid racemic compounds, the Gibbs energy of formation for which are found to be −2.70 and −2.43 kJ mol−1. Solution grown single crystals of 1–3 were investigated by an X-ray diffraction method. The principal supramolecular crystal formative motifs were revealed: 1D columns for 1 and scal-2, 2D bilayers having developed a 2D system of intermolecular hydrogen bonds (IMHB) for rac-2 and rac-3, and 2D bilayer having 1D spiral IMHB organization for scal-3. The possible reasons preventing the solid racemic compound formation in the case of 1, and the spontaneous resolution manifestation in the cases of 2 and 3 are disclosed. It was demonstrated that, from the whole family of tolyl glycerol ethers, only scal-3 samples are capable of supramolecular gels formation. This property is connected with the peculiarities of the scalemic 3 crystal packing.
Introduction
The glycerol ethers and esters are rather common in the family of lipids. Lipids (fats, plasmalogenes, membrane-forming glycerolipids, and the like) form the third class, after proteins and carbohydrates, of “life molecules”. Many physiologically active substances, including registered drugs like the fungicide chlorphenesin, expectorant guaifenesin, and muscle relaxant mephenesin,1 belong to the series of aryl glycerol ethers R–C6H4–OCH2CH(OH)CH2OH, possibly because of their similarity to lipids. Aryl glycerol ethers (AGE) retain generic features of the glycerolipid family: chirality of the glycerol fragment and amphiphilicity of the molecule with a clear-cut distinction between the hydrophilic glycerol framework and the hydrophobic aromatic substituent. At the same time, owing to the presence of free hydroxyls, the aryl glycerol ethers differ sufficiently from most of the lipids. It is reasonable to expect that, as lipid self-association can be caused predominately by scalar hydrophilic and/or hydrophobic interactions, AGE self-association would be controlled by directed intermolecular hydrogen bonds (IMHB) OH⋯O(H).In the case of AGE both the donor and acceptor hydrogen bond component belongs to chiral fragment. Consequently, a marked chiral discrimination could be the result of the AGE self-association. The examples of this phenomenon were pointed out in our preceding publications.
Thus, we have found that ortho-tolyl glycerol ether, the above-mentioned muscle relaxantmephenesin 1, represents a conglomerate,2,3 that this compound is prone to spontaneous resolution,4 and on this basis it could be directly separated as the pure enantiomer from the racemic mixture.5 Spontaneous resolution is a classic example of chiral discrimination accompanying the self-association of molecules during crystallization. Furthermore, for para-tolyl glycerol ether 3 we have found that small amounts of its non-racemic samples immobilize great amounts of hydrocarbon solvents, forming supramolecular gels.6 However, racemic 3 has no gelation abilities and forms thin crystal plates in the same conditions. Thereby, nowadays p-tolyl glycerol ether 3 is the simplest molecular organogelator with pronounced chirality-driven properties.6
The compounds 1 and 3 differ from one another by only the methyl substituent position in the phenyl ring. This small structural perturbation may be thought of as running away from the chiral centre. Nevertheless, their chirality-driven self-association leads to sufficiently different external manifestations results. This situation determines the initial purposes of our work. First of all we have intended to finish the series of tolyl glycerol ethers by adding to it the meta-derivative 2.
Secondly, we would like to reveal and, where possible, to quantify the capacity of chiral compounds 2 and 3 for spontaneous resolution during crystallization. Thirdly, we intended to investigate the capacity of the racemic and scalemic samples of 1 and 2 for molecular gelation. As it was mentioned above, both spontaneous resolution and supramolecular gelation phenomena are directly relevant to the self-association of molecules. The most precise information about the structure of such associates could be obtained by X-ray diffraction analysis. For this reason, fourthly, we intended to determine the hitherto unknown crystal structure of scal-2 and rac-2 samples, following the uniform analysis of the crystallographic information for all members of the series. We would like to trace the differences in the crystal organization accompanying both the chiral nature of the crystal media (homochiral vs. heterochiral) and the successive relocation of the methyl group within the phenyl ring. Finally, our extra task consisted of the search for possible relations between the supramolecular crystal organizations of the compounds 1–3 and their ability (or inability) for spontaneous resolution and nanogels formation.
Experimental
Materials
The syntheses of racemic and enantiopure ortho- and para-tolyl glycerol ethers 1 and 3 were described by us earlier.5,6 Racemic and scalemic meta-derivatives 2 were synthesized by analogy with a published procedure5 from the corresponding phenol and racemic or scalemic 3-chloropropane-1,2-diols. The characteristics of the investigated aryloxypropanediols are given below.![[thin space (1/6-em)]](https://www.rsc.org/images/entities/char_2009.gif) :
:![[thin space (1/6-em)]](https://www.rsc.org/images/entities/char_2009.gif) 20
20![[thin space (1/6-em)]](https://www.rsc.org/images/entities/char_2009.gif) :
:![[thin space (1/6-em)]](https://www.rsc.org/images/entities/char_2009.gif) 0.1; flow rate: 1.0 ml min−1; tR 15.1 min (major), tR 16.7 min (minor)].
0.1; flow rate: 1.0 ml min−1; tR 15.1 min (major), tR 16.7 min (minor)].
 | ||
| Scheme 1 Partial numbering accepted for molecules 1–3. | ||
![[thin space (1/6-em)]](https://www.rsc.org/images/entities/char_2009.gif) :
:![[thin space (1/6-em)]](https://www.rsc.org/images/entities/char_2009.gif) 1; flow rate 0.4 ml min−1; tR 7.5 min (minor), tR 9.0 min (major)] [lit.,7 +9.5 (c 1 in EtOH) and 97% ee]. 1H NMRδH (600 MHz; CDCl3 CDCl3; Me4Si) 2.09 (t, J 5.1 Hz, 1H, OH), 2.33 (s, 3H, CH3), 2.65 (d, J 4.3 Hz, 1H, OH), 3.69–3.77 (m, 1H, CH2), 3.81–3.86 (m, 1H, CH2), 4.00–4.05 (m, 2H, CH2O), 4.06–4.10 (m, H, CH), 6.70–6.74 (m, 2H, 5,9-H), 6.79 (d, J 7.8 Hz, 1H, 7-H), 7.16 (t, J 7.8 Hz, 1H, 8-H). 13C NMR spectrum was identical with that cited above for rac-2.
1; flow rate 0.4 ml min−1; tR 7.5 min (minor), tR 9.0 min (major)] [lit.,7 +9.5 (c 1 in EtOH) and 97% ee]. 1H NMRδH (600 MHz; CDCl3 CDCl3; Me4Si) 2.09 (t, J 5.1 Hz, 1H, OH), 2.33 (s, 3H, CH3), 2.65 (d, J 4.3 Hz, 1H, OH), 3.69–3.77 (m, 1H, CH2), 3.81–3.86 (m, 1H, CH2), 4.00–4.05 (m, 2H, CH2O), 4.06–4.10 (m, H, CH), 6.70–6.74 (m, 2H, 5,9-H), 6.79 (d, J 7.8 Hz, 1H, 7-H), 7.16 (t, J 7.8 Hz, 1H, 8-H). 13C NMR spectrum was identical with that cited above for rac-2.
![[thin space (1/6-em)]](https://www.rsc.org/images/entities/char_2009.gif) :
:![[thin space (1/6-em)]](https://www.rsc.org/images/entities/char_2009.gif) 1; flow rate 0.4 ml min−1; tR 18.4 min (minor), tR 20.1 min (major)].
1; flow rate 0.4 ml min−1; tR 18.4 min (minor), tR 20.1 min (major)].
Methods
| Compound | (R)-1 | (S)-2 | rac-2 | rac-3 | (S)-3 |
|---|---|---|---|---|---|
| Formula | C10H14O3 | C10H14O3 | C10H14O3 | C10H14O3 | C10H14O3 |
| M/g mol−1 | 182.21 | 182.21 | 182.21 | 182.21 | 182.21 |
| T/K | 296(2) | 296(2) | 296(2) | 296(2) | 296(2) |
| Crystal class | Monoclinic | Monoclinic | Orthorhombic | Monoclinic | Orthorhombic |
| Space group | P21 | P21 | Pca21 | Pc | P212121 |
| Crystal size/mm | 0.47 × 0.11 × 0.10 | 0.54x 0.06 × 0.04 | 0.47 × 0.25 × 0.12 | 0.49 × 0.38 × 0.03 | 0.60 × 0.29 × 0.14 |
| Z; Z′ | 4; 2 | 4; 2 | 8; 2 | 4; 2 | 4; 1 |
| Radiation type, λ/Å | Cu-Kα, 1.54184 | Mo-Kα, 0.71073 | Mo-Kα, 0.71073 | Mo-Kα, 0.71073 | Cu-Kα, 1.54184 |
| Cell parameters | a = 13.0132(8) | a = 12.513(1) | a = 12.338(1) | a = 17.264(2) | a = 4.8768(2) |
| b = 4.8558(3) | b = 4.9317(5) | b = 4.7318(3) | b = 4.7225(7) | b = 7.2147(3) | |
| c = 16.371(1) Å | c = 16.282(1) Å | c = 32.877(3) Å | c = 11.901(2) Å | c = 28.520(1) Å | |
| β = 109.235(3)° | β = 97.159(6)° | β = 90.091(2)° | |||
| V/Å3 | 976.7(1) | 996.9(1) | 1919.4(3) | 970.3(2) | 1003.48(7) |
| F(000) | 392 | 392 | 784 | 398 | 392 |
| ρ calc/g cm−3 | 1.239 | 1.214 | 1.261 | 1.247 | 1.206 |
| μ/cm−1 | 7.45 | 0.89 | 0.92 | 0.91 | 7.26 |
| Extinction coefficient | None | 0.012(3) | None | None | None |
| θ/deg | 3.60 ≤ θ ≤ 68.17 | 1.64 ≤ θ ≤ 27.98 | 3.36 ≤ θ ≤ 29.00 | 2.36 ≤ θ ≤ 27.94 | 6.21 ≤ θ ≤ 67.35 |
| Reflections measured | 11![[thin space (1/6-em)]](https://www.rsc.org/images/entities/char_2009.gif) 577 577 |
6120 | 8574 | 12![[thin space (1/6-em)]](https://www.rsc.org/images/entities/char_2009.gif) Å167 Å167 |
7867 |
| Independent reflections | 3045 [R(int) = 0.0250] | 3587 [R(int) = 0.0394] | 3529 [R(int) = 0.0584] | 2236 [R(int) = 0.0389] | 1673 [R(int) = 0.0295] |
| Number of parameters/restraints | 277/1 | 238/1 | 241/1 | 238/2 | 127/0 |
| Reflections [I > 2σ(I)] | 2893 | 1746 | 2614 | 1597 | 1630 |
| Flack parameter | −0.0(2) | — | — | — | 0.0(2) |
| R 1, wR2 [I > 2σ(I)] | 0.0263/0.0683 | 0.0470/0.0842 | 0.0568/0.1447 | 0.0768/0.2048 | 0.0288/0.0764 |
| R 1, wR2 (all reflections) | 0.0288/0.0795 | 0.1314/0.1076 | 0.0753/0.1581 | 0.1001/0.2257 | 0.0294/0.0771 |
| Goodness-of-fit on F2 | 1.108 | 0.918 | 1.038 | 1.017 | 1.047 |
| ρ max/ρmin/e Å−3 | 0.110/−0.116 | 0.132/−0.130 | 0.463/−0.181 | 0.566/−0.306 | 0.080/−0.096 |
The X-ray diffraction data for the crystals of (S)-2, rac-2 and rac-3 were collected on a Bruker Smart Apex II CCD diffractometer using graphite monochromated Mo-Kα (0.71073 Å) radiation at 296 K. Data for the crystals of (S)-3 and (R)-1 were collected on a Bruker Kappa Apex II CCD diffractometer using graphite monochromated Cu-Kα (1.54184 Å) radiation at 296 K. The crystal data, data collection, and the refinement are given in Table 1. Data were corrected for the absorption effect using the SADABS program.8 Data collections: images were indexed, integrated, and scaled using the APEX29 data reduction package. The structures were solved by direct methods and refined by the full matrix least-squares using SHELXTL10 and WinGX11 programs. All non-hydrogen atoms were refined anisotropically. The hydrogen atoms were inserted at calculated positions and refined as riding atoms except the hydrogen atoms on hydroxyl groups which were located from difference maps and refined using a riding model. Analysis of the intermolecular interactions was performed using the program PLATON.12Mercury program package13 was used for figures preparation.
All powder X-ray diffraction data (XRPD) were collected on Bruker D8 Advance diffractometer equipped with a Vario attachment and Vantec linear PSD, using Cu-Kα radiation (40 kV, 40 mA), and a graphite monochromator was employed. Room-temperature data were collected in the reflection mode with a flat-plate sample. The samples were loaded into a standard sample holder or on a glass plate, which was kept spinning (15 rpm) throughout the data collection. Patterns were recorded in the 2θ range between 3 and 60°, in 0.008° steps, with a step time of 1–2 s. Five powder patterns were collected and summed for each sample. See text for the commentary concerning gel and xerogel samples preparation.
Results and discussion
Thermochemical behavior of the tolyl glycerol ethers 1–3
The binary melting phase diagram gives a general idea of the crystallization behavior of a chiral compound. In the idealized case, to construct the liquidus of the binary melting phase diagram in the region of a pure component fusion, it is enough to have data on the fusion temperature and enthalpy of fusion for an enantiomerically pure sample. In this case the liquidus line is described by the simplified Schröder–Van Laar equation [eqn (1)] [ref. 14, eqn 22.5′, p. 358]: | (1) |
The experimental data for racemates, TfR and ΔHfR, allow the construction of another type of theoretical curve describing the liquidus line for congruent melting of binary molecular compounds.
In this case, the liquidus line obeys the Prigogine–Defay equation, which is usually used in the simplified form of eqn (2) [ref. 14, eqn 23.19, p. 375]:
 | (2) |
Differential scanning calorimetry (DSC) has served as a working method for the thermal measurements in this work. The typical DSC curves for the compounds 1–3 are reproduced in Fig. 1. As can be seen from this figure, close to enantiopure ortho-derivatives scal-1 demonstrate the most simple behavior in the melting/crystallization cycle (Fig. 1a, solid blue curve). For these samples the thermodynamic characteristics (temperature, enthalpy) of the melting peak are well reproducible and do not depend on the sample history. Whilst the crystallization accompanied the melt cooling takes place under sufficient supercooling (∼45 °C; Fig. 1a, bottom blue dotted curve), the process is cooperative in nature, and the sample thermodynamic characteristics after crystallization (Fig. 1a, upper blue dotted curve) are not different from the initial ones.
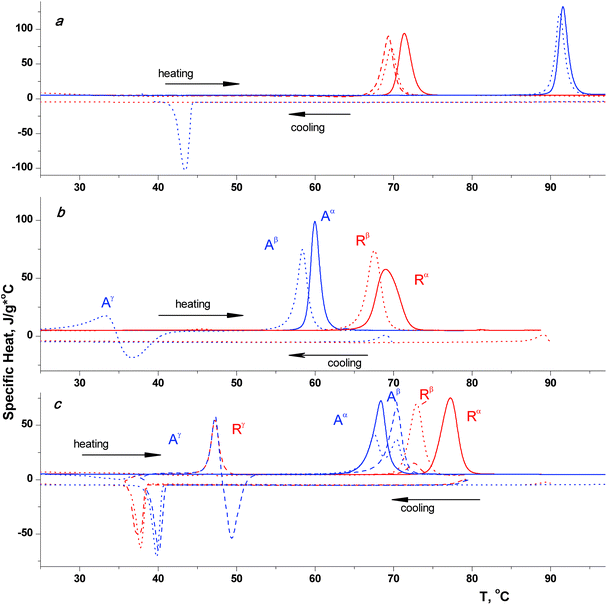 | ||
| Fig. 1 DSC heating/cooling curves for the different enantiomeric composition samples of tolyl glycerol ethers 1 (a), 2 (b) and 3 (c). The arrows are used in reference to the scanning direction; the color and the type of curve representations are commented upon in the text. | ||
The thermal behavior of the rac-1 sample (Fig. 1a, red curves) is more complicated. The thermal characteristics of the sample obtained by solution crystallization (Fig. 1a, solid red curve) are completely consistent with the racemic conglomerate ones (Table 2). But during the cooling of this sample melt the well-defined crystallization peak is not observable. It is likely that the crystallization is suppressed by the development of a high-viscosity amorphous phase. Slow crystallization takes place during subsequent supercooled sample heating as indicated by the base line drift into the exothermic region to the point of the melting process start.
| Comp. | T fA/°C | T fR/°C | ΔHfA/kJ mol−1 | ΔHfR/kJ mol−1 | T feu, calc./°C | T feu, exp./°C | x eu | ΔG0/J mol−1 |
|---|---|---|---|---|---|---|---|---|
| a Data reproduced from work.5 b Calculated as intersection for two Schröder–Van Laar curve branches. c Calculated as intersection for Schröder–Van Laar and Prigogine–Defay curve branches. | ||||||||
| 1 a | 91.0 | 70.6 | 34.4 | 32.2 | 70.1b | 70.6 | 0.50 | −51 |
| 2 | 59.4 | 67.8 | 32.7 | 31.8 | 55.6c | 55.4 | 0.88 | −2699 |
| 3 | 68.5 | 73.6 | 32.7 | 31.8 | 63.6c | 63.1 | 0.85 | −2434 |
It should be pointed out that there is a significant melting point depression after the sample has been crystallized from the melt (Fig. 1a, dotted red curve), as well as the enthalpy of fusion lowering. After this sample was kept over a day under at ambient temperature, the measured fusion enthalpy increases somewhat (Fig. 1a, dashed red curve). The melting temperature therewith is practically unaffected and remains noticeably lower in comparison to the initial sample crystallized from solution. We believe that this behavior is associated with the difficulties emerging when homochiral (single enantiomer) nuclei form in the viscous racemic media. Under these conditions some metastable phase (probably racemic compound) arises instead of the thermodynamically advantageous conglomerate.
As it follows from Fig. 1b, the racemate is the high-melting sample for meta-derivative 2. After the melt crystallization cycle both racemic and scalemic samples demonstrate the melting temperature depression as compared with the same for the solution crystallized ones (Fig. 1b, dotted curves). These phenomena signaled the existence of a metastable polymorph for the melt crystallized samples. In addition, the enantiopure samples of 2 (Fig. 1b, blue dotted curves) during the melt crystallization demonstrate another very specific metastable phase formation which is very unstable and quickly recrystallizes in the region close to the melting point (∼35 °C). This kind of thermochemical behavior gives no way of determining the last phase thermodynamic characteristics correctly.
All the more diverse crystal multiformity is demonstrated by para-tolyl glycerol ether 3 (Fig. 1c). At least three forms could be observed both for the racemic (red curves labeled by R letter) and the scalemic (blue curves labeled by A letter) samples. The solution crystallized forms are indicated by the superscript α. During a cooling process of the molten 3 samples of any nature, the exothermic peaks of the γ-phase appearance could be reproducibly detected in the temperature region 40–35 °C. If just after the event completed one reverses the scanning direction and begins the sample heating, it is possible to observe the endothermic peak of the γ-phase melting.
For scal-3 samples, recrystallization takes place immediately after the γ-phase melting. The new relatively stable crystal β-modification, having the fusion temperature higher than Tf for α-phase, forms in the process. The deeper and continuous cooling of the γ-phase also leads to its recrystallization, as demonstrated by the absence of the fusion peaks Tf ≈ 46 °C. But, as this takes place, prior to the β-phase melting peak, the second melting peak corresponding to the α-form makes its appearance.
The rac-3 sample behavior is similar to scal-3, except that the recrystallization of the γ-phase runs much more slowly and approaches the end in a day or so. The β-modification, having the fusion temperature lower than Tf for the α-phase, forms in the process. Anomalously low melting fusion temperatures, and the too low fusion enthalpy values for the γ-phases, as well as the Tf values for rac- and scal-samples being surprisingly close to one another, all lead to a cautious assumption that the γ-form is a non-classic crystal phase, probably a liquid crystal phase.
The results obtained for the thermodynamic characteristics of the pure enantiomers and the pure racemates of the solution crystallized tolyl glycerol ethers 1–3 (solid curves in Fig. 1) are represented in Table 2.
Graphic binary melting phase diagrams reconstructed on these data for compounds 1–3 are depicted in Fig. 2. The V-shaped phase diagram for ortho-derivative 1 (previously published in our paper5) is typical for conglomerate formers. Two other W-shaped binary phase diagrams for 2 and 3 are adequate for the substances formed as stable racemic compounds in the solid state. The stability of these racemic compounds could be quantified by their Gibbs free energy of formation ΔG0. The formula for this value calculation [eqn (3)] was proposed by Grant et al.:15
 | (3) |
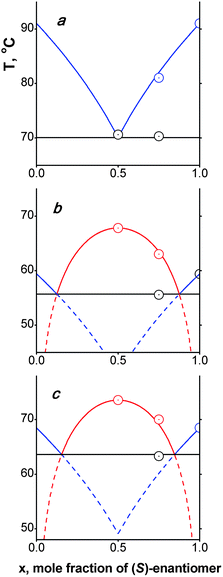 | ||
| Fig. 2 Experimental points (circles) and calculated (solid lines fragments) binary melting phase diagrams for compounds 1–3. The blue liquidus legs are calculated according eqn (1), the red liquidus legs are calculated according eqn (2), and black lines correspond to (hypothetical) solidus lines. | ||
The common solution for eqn (1) and (2), which is the intersection of the red and/or blue phase diagram legs in Fig. 2, is the eutectic point. Calculated and experimental values for eutectic (subscript eu) fusion temperatures, as well as their enantiomeric compositions (x is a molar fraction of a predominant enantiomer) are also listed in Table 2. It could be noted that this last parameter of compound 2 is closely matched by that of 3.
Leaving the thermochemical block of our investigation, let us sum up intermediate totals. On the one hand, we have found the multiformity of solid phases and, possibly, mesophases of tolyl glycerol ethers 1–3 initiated by heating/cooling processes. An in-depth analysis of these unexpected phenomena cannot be provided here, and will be the objective of our subsequent work. On the other hand, it was found that the stable crystalline forms of 1–3, obtained through solution crystallization processes, exist within well known for chiral substances limits “racemic conglomerate – solid racemic compound”. The possible cause-and-effect relations between these extremes in the tolyl glycerol series will be discussed in the next section of this work.
Supramolecular organization of the compounds 1–3 single crystals
All the molecules studied have no unusual bond lengths and bond angles. The conformations for the molecules in crystals could be described by enumeration of torsion angles ω formed by non-hydrogen atoms of the fragment O1C1C2C3O3C4C5 which is common for all compounds 1–3. These torsion angles for all compounds mentioned in the paper are collected in Table 3. Standard conformational acronyms, i.e., ap for antiperiplanar (ω = 180° ± 30°), sp for synperiplanar (ω = 0° ± 30°), sc for synclinal (ω = 60° ± 30°), and ac for anticlinal (ω = 120° ± 30°) conformations are used for conformer identification. For the purpose of comparison, all the torsions are listed for R-enantiomers (the real torsions for S-enantiomers have the opposite signs). All the samples investigated here except scal-3 contain two symmetry independent molecules in their unit cells. These molecules are denoted as A and B in Table 3 and in the subsequent text.
| Compound | Molecule | Torsions (ω value, °/conformation) | |||
|---|---|---|---|---|---|
| C5C4O3C3 | C4O3C3C2 | O3C3C2C1 | C3C2C1O1 | ||
| scal-1 | A | −179.8/ap | −175.0/ap | −59.6/−sc | −60.4/−sc |
| B | −177.9/ap | −175.1/ap | 65.3/sc | 60.6/sc | |
| scal-2 | A | 177.0/ap | −173.6/ap | −61.3/−sc | −57.9/−sc |
| B | 176.2/ap | 178.8/ap | 56.2/sc | 56.7/sc | |
| rac-2 | A | −176.6/ap | −178.3/ap | −52.4/−sc | −161.8/ap |
| B | −178.2/ap | −178.8/ap | −53.2/−sc | −160.6/ap | |
| rac-3 | A | 179.1/ap | −178.2/ap | −50.0/−sc | −161.8/ap |
| B | 177.1/ap | −177.6/ap | −52.1/−sc | −166.1/ap | |
| scal-3 | A | −176.8/ap | 174.7/ap | 54.8/sc | 52.3/sc |
In the subsequent discussion we shall use extensively the information about intermolecular hydrogen bonds realized in the single crystals of different 1–3 samples. Table 4 gives the quantitative information about these hydrogen bonds.
| D–H⋯A | d(H⋯A)/Å | d(D⋯A)/Å | ∠DHA/° | Symmetry operation | |
|---|---|---|---|---|---|
| (R)-1 | O1A–H1A⋯O2B′ | 1.84(3) | 2.734(2) | 173(3) | x, −1 + y, z |
| O2B–H2B⋯O1B′ | 1.89(3) | 2.728(2) | 177(2) | ||
| O1B–H1B⋯O2A′′ | 1.79(3) | 2.698(2) | 172(2) | 2 − x, 1/2 + y, 1 − z | |
| O2A–H2A⋯O1A′′′ | 1.81(3) | 2.714(2) | 165(2) | x, 1 + y, z | |
| (S)-2 | O1A–H1A⋯O2B′ | 1.95 | 2.753(3) | 168 | 1 − x, 1/2 + y, 1 − z |
| O1B–H1B⋯O2A′ | 1.89 | 2.697(3) | 167 | — | |
| O2A–H2A⋯O1A′′ | 1.92 | 2.724(3) | 168 | x, −1 + y, z | |
| O2B–H2B⋯O1B′′′ | 1.87 | 2.690(3) | 173 | x, 1 + y, z | |
| rac-2 | O1A–H1A⋯O2A | 1.93 | 2.744(3) | 175 | x, −1 + y, z |
| O1B–H1B⋯O2B | 1.95 | 2.756(3) | 168 | x, 1 + y, z | |
| O2A–H2A⋯O1A | 2.27 | 2.744(3) | 118 | ||
| O2B–H2B⋯O1A | 1.91 | 2.716(3) | 168 | — | |
| rac-3 | O1A–H1A⋯O2A | 2.00 | 2.710(6) | 144 | x, 1 + y, z |
| O1B–H1B⋯O2B | 1.98 | 2.743(6) | 156 | ||
| O2A–H2A⋯O1B | 1.93 | 2.715(6) | 161 | x, 1 − y, 1/2 + z | |
| O2B–H2B⋯O1A | 2.40 | 2.675(5) | 101 | x, −1 + y, z | |
| (S)-3 | O1–H1⋯O2 | 1.83(2) | 2.661(1) | 175(1) | −x, 1/2 + y, 3/2 − z |
| O2–H2⋯O1 | 1.78(2) | 2.681(1) | 177(2) | 1 + x, y, z |
In the case of mephenesin-like compounds the homochirality of the materials of construction (molecules) is transferred on the next structural level, so the columns appear to be homochiral too. The sequence of the column-forming intermolecular hydrogen bonds constitutes a helix. Eight molecules, four A and four B, take part in a one helix pitch. The detailed description of the column internal structure will be presented in the next section concerning the (S)-2 crystal organization. On the whole, the crystal packing for 1 was found to be sufficiently loose with a Kitajgorodskij packing index18 of only 67.5%.
As was mentioned above, non-racemic samples of para-tolyl glycerol ether 3 are effective molecular gelators for hydrocarbon solvents.6 It might be well to examine this ability for the conglomerate-forming ortho-derivative, mephenesin 1. Up to now, only the chiral drug methocarbamol, i.e.1-carbamoyloxy-2-hydroxy-3-(2-methoxyphenoxy)propane, is known to be simultaneously a conglomerate former and a low molecular weight (hydro)gelator.19 A striking feature of the hydrogels derived from an intermediate enantiomeric purity methocarbamol lies in the fact that the stable periodic structures in the shape of concentric ellipses, close in appearance with the well known Liesegang rings, arise on the gel surface. After the detection of this phenomenon we have associated it with the methocarbamol tendency for spontaneous resolution.19 It would be important to find another conglomerate-forming molecular gelator to have additional evidences to confirm or disprove our hypothesis.
To our great disappointment, all our attempts to obtain molecular gels involving 1 and a series of solvents (such as aliphatic and aromatic hydrocarbons, chlorinated hydrocarbons, acyclic and cyclic ethers, alcohols, and water) were unsuccessful. It is apparent, that all of the mentioned crystal organization features, namely the participation of eight molecules in the crystal motif primary unit formation, the loose nature of the crystal packing, the one-dimensionality of hydrogen bonded constructions and related to this phenomenon the mechanical weakness of the primary associates arising in solutions, add up to an obstacle for the apprearance of durable, elongated nanosize ensembles formation in solutions and supramolecular gels.
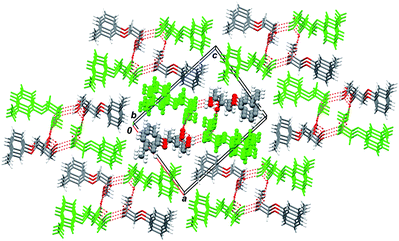 | ||
| Fig. 3 1D H-bonded column (marked in bold style) surrounded by the same six ones in the crystal of compound (S)-2; viewed along the 0b axis. Symmetry independent A molecules are depicted in green. The columns are physically bonded by hydrophobic dispersion interactions. | ||
As in the case of mephenesin, scal-2 molecules belonging to the same column are linked by system of classic intermolecular hydrogen bonds O–H⋯O. Fig. 4 illustrates this pattern in more detail. In Fig. 4 the upper left and lower right stacks are formed by A molecules (let us denoted them using indices L and r), while the lower left and upper right stacks are formed by B molecules (denoted by L and r indices by analogy). The numbers in front of the molecule symbol denote layer membership: number 1 stands for the closest to the viewer layer. It is obvious from Fig. 4 that the sequence “closest donor–closest acceptor” starts from the H1 hydroxyl group atom of 1A(r) molecule and finishes at the O1 hydroxyl group atom of 3A(r) molecule constituting a full M-helix pitch. Note that eight molecules fall inside one helix pitch, and the S-molecules packing gives rise to a left-handed M-helix. These features completely coincide with the same ones of mephenesin 1.
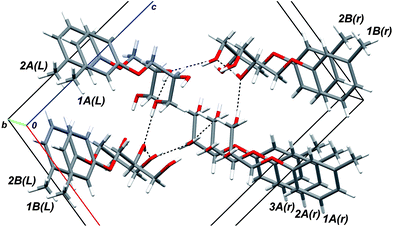 | ||
| Fig. 4 The detailed view of the intermolecular hydrogen bond pattern in the (S)-2 crystal. Upper left and lower right stacks are formed by A molecules (marked by indices L and r), while the lower left and upper right stacks are formed by B molecules (denoted by L and r indices). The numbers in front of the molecule symbol denote layer membership: number 1 stands for the closest to the viewer layer. | ||
Nevertheless, against all the similarities, the free energy of racemic compound formation for compound 2 amounts to −2.70 kJ mol−1 (Table 2); whence it follows that the crystal lattice of scalemic meta-tolyl glycerol ether is less stable than the crystal lattice of the racemic derivative. This raises the question about the reasons for such destabilization, at least, in comparison with the ortho-derivative 1.
Using the possibilities of the WinGX program package, we have generated the hypothetic structure in which the methyl substituent in the crystal lattice of mephenesin changes its original ortho position to a meta one. Fig. 5 shows the fragment of this artificial “meta-mephenesin” structure. The obvious resemblance between Fig. 5a and Fig. 3 is quite natural. As in the real 1 and scal-2 structures, the H-bonded columns are integrated with one another by dispersion interactions of their hydrophobic periphery, and yet it follows from Fig. 5 that the steric conflict arises between the methyl substituents belonging to different columns. The unfavorable contact zones are marked by gray ovals in Fig. 5a. One of these zones is reproduced in another projection in Fig. 5b. In the hypothetic “meta-mephenesin” structure alternating distances between carbon atoms of the methyl substituents belonging to the adjacent columns were calculated to be 2.1 and 3.0 Å, which is much less than 4.0 Å, the sum of van-der-Waals radii of two methyl groups.
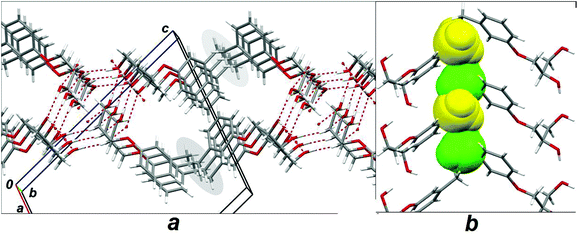 | ||
| Fig. 5 Fragments of crystal packing of hypothetic structure of mephenesin 1 having meta instead orthomethyl substituent in the phenyl ring. (a) View along the 0b axis; gray ovals mark zones of the steric conflicts. (b) View of one of these zones along the 0a axis; conflicting methyl groups are marked by “spacefill” style. | ||
In the real scal-2 packing the destabilized interactions aroused at the column periphery cause the columns to separate from one another. The change in the intercolumn distance effects the additional loosening of the packing. The packing index for (S)-2 crystals amounts to only 65.5%, which is close to lower limit of a crystal phase stability (according to Kitajgorodskij the “packing index for a vast majority of crystals is in the range from 0.65 to 0.77”18).
Hence all the above listed factors for 1 crystals and the even more loose nature of the scal-2 packing render the gel-forming abilities for the enantiopure meta-tolyl glycerol ether impossible. This last effect was experimentally checked by us.
The principal motif for the rac-2 crystal lattice is the 2D bilayer formed by molecules bonded by intermolecular hydrogen bonds (Fig. 6).
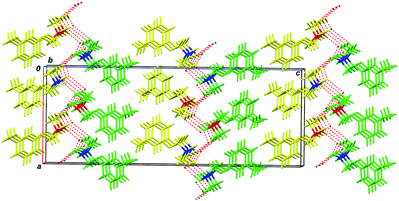 | ||
| Fig. 6 2D H-bonded bilayers in the crystal of compound rac-2; viewed along the 0b axis. The bilayers are physically bonded by hydrophobic dispersion interactions. Hydrogen bonds are depicted by red dashed lines. Symmetry independent A molecules are marked in yellow; B molecules in green; (R) chiral centers are marked in red, and (S) chiral centers are marked in blue. | ||
The central part of these columns is formed by the developed system of intermolecular hydrogen bonds and is hydrophilic in nature. The columns are linked with one another only through hydrophobic and/or dispersion interactions of the vast periphery formed mainly by o-tolyl fragments.
As may be seen from Fig. 6, the oxygen atoms, which are usually considered as hydrophilic, are concentrated in the central part of the bilayer. The bilayers are linked with one another through hydrophobic and/or dispersion interactions of the vast periphery formed mainly by m-tolyl fragments as viewed in Fig. 7.
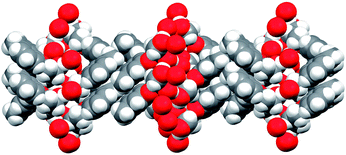 | ||
| Fig. 7 Hydrophilic and hydrophobic layer alternation in the rac-2 crystals; oxygen atoms are marked in red. Viewed along the 0a axis. | ||
Obviously, the 2D nature of the principal motif is favorable for more dense molecular packing as compared to scal-2. The quantitative measure of this effect, the packing index, gives for rac-2 the value 68.6%. It is clear also that the rigid inflexible character of the principal crystal-forming motif precludes the elongated fiber formation during the early crystallization steps. This is a serious handicap to any molecular gel formation, which is the case for rac-2 samples.
As was discussed above, the scal-1 crystal packing bears great similarities to the scal-2 packing. On the basis of the foregoing discussion, it is reasonable to expect that rac-1 could be crystallized in the lattice which resembles the crystal lattice of rac-2. In reality it is not so, and rac-mephenesin crystallizes as a mixture of enantiopure crystals. To understand the reasons for such behavior we have generated, by analogy with artificial “meta-mephenesin”, the hypothetic structure of “ortho-2” in which the methyl substituent in the crystal lattice of rac-2 changes its original meta position to an ortho one (Fig. 8).
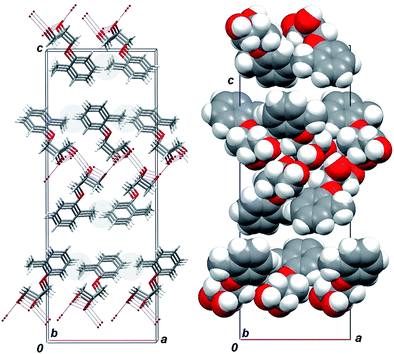 | ||
| Fig. 8 Fragment of crystal packing of hypothetic “ortho-2” structure having ortho instead metamethyl substituent in the phenyl ring; viewed along the 0b axis. (a) Zones of intrabilayer steric conflicts, which are marked by gray ovals. (b) “Scattered” bilayers marked by “spacefill” style. | ||
Analysis of the so-generated crystal structure for the first time reveals destabilizing short contacts between methyl substituents and hydrogen atoms of the neighboring phenyl rings belonging to the common bilayer (Fig. 8a). The alternating distances between carbon atoms of the methyl substituents and the hydrogen atoms were calculated to be 2.5 and 2.8 Å, which is less than 3.2 Å, the sum of van-der-Waals radii of methyl group and hydrogen atom. For the second time, within the hypothetical “ortho-2” packing the crystal-forming structures (bilayers) turn out to be deprived of bonding contacts (Fig. 8b), and adjacent bilayers flake off. Either of the two factors would be sufficient to make racemic packing for compound 1 difficult; at least, in close to the rac-2 form.
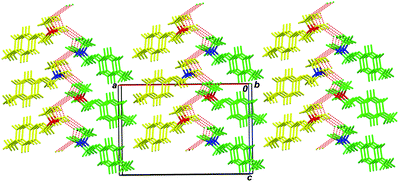 | ||
| Fig. 9 2D H-bonded bilayers in the crystal of compound rac-3; viewed along the 0b axis. Hydrogen bonds are depicted by red dashed lines. Symmetry independent A molecules are marked in yellow, B molecules in green; (R) chiral centers are marked in red, and (S) chiral centers are marked in blue. | ||
The presence of the second order screw axes in the crystal lattice of rac-2 (space groupPca21) results in an organization of the bilayers of antiparallel ∧∨∧∨ type, in which the H-bond system zigzag changes its direction from bilayer to bilayer. Racemic 3 crystallizes in the more primitive space groupPc, and the bilayers in its crystals are symmetrically linked by simple translation. For this reason the bilayers form a parallel pattern of ∧∧∧∧ type. It is obvious from Fig. 6 and Fig. 9 that the unfavorable steric short contacts of methyl substituents belong to adjacent bilayers (which should arise in the event that screw axes 21 should appear in the rac-3 crystal lattice) preventing the racemic para-tolyl glycerol ether from being crystallized in the higher space group.
The packing index for rac-3 amounts to 67.9%, which is to say that the rac-3 packing is looser than that for rac-2, but it is denser than the packing of scalemic 1 and 2. It is evident that this gain in density precludes the spontaneous resolution of racemic para-tolyl glycerol ether. It was experimentally shown that rac-2 is not gelation-prone. It is clear, by analogy with rac-3, that the rigid inflexible character of the principal crystal-forming motif precludes the elongated fibers formation during the early crystallization steps.
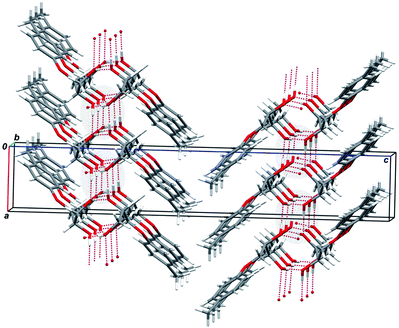 | ||
| Fig. 10 Fragment of crystal packing of the enantiopure para-tolyl glycerol ether sample (S)-3; viewed along 0b axis. Gray ovals mark the spiral succession of the intermolecular hydrogen bonds. | ||
As it seen from the figure, the principal supramolecular motif in the scal-3 crystals is a bilayer. The individual bilayer fragments (molecules) are joined together with a system of intermolecular H-bonds O–H⋯O. The supramolecular associates realized in the scal-3 crystals differ from the bilayers that form rac-2 and rac-3 crystals by the H-bond system features (see Fig. 6 and Fig. 9). Unlike 2D networks in the last two cases, H-bonds within the scal-3 bilayer form 1D sequences organized along 21 screw axes parallel to the 0b direction.
As is shown in Fig. 10, where these H-bond systems are marked by the gray color, the important feature of the ascertained hydrogen bond system lies in its chirality: the succession “closest donor–closest acceptor” (⋯O1–H1⋯O2′–H21′⋯O1′′–H1′′⋯) organized along the 0b axis in the crystals of (S)-3 gives rise to a right-handed P-helix. It is significant that only four molecules fall inside of one helix pitch, instead of eight in the case of scal-1 and scal-2. The supramolecular organization of the para-derivative scal-3 closely matches that of the ortho-methoxyphenyl glycerol ether, chiral drug guaifenesin.3 The features of the “guaifenesin-like” and “mephenesin-like” crystal packing were discussed in detail in our preceding publications.3,16 The factors that inhibit mephenesin 1crystallization in the “guaiphenesin-like” crystal lattice were also discussed.16
As it was noted in the introduction, the samples of scal-3 form long fibrils in the hydrocarbon media during the supramolecular gelation process. These thin fibers are easily detected in the xerogel structures in the photographs obtained by optical microscope (Fig. 11), atomic-force microscope (Fig. 12), and scanning electron microscope (the figures are published in our work6).
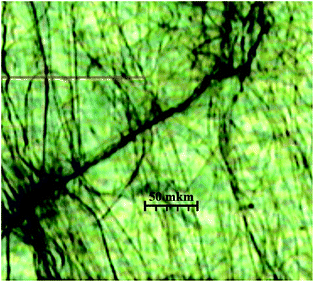 | ||
| Fig. 11 Fibers of nonracemic p-tolyl glycerol ether scal-3, obtained after in vacuosolvent evaporation from nonane gel placed on a mica surface. Broad dark zones = mica surface cracks. | ||
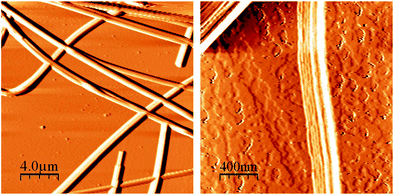 | ||
| Fig. 12 AFM images of (S)-3/nonane gel samples air dried from the solvent on a mica surface. (a) Two types of fiber crossing in p-tolyl glycerol ether xerogels. (b) Layered structure of an individual fiber. | ||
As is shown in Fig. 11, the scal-3 xerogel obtained through fast solvent (nonane) evaporation from a thin gel film placed on a mica surface presents bundles of fibers, the length of which is far in excess of its diameter. When the gel is formed, these fibrils threading the entire volume immobilize the solvent. The mode of the fibril network formation could be traced by atomic-force microscopy.
Thus, it is well seen from Fig. 12 that some fibers simply overlay other ones. This observation strongly suggests that similar fibers exist independently of one another in a gel media. The other sort of fibers intergrows through one another producing knots with resulting network mechanical strength enhancement.
We believe that the fibers providing the gel-forming abilities to the non-racemic para-tolyl glycerol ether samples keep the main structural features inherent to scal-3 single crystals. The results of scal-3 gels and xerogels investigations by powder X-ray diffraction are good indirect evidence of our assumption. Thus the sample of gel derived from nonane and (S)-3 containing about 3% of another enantiomer (HPLC control) being placed on the glass plate produces no distinct powder diffraction pattern. The pattern is beginning to emerge against a background of the diffuse halo as the solvent evaporates (Fig. 13c). The experimental X-ray powder diffraction pattern (Fig. 13d) was obtained after the substantial gel portion was air dried and slightly ground on the glass plate.
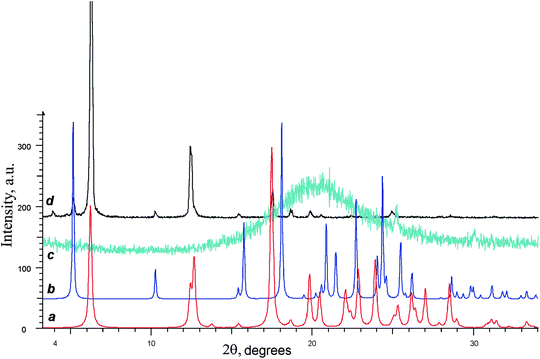 | ||
| Fig. 13 Experimental XRPD diffractograms of gel (c, turquoise curve) and xerogel (d, black curve) prepared from (S)-3 sample containing about 3% of (R)-3. Bottom curves represent powder diffractograms calculated from single crystal X-ray data for (S)-3 (a, red curve) and rac-3 (b, blue curve). | ||
Referring to Fig. 13, essentially all peaks of the experimental patterns coincide with the peaks of the simulated PXRD patterns for single crystals of (S)-3 (Fig. 13a) and rac-3 (Fig. 13b). The presence of the crystalline rac-3 (<10%) in the final crystal mixture is attributed to the admixture of minor enantiomer in the initial (S)-3 sample. As is known from experience, rac-3 takes no part in the molecular gelation process.6 Hence, the supramolecular fibers are formed by the major enantiomer, and it is safe to assume that these fibers have the same inherent structure that the crystal scal-3 samples have.
We believe that the features of the “guaifenesin-like” crystal packing of scal-3 may have a bearing on the stable fibers formation. The above-mentioned helixes in the scal-3 bilayers are organized by H-bond successions ⋯O1–H1⋯O2′–H21′⋯O1′′–H1′′⋯. The angle between O1–H1⋯O2′ atoms is 176°, and the distance H1⋯O2′ is equal to 1.83 Å. For the system O2–H21⋯O1′ the same parameters are 177° and 1.79 Å. In both cases the angle is close to ideal value of 180°, and the H⋯O distance is sufficiently shorter than the sum of the van-der-Waals radii (1.2 + 1.4 = 2.6 Å). Such a system that is stable to deformations could be treated as some kind of elongated cylindrical stiffener. Within a bilayer these rigid cylinders are bound by H1O1C1C2O2H21 fragments, which retain the capability for minor deformations at the cost of bonded and especially torsion angles variations. Thereby this succession of lengthy stiffeners bound by relatively flexible connectives is comparable with rollup bamboo blinds.
It is assumable that scal-3 being crystallized from dilute solutions will form isolated bilayers as presented in Fig. 10 in the early crystallization steps. To a first approximation, the diffusion rate is inversely proportional to the diffusing structures size. Hence in a dilute medium the bilayer growth will pass ahead of the bilayers aggregation. The excessive surface energy of the forming flat moiety therewith could be compensated through its rolling around some external axis parallel to the crystallographic 0b direction. As this takes place, a long and sufficiently strong multilayer hollow tube-fiber forms. Resuming the analogy, this process reminds us of the rolling up of the bamboo blinds into a stiff roll.
It is possible to estimate the radius of the primary tube formed from the bilayer. Let us visualize this tube as a cylinder with the wall thickness equal to the bilayer thickness l. Let us denote the internal and external radius of the cylinder as r and r + l, respectively. The bilayer deformation d, associated with its folding to a tube (d = 0 for unperturbed case when a bending radius is infinite) could be estimated as the external-to-internal circumference ratio (r + l)/r = 1 + d, then r = l/d. According the X-ray data the bilayer thickness is l ≈ 15 Å, whence it follows that for the relative deformation d = 0.05 (5%) the minimal tube radius amounts to r ≈ 30 nm. It is clear that the external radius increases as the number of layers increases, and the deformation decreases in the process. In this manner the inherent structure of the multilayer nanotube is able to be very close to the monocrystal structure.
During our SEM and AFM investigations we were never able to observe the fibers with a measured thickness less that 70 nm. The usual thickness of the individual fibrils (which differ markedly from the bundles) was 100–1000 nm. Our estimate is close to these values. At last, the multilayer character of the fibrils-nanotubes comes into particular prominence from Fig. 12b. It seems likely that, after the solvent removal, the hollow nanotube collapses. Its surface curvature increases sufficiently in the process and the tube bursts. A lamellate character of the fracture is well seen in the picture.
Conclusions
According to differential scanning calorimetry data all the studied chiral ortho-, meta-, and para-tolyl glycerol ethers 1–3 are prone to form metastable phases during melt crystallization. At the same time, thermodynamically stable crystal phases arise during solution crystallization. The binary melting phase reconstructed for these last phases; on this basis it was found that ortho-derivative 1 is prone to spontaneous resolution, and that meta- and para-derivatives 2 and 3 form stable solid racemic compounds, the Gibbs energy of formation for which are found to be −2.70 and −2.43 kJ mol−1 respectively.It was also established that only non-racemic samples of para-tolyl glycerol ether 3 are able to produce supramolecular gels. All other samples of tolyl glycerol ethers were found to be devoid of this ability.
Solution grown single crystals of 1–3 were investigated by the X-ray diffraction method, and the principal crystal formative motifs were revealed for these substances. For the scal-1 and scal-2 crystals the motif consists of 1D columns fastened by a spiral system of intermolecular hydrogen bonds OH⋯O(H). Eight molecules take part in a one helix pitch, and the S-molecules packing gives rise to a left-handed M-helix. It was supposed that the crystal organization features, namely, the participation of eight molecules in the crystal motif primary unit formation, the loose nature of the crystal packing, the one-dimensionality of hydrogen bonded constructions and related to this phenomenon mechanical weakness of the primary associates arisen in solutions, all add up to an obstacle for the appearance of durable elongated nanosize ensembles in solutions and supramolecular gels formation by scal-1 and scal-2.
The principal crystal formative motifs for rac-2 and rac-3 were 2D bilayers having developed a 2D system of intermolecular hydrogen bonds. In these cases the dense, rigid, and inflexible character of the principal motif precludes the elongated fibers formation during the early crystallization steps, as well as any molecular gels formation.
The crystal organization of the non-racemic scal-3 drops out from the general tolyl glycerol ethers family. The principal supramolecular motif in this case is a bilayer too, but unlike the developed H-bond 2D networks in the rac-2 and rac-3 crystals, H-bonds within the scal-3 bilayer form 1D helixes organized along 21 screw axes parallel to the 0b direction. Such a system that is stable to deformations could be treated as a cylindrical stiffener. Within a bilayer these rigid elements are bound by flexible molecular fragments. On the whole this succession of lengthy stiffeners bound by relatively flexible connectives is comparable with rollup bamboo blinds.
It is assumable that scal-3, being crystallized from dilute solutions, will form isolated bilayers on the early crystallization steps, and that the growth of these bilayers will pass ahead of their aggregation. The excessive surface energy of the forming flat moieties therewith could be compensated through its rolling around some external axis parallel to the crystallographic 0b direction. As this takes place, long and sufficiently strong multilayer hollow tube-fiber forms. Resuming the analogy, this process reminds us of the rolling up of the bamboo blinds into a stiff roll. The so-formed mechanically stable fibers, threading the entire volume, immobilize the solvent and provide a means for supramolecular gel formation.
Acknowledgements
The authors thank the Russian Fund of Basic Research for financial support (Grant number 09-03-00308). The authors also thank Irek R. Nizameev for valuable technical assistance with atomic-force microscopy and Flura S. Akhatova for valuable help with some samples preparation.References
- (a) The Merck Index, 14th edn, Ed. M. J. O'Neil, Merck and Co., Inc.: Whitehouse Station, NJ, USA, 2006, p. 2178 Search PubMed; (b) The Merck Index, 14th edn, Ed. M. J. O'Neil, Merck and Co., Inc.: Whitehouse Station, NJ, USA, 2006, p. 4555 Search PubMed; (c) The Merck Index, 14th edn, Ed. M. J. O'Neil, Merck and Co., Inc.: Whitehouse Station, NJ, USA, 2006, p. 5849 Search PubMed.
- A. A. Bredikhin, Z. A. Bredikhina, S. N. Lazarev and D. V. Savel'ev, Mendeleev Commun., 2003, 13, 104–105 CrossRef.
- A. A. Bredikhin, A. T. Gubaidullin, Z. A. Bredikhina, D. B. Krivolapov, A. V. Pashagin and I. A. Litvinov, J. Mol. Struct., 2009, 920, 377–382 CrossRef CAS.
- (a) L. Perez-Garcia and D. B. Amabillino, Chem. Soc. Rev., 2002, 31, 342–356 RSC; (b) L. Perez-Garcia and D. B. Amabillino, Chem. Soc. Rev., 2007, 36, 941–967 RSC.
- A. A. Bredikhin, Z. A. Bredikhina, V. G. Novikova, A. V. Pashagin, D. V. Zakharychev and A. T. Gubaidullin, Chirality, 2008, 20, 1092–1103 CrossRef CAS.
- A. A. Bredikhin, Z. A. Bredikhina, F. S. Akhatova and A. T. Gubaidullin, Chem. Commun., 2010, 46, 3523–3525 RSC.
- F. Theil, J. Weidner, S. Ballschuh, A. Kunath and H. Schick, J. Org. Chem., 1994, 59, 388–393 CrossRef CAS.
- G. M. Sheldrick, SADABS, Program for empirical X-ray absorption correction, Bruker-Nonius, 2004 Search PubMed.
- APEX2 (Version 2.1), SAINTPlus. Data Reduction and Correction Program (Version 7.31A), Bruker Advansed X-ray Solutions, Bruker AXS Inc.: Madison, Wisconsin, USA, 2006 Search PubMed.
- G. M. Sheldrick, SHELXTL v.6.12, Structure Determination Software Suite, Bruker AXS Inc.: Madison, Wisconsin, USA, 2000 Search PubMed.
- L. J. Farrugia, J. Appl. Crystallogr., 1999, 32, 837–838 CrossRef CAS.
- A. L. Spek, J. Appl. Crystallogr., 2003, 36, 7–13 CrossRef CAS.
- C. F. Macrae, P. R. Edgington, P. McCabe, E. Pidcock, G. P. Shields, R. Taylor, M. Towler and J. van de Streek, J. Appl. Crystallogr., 2006, 39, 453–457 CrossRef CAS.
- I. Prigogine and R. Defay, Chemical Thermodynamics, Longmans and Green, London, New York, 1954 Search PubMed.
- Z. J. Li, M. T. Zell, E. J. Munson and D. J. W. Grant, J. Pharm. Sci., 1999, 88, 337–346 CrossRef CAS.
- A. A. Bredikhin, A. T. Gubaidullin and Z. A. Bredikhina, J. Mol. Struct., 2010, 975, 323–329 CrossRef CAS.
- (a) L. Sohncke, Entwicklung einer Theorie der Krystallstruktur, Leipzig, 1879 Search PubMed; (b) H. D. Flack, Helv. Chim. Acta, 2003, 86, 905–921 CrossRef CAS.
- A. I. Kitajgorodskij, Molecular Crystals and Molecules, Academic Press, N.Y., London, 1973 Search PubMed.
- A. A. Bredikhin, Z. A. Bredikhina and A. V. Pashagin, Mendeleev Commun., 2011, 21, 144–145 CrossRef CAS.
Footnote |
| † CCDC reference numbers 693626, 755204, 755205, 826679 and 826680. For crystallographic data in CIF or other electronic format see DOI: 10.1039/c1ce05637a |
| This journal is © The Royal Society of Chemistry 2012 |

